
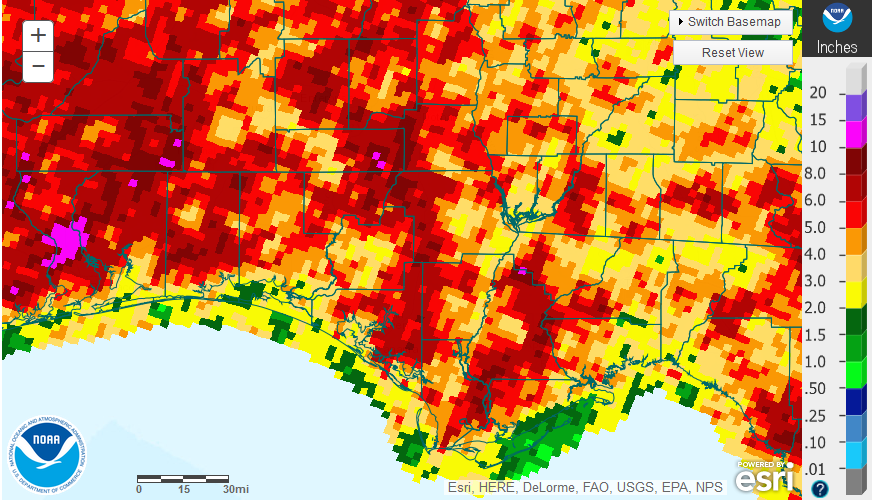
National Weather Service estimates for July 2016 rainfall.
Typically, July in the Florida Panhandle is the wettest month of the year with 6-7″ of rainfall. In the graphic above, areas that are hot pink or dark red did receive over 6″ in July, but this was not the case for many central and eastern counties. The regions highlighted in tan and yellow had less than 4″ of rainfall in July.
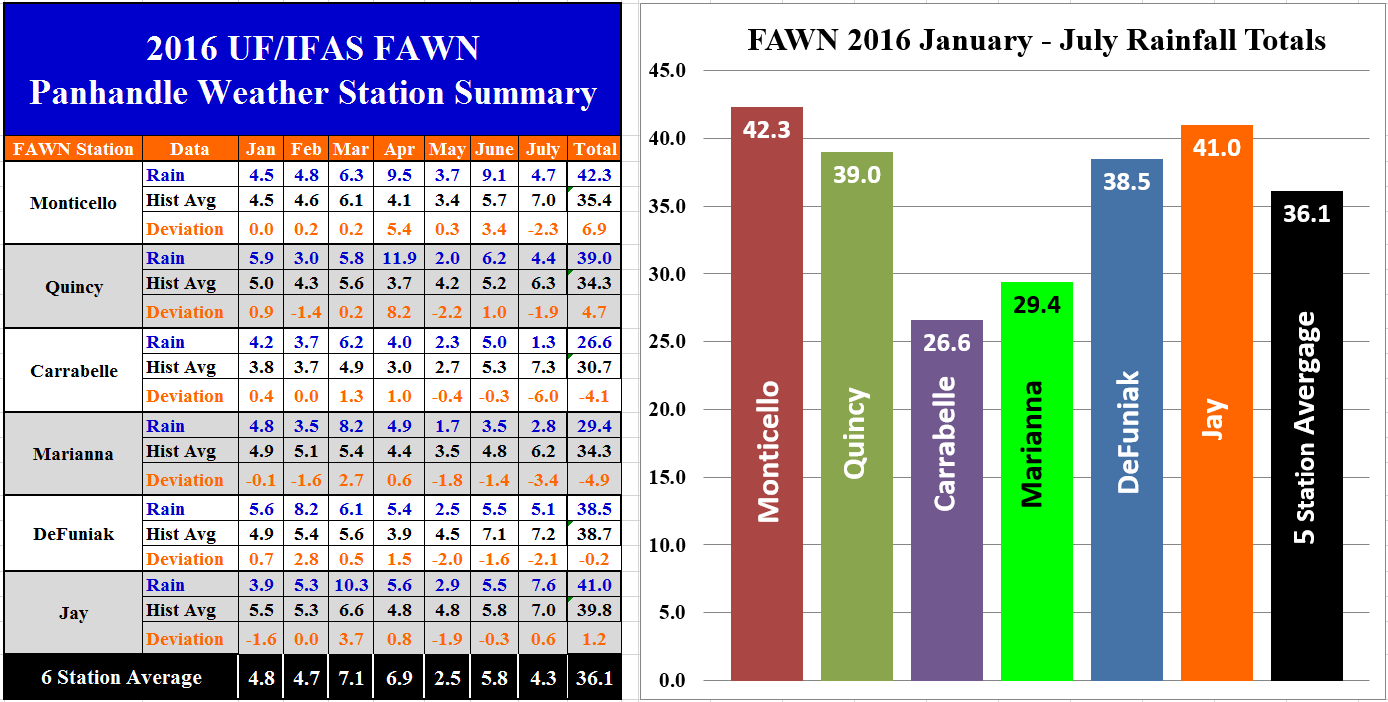 The Florida Automated Weather Network (FAWN) stations in the Panhandle showed the variation across the Panhandle as well. Only the Jay station was above historic average for the month of July. For the first seven months of 2016, only the Monitcello, Quincy, and Jay stations were above averages for those locations. Thanks to field data collected in March and April, we have some data for the Quincy station to replace the data lost with the bad gauge. The Marianna station has recorded only 29″ through July, nearly 5″ below average for the year. Carrabelle has recorded the lowest rainfall totals for the year, with less than 27″ of rain, more than 4″ below historic average for that location.
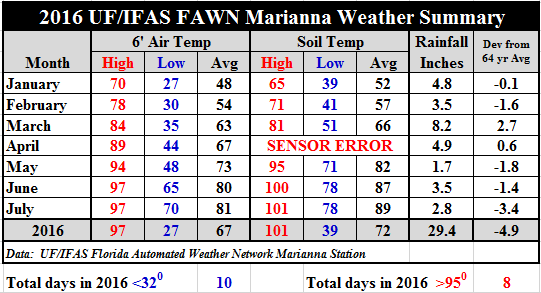 Temperatures were slightly hotter than in June. The average air temperature climbed to 81° and the average soil temperature to 89°. There were five days that the 6′ air temperature was above 95°, and the soil temperature rose above 100° in early July. To view daily temperature and rainfall totals from the Marianna FAWN station, download: 2016 Jan-July Weather Summary.
3 Month Outlook
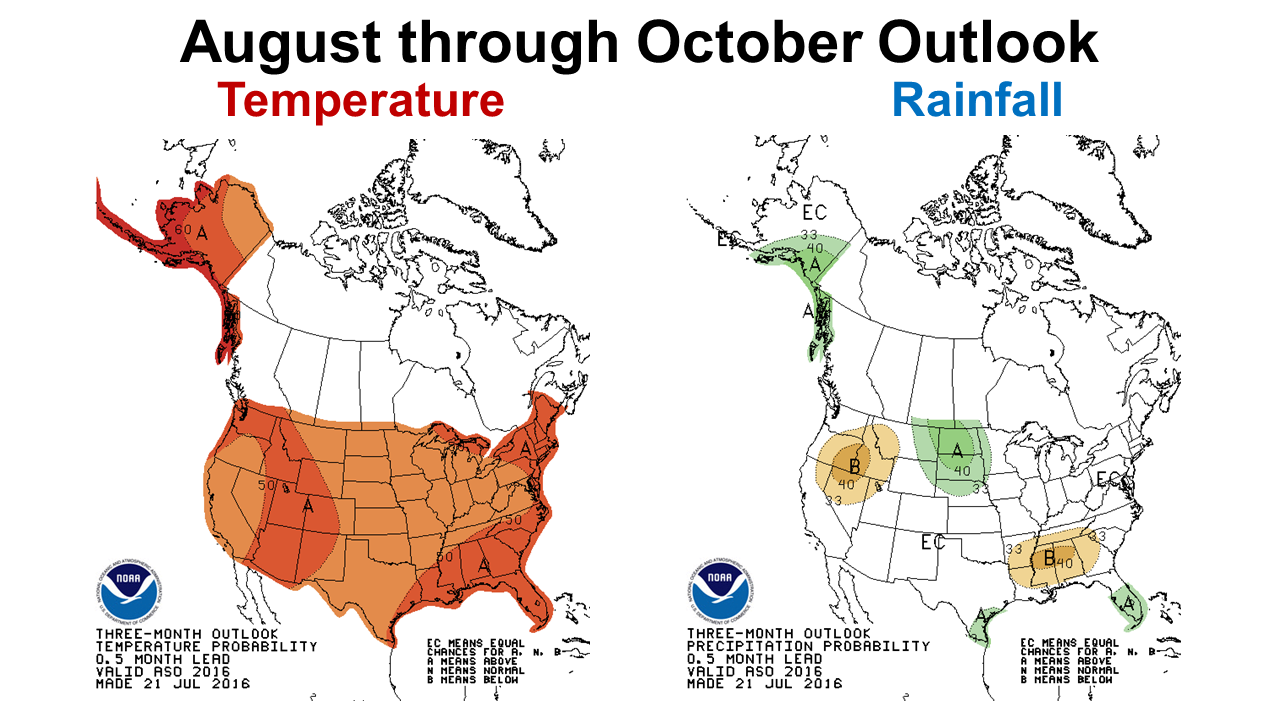 The three month outlook provided by the Climate Prediction Center (CPC) calls for above average temperatures over the next three months across the Southeast. The CPC is forecasting below average rainfall for much of the Southeast, but left the Florida Panhandle out of that zone prediction. It does appear that Panhandle farmers can expect the heat to continue for several more months.
La Niña Watch
Last month the Climate Prediction Center provided the following report on July 14th:
ENSO-neutral conditions were observed during the past month. Many models favor La Niña by the end of the Northern Hemisphere summer, continuing during fall and lasting into winter. Statistical models predict a later onset time (i.e., mid-fall) than dynamical models, and also predict a relatively weaker event. The forecaster consensus is somewhat of a compromise between the two model types, favoring La Niña onset during the August-October season, and predicting a weak event, if an event were to form. Overall, ENSO-neutral conditions currently prevail and La Niña is favored to develop by August – October 2016, with about a 55-60% chance of La Niña during the fall and winter 2016-17. Climate Prediction Center
What does a La Niña mean for agriculture in the Panhandle? Typically ENSO phases have the greatest impact from November through March, but can have affects earlier and later in the year. In a La Niña phase, Panhandle weather is warmer and dryer than normal. The AgroClimate website has a full discussion of typical ENSO phase impacts on different types of crops, but in general, small grains, winter cover crops, and winter forage yields are lower, but summer crops can benefit from reduced pests and diseases. The CPC is predicting a 55-60% chance of a weak La Niña for the 2016-17 cool season, so growers should keep an eye on this forecast as we move closer to the time for cools season crop and pasture planting decisions.
The following are examples of average yield data for wheat and peanuts during the three ENSO phases:
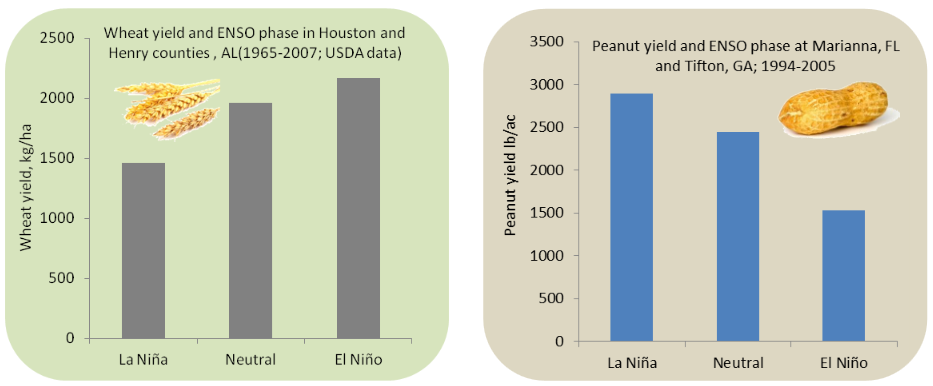
Source: AgroClimate
demayo@ufl.edu - 850-482-9620
Follow me on Twitter
@UFCowman