
Irrigated farm land in the Panhandle rented for an average of $138 per acre in 2017.
Some of the most challenging conversations, in almost any relationship, are the ones about money. This is certainly true as farmers and landowners negotiate lease agreements, or managers and workers negotiate salaries for the year ahead. It can be pretty challenging to determine a “fair price” to rent a specific farm, or to set the wages for the skill sets of a specific employee. However, if you know the average rates, based on actual farm survey data , it does provide an unbiased place to start negotiations. As with all statistics, just knowing the average is only part of the story, but at least it offers a reference point for both parties to begin those awkward conversations.
Farm Land Rental Rates
The USDA’s National Agricultural Statistic Service (NASS) annually surveys farm managers to provide average land rental rates. Unfortunately their survey summary does not offer the range of rates paid, but does offer county, regional, or state averages that provide an unbiased place to begin negotiations. There are a number of factors that influence the rental value of farm land. Certainly farm size, crop history, soil type, and location influence lease rates. A large, 300 acre field would be more attractive to rent than 15 acres, or a farm next door to an existing operation is more valuable than an operation 10 miles away. The amount of Farm Bill Base Acreage assigned to the land also plays a role in setting the value of crop land rental rates. Certainly the market for different commodities also plays a role. If the cattle prices are lower this year, demand for pasture rental may not be as great.
The following is a summary of the information NASS provides on average land rental rates. Table 1 provides the average rate for renting non-irrigated, or dryland crop land, by county. The average for the whole Panhandle region in 2017 was $61 per acre, per year. There was variation from county to county, with a high of $96.50/acre in Santa Rosa to a low $30.50/acre in Gadsden County.
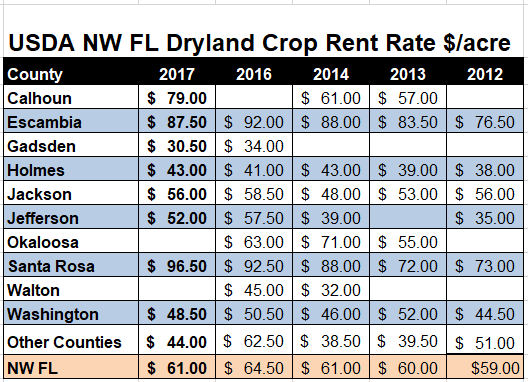
Table 1. Average dryland or rain-fed crop land rental rates in dollars per acre per year.
Since there are not as many irrigated farms, NASS reports their survey results by region, instead of by county. Irrigated crop land is generally more productive and more consistent, so the lease rates are generally much higher per acre. Table 2 shows the variation in irrigated farm lease rates in the tri-states region, with an average of $194/acre for the Southeast in 2017. Notice however, the average rental rates were much lower in Northwest Florida ($138/a) and Southwest Alabama ($133/a) than in Southwest Georgia ($213/a).
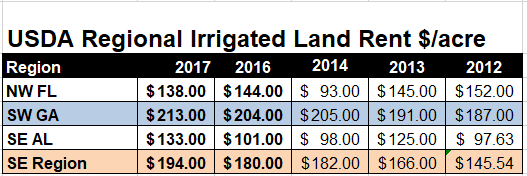
Table 2. Average irrigated crop land rental in dollars per acre per year.
Pasture rental rates were also surveyed. Pasture lease rates are considerably lower than crop land, because livestock generate a much lower return per acre. Table 3 illustrates the range of average pasture rent from $24/acre in Escambia County to $40/acre in Okaloosaa County. The average pasture rent for the entire Panhandle was $28.50/acre in 2017.
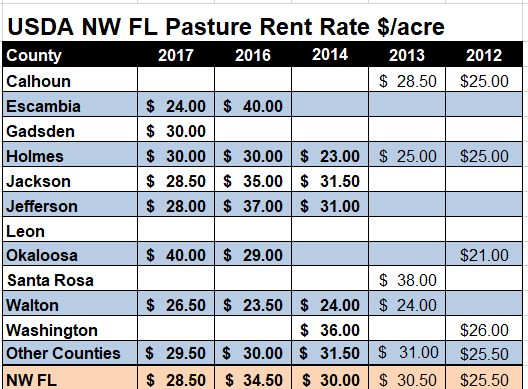
Table 3. Average pasture rental rates in dollars per acre per year.
Farm Labor Wages
The other challenge that farmers and ranchers face is knowing what is a fair rate to pay their hired workers. NASS only reports farm workers in general categories, so the averages provided in Table 4 may not fit specialized categories of workers. NASS also does not provide county or even regional worker wage summaries, so this information came from across the state of Florida. On average Florida crop workers earned $11.10/hour in 2017. Ranch workers earned an average of $12.45/hour, and all Florida farm workers earned an average of $12.31 per hour.
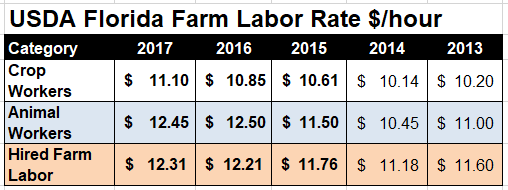
Table 4. Florida farm workers average hourly wage rates.
The USDA’s National Agricultural Statistic Services offers a wide range of additional information based on annual surveys and the Ag Census every five years. To look at the information provided in this article, and other information from their surveys go to: http://quickstats.nass.usda.gov/
demayo@ufl.edu - 850-482-9620
Follow me on Twitter
@UFCowman