
 Rainfall
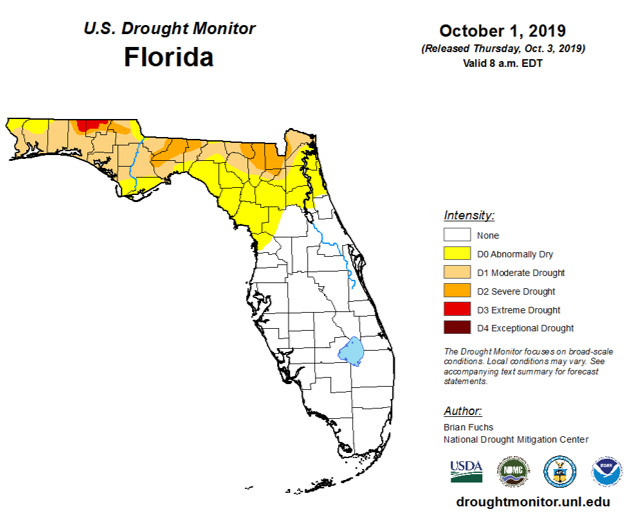
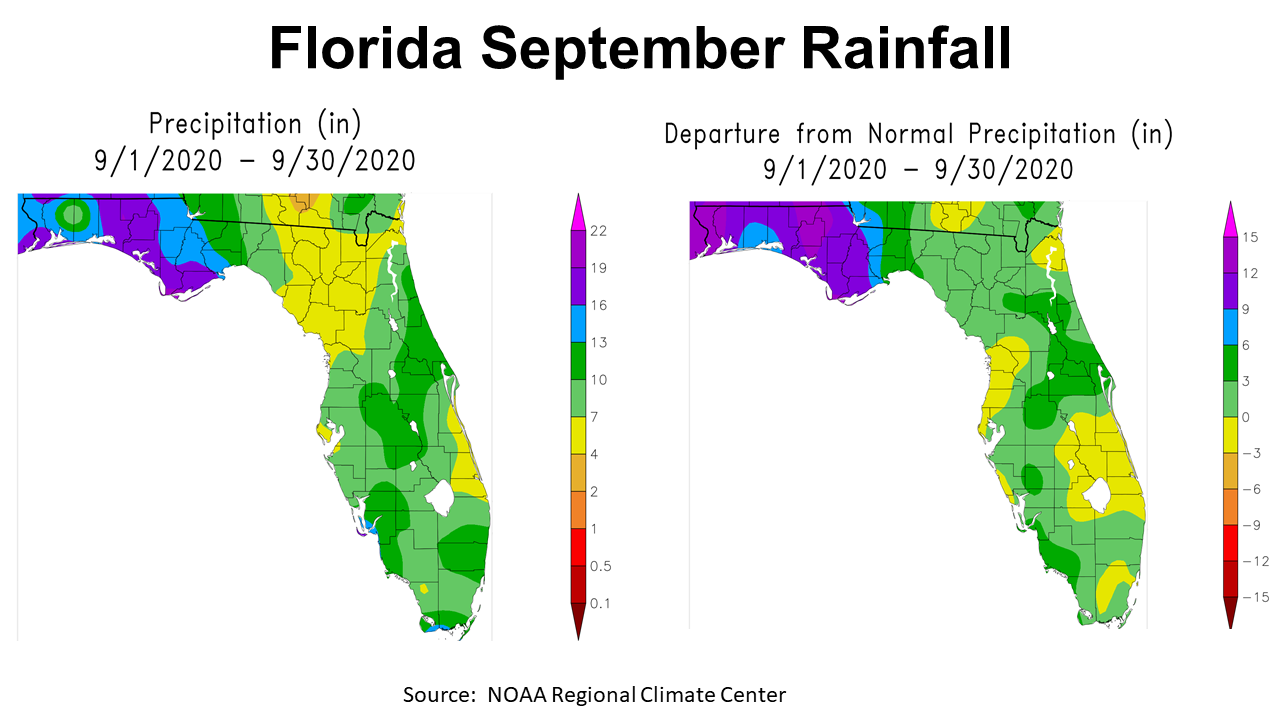
What a difference a year makes. In September of 2019, much of the Panhandle was dealing with a serious drought (map to right), but September 2020 was drastically different. Hurricane Sally and the leftover rainfall from Hurricane Beta caused substantial flooding issues across the Panhandle. The map to the left above shows rainfall estimates for the month of September in Florida. You can see that areas in purple received more than 16″, blue over 13″, and dark green more than 10″. There were areas within those general bands that had even higher totals. The map above to the right is the departure from normal or difference from historic average. Only the areas of Florida in yellow were below average in September 2020. Most of the Panhandle was 6″ to 15″ above normal rainfall for the month.
–
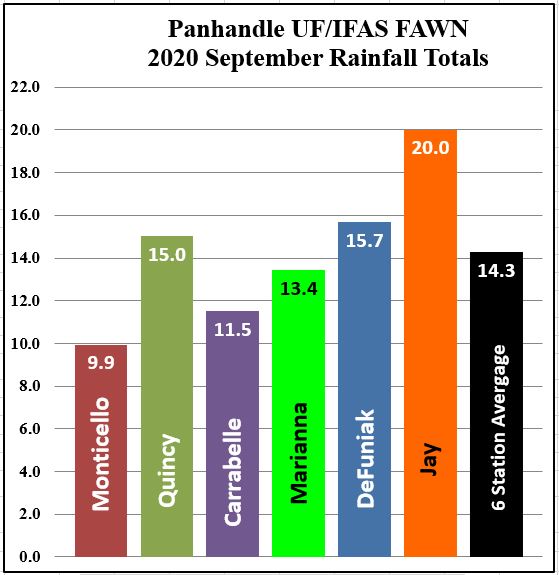
The Florida Automated Weather Network (FAWN) stations recorded 10-20″ of rainfall at the six stations across the Panhandle in September 2020. The Jay station (station furthest west) recorded 20″, while the Monticello station (eastern station), recorded 9.9″ for the month. The average for all six stations was 14.3″, which was 8.9″ above average for September.
–
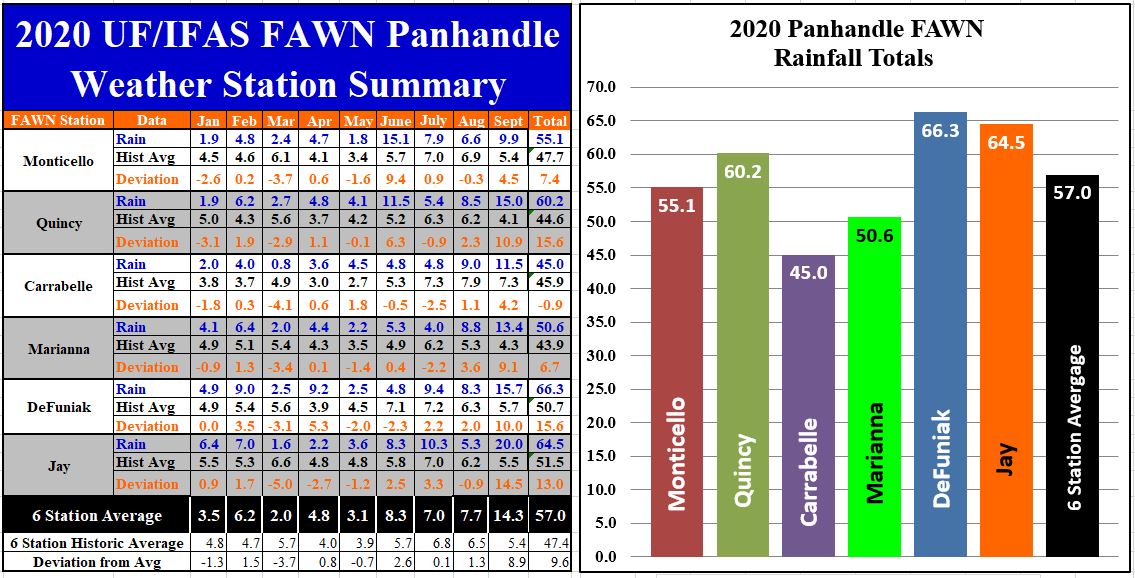
The chart above shows the total rainfall at the six FAWN station locations thus far in 2020. With so much rainfall in September, the Carrabelle station is the only one below the historic nine-month average. The wettest location through 3/4 of a year was DeFuniak Springs, with a total of 66.3″ (15.6″ above average). Historic average annual rainfall for an entire year at that location is 63.7″, so Walton County is already 2.5″ above normal with three months left. The average through nine months in 2020 was 57″ for all six locations, which is 9.6″ higher than average.
–
 –
–
Temperatures
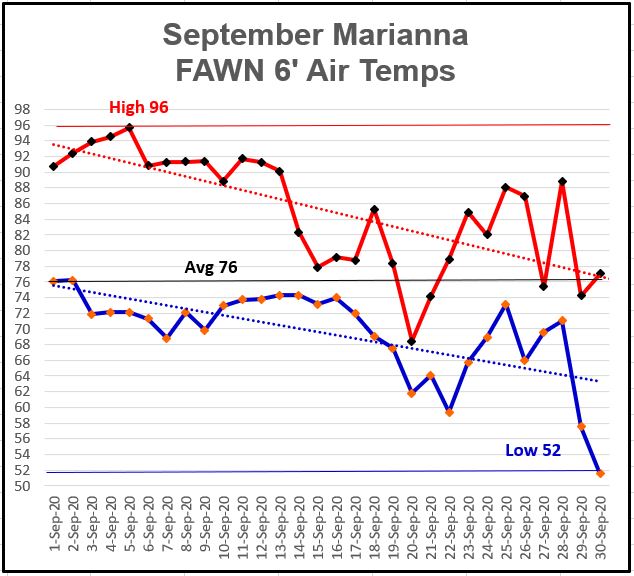
September 2020 started very hot, but cooled rapidly at the end of the month. In Marianna, 6′ air temperatures ranged from a high of 96° on September 5th to a low of 52° on September 30th. The average for the month was 76°. Rainfall was recorded on 13 of 30 days, so that contributed to the cooling trend, but the greatest impact was from an early cold-front that passed through at the end of the month.
–
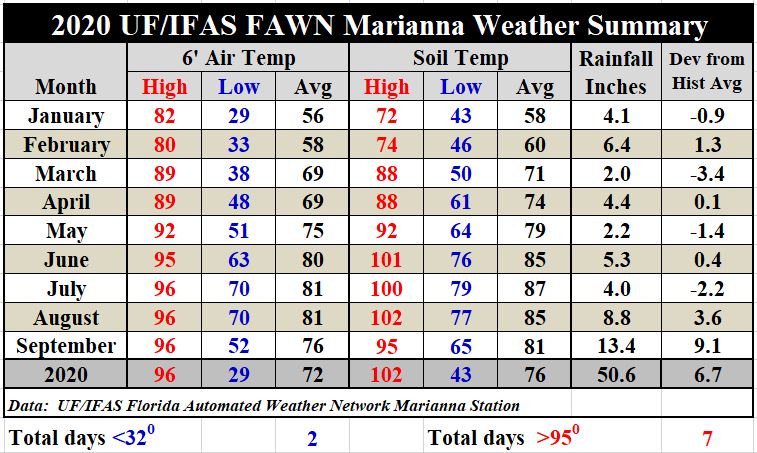
As compared to August, the average air temperature in September was 5° lower, dropping from 81° to 76°. The average soil temperature dropped 4°, from 85° to 81°. Not since May have their been low temperatures in the 50s. Overall it has been a warmer than average year, but there were surprisingly cool nights in May and September.
To access the complete daily rainfall and temperature records from the Marianna FAWN station, as well as the monthly rainfall totals from the six FAWN stations in the Panhandle, use the following link: January-September 2020 Panhandle FAWN Weather Summary.
–
–
Fall/Winter Outlook
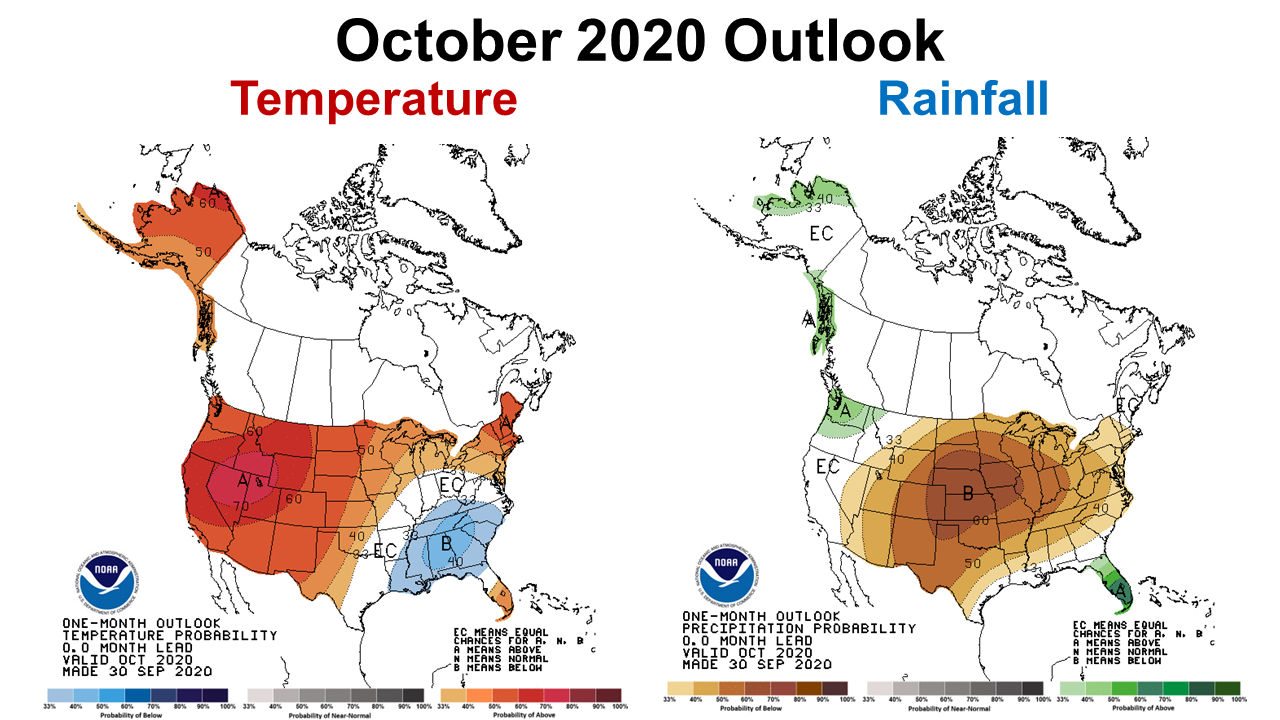
The Climate Prediction Center (CPC) is expecting significant changes to the climate in the coming months. Their most recent outlook forecast for October calls for cooler temperatures than normal for much of the Southeast, for the first time in quite some time. They make no prediction for precipitation across the Panhandle in October, with equal chances of above or below average.
–
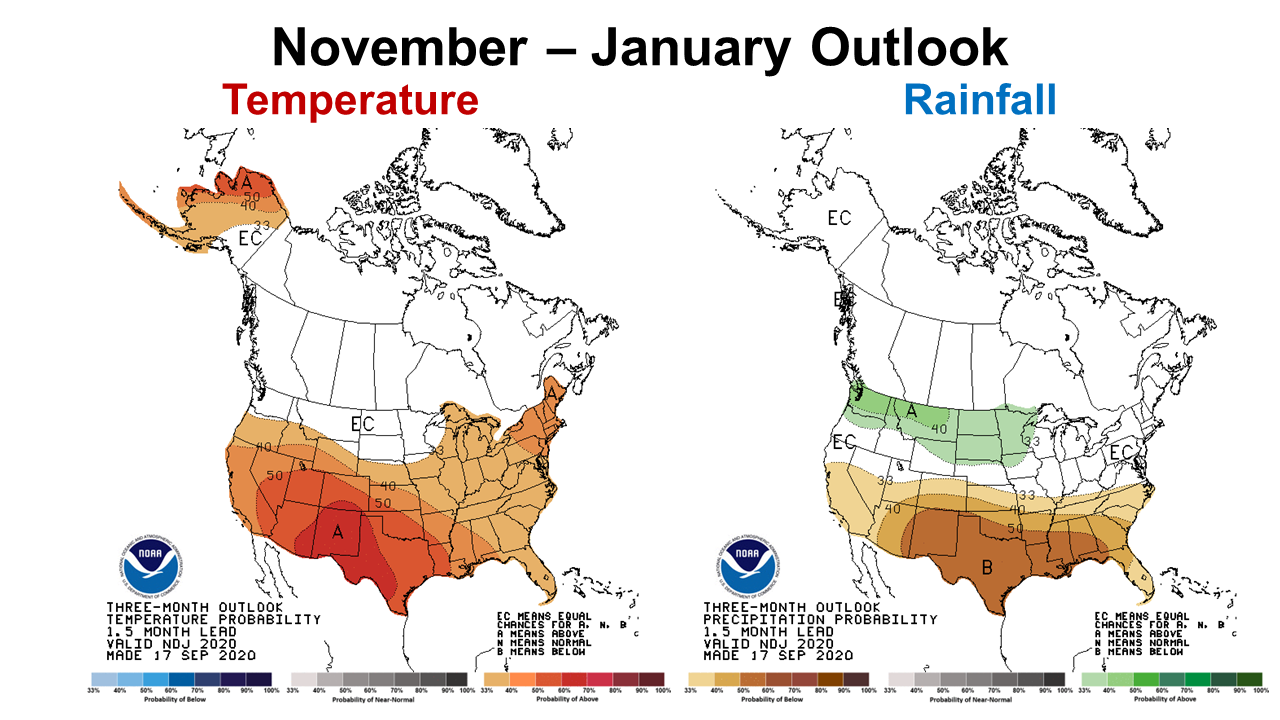
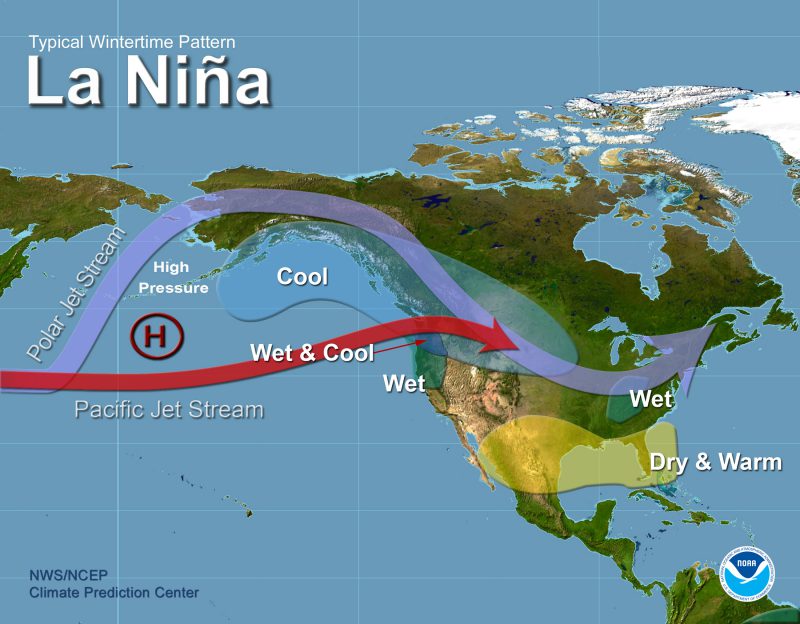
As we move into later into the fall and winter, their forecast drastically changes due in large part to the onset of a cool-season La Niña. As wet as the Panhandle is now, the CPC is not expecting the wet year to continue. A warmer and drier than normal winter is expected for the Panhandle.
–
La Niña Advisory
The CPC has moved from a La Niña Watch to an Advisory. It is here, and the effects are expected to start in November and continue through the winter months.
La Niña conditions are present. Equatorial sea surface temperatures are below average across the east-central and eastern Pacific Ocean.The tropical atmospheric circulation is consistent with La Niña.La Niña conditions are present and are likely to continue through the Northern Hemisphere winter (~75% chance).
–
What does this mean for farmers and ranchers in the Panhandle?
The best guess as to what to expect to close out 2020 is a general drying trend to start this fall and get stronger in the winter months. So hopefully, crop farmers will have favorable weather for harvest finally. After several weeks of rain delays, blue skies and limited rainfall would be welcomed news. Peanuts and cotton have already suffered losses from over-maturity and a significant increase in fungal disease caused by the flooding, so the longer they have to wait for fields to dry enough for harvest equipment the worse the scenario. Let’s keep praying that the tropical storms and excessive moisture are done for the year. The long-range outlook is always less certain, but the best estimate is a warm, dry winter. This is not good news for winter forage crops or small grain production. There should be ample moisture at planting in October, but with the extended harvest delays on our warm season crops, this could become a major issue if planting is also delayed further. It certainly appears the earlier you can plant the better, but the best fields for winter crops may well be the ones that are still saturated from September rains. Add all of this together and it does not look like a great year for cool-season crops and forages. It definitely could be a challenge year to have success overseeded perennial grass pastures that compete for moisture even when dormant. Even so, winter grazing is our best and cheapest feed option if we can get near-to-average yields. I would certainly select your most productive fields that can hold on to moisture to make that investment, and not sandy, well drained fields that are hit or miss in normal years.
demayo@ufl.edu - 850-482-9620
Follow me on Twitter
@UFCowman