
 Rainfall
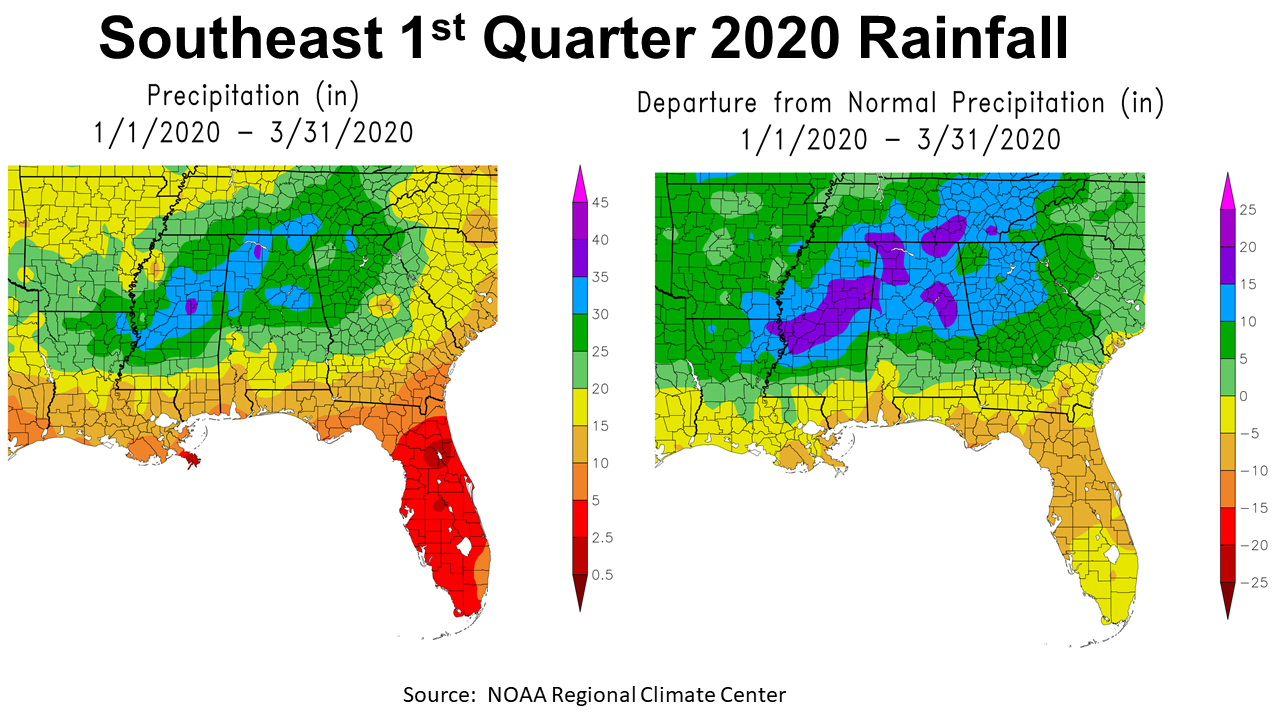
The first three months of 2020 brought heavy rainfall for a good portion of the Southeast, but not in Florida. Peninsular Florida was particularly dry, but the Panhandle was also below average.
–
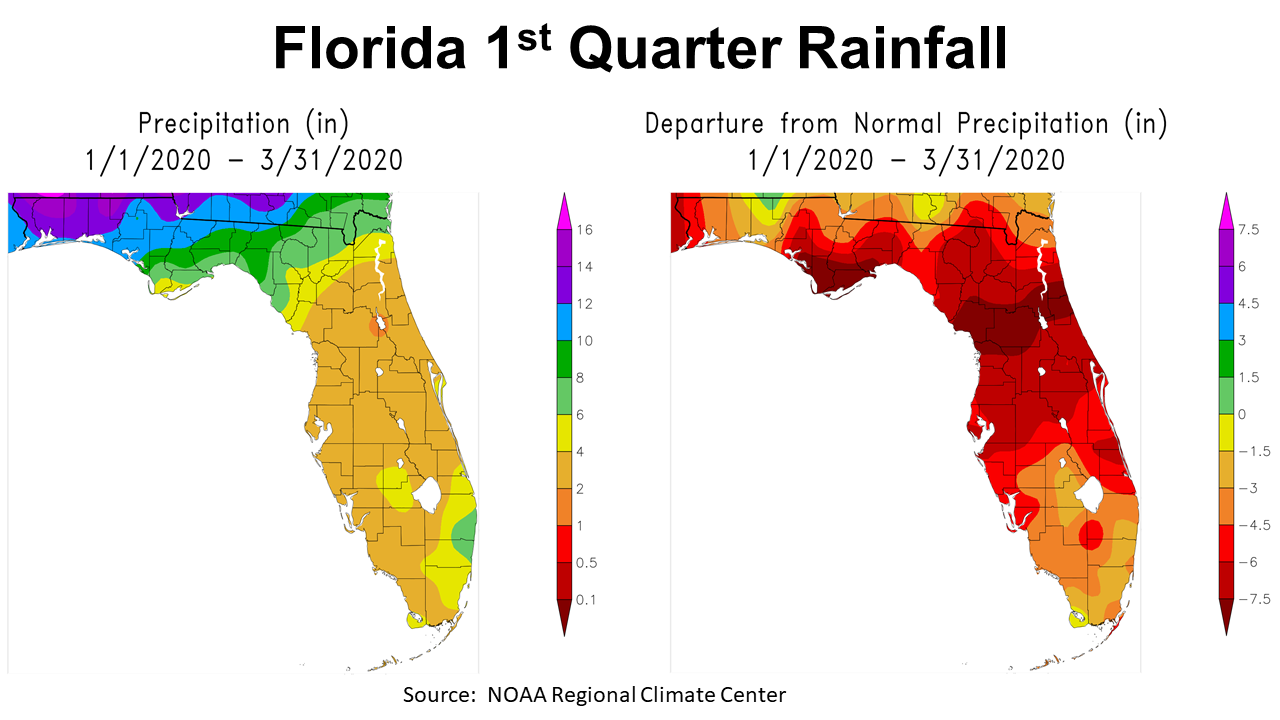
When you drill down on Florida, you can see the normal difference in weather patterns, as the Peninsula receives much lower rainfall amounts from cold fronts than North Florida. In 2020, this disparity was even greater than normal. In the departure from normal map above, you can see that only small portions of Walton and Holmes County received slightly above average rainfall (area in green). Portions of Bay, Gulf, Liberty, Franklin and Wakulla were more than 7″ below normal (brick red). There was also an area in Central Florida that was also really dry, including: Levy, Marion, Putnam, St.Johns, and Flagler Counties.
–
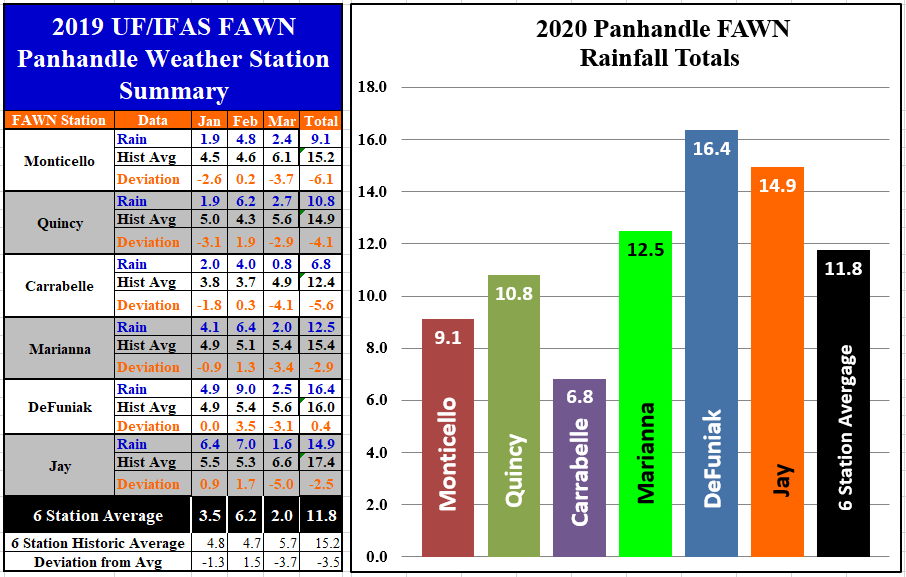
The data from the six Florida Automated Weather Network (FAWN) stations showed how much rain fell across the Panhandle, in the first quarter of 2020. The driest location was in Carrabelle, where only 6.8″ was received, which was -5.6″ below historic average. Monticello was also very dry with only 9.1″, and Quincy received 10.8″. In contrast, the DuFuniak Springs station recorded 16.4″, which was 0.4″ above average for this time period, and the Jay station 14.9″. So, there was a stark contrast between the western and eastern Panhandle counties. All six stations averaged 11.8″ through the 1st quarter, which was -3.5″ below normal.
–
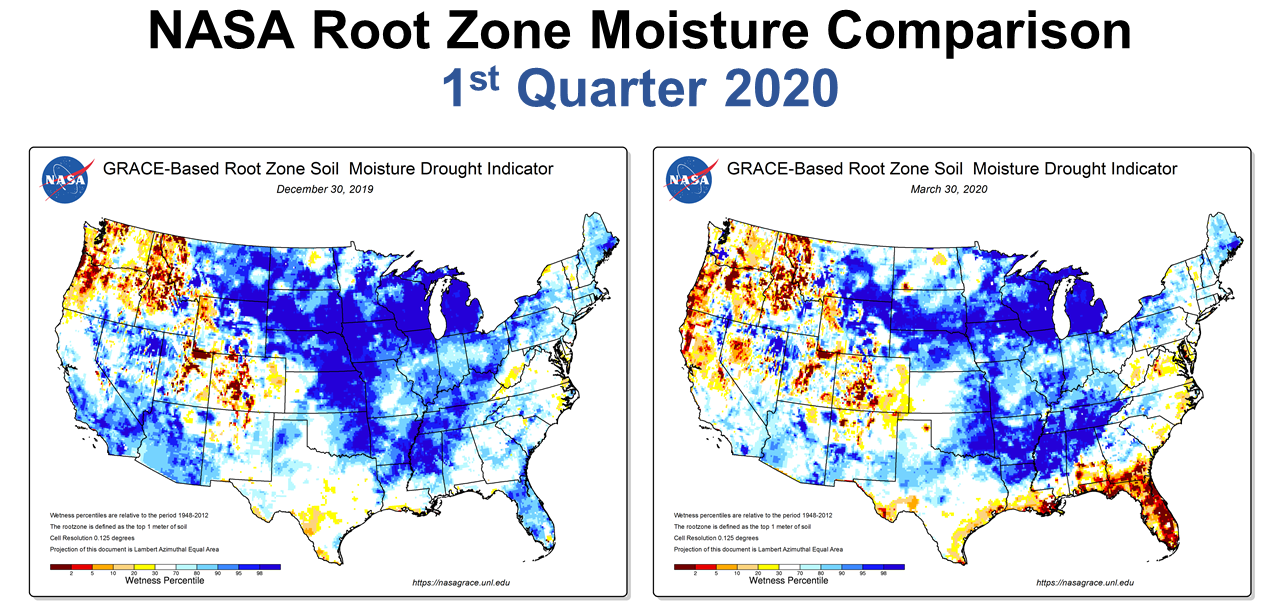
When you look at NASA’s Root Zone maps above you can see the transition from the end of 2019 through the end of March 2020.
–
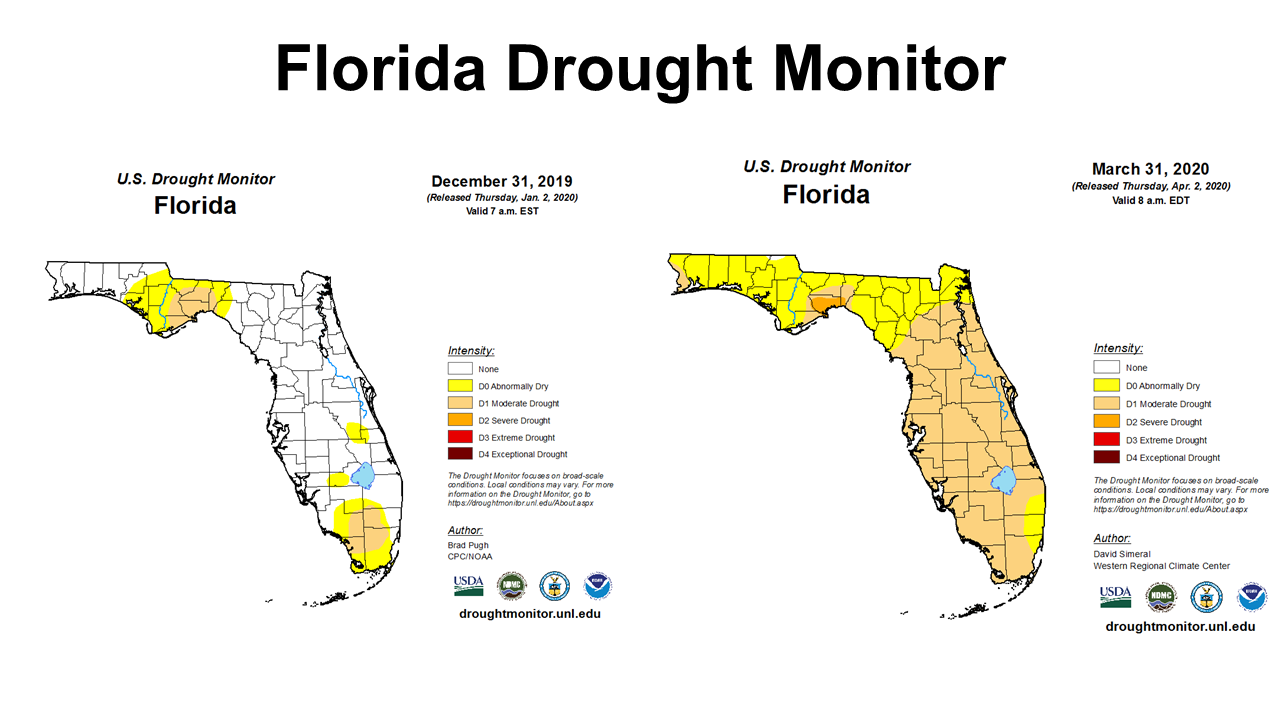 Comparing the Florida Drought Monitor at the end of 2019 to the end of March, you can see the expansion of drought over the last three months. Every Florida county is now included, with Severe Drought in Wakulla, Moderate Drought in Jefferson, Leon, Gulf, Franklin, and Escambia, and Abnormally Dry conditions all across North Florida. Almost all of the Florida Peninsula was also in the Moderate Drought category. The drought status has only gotten worse through the first half of April.
–
Temperatures
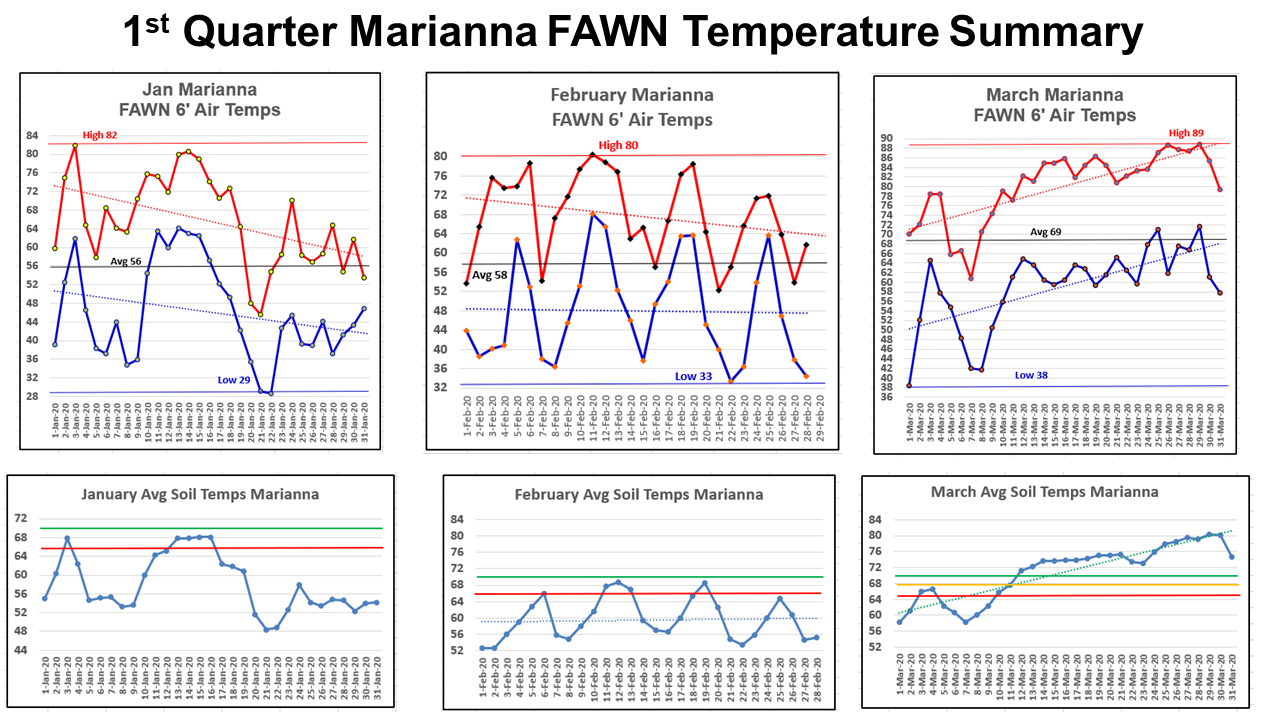 The graphic above has a lot of wavy lines, but it really shows the temperature fluctuations experienced in the 1st quarter. What is interesting is the range in temperatures in each of the first three months: 29-82° in January, 33-80° in February, and 38-89° in March. While this dashboard of daily weather is busy, it is really interesting to look at the changes to average soil temperatures. The 65° red line is the minimum recommend temperature for cotton and peanut seed germination, while the green line at 70° is the ideal temperature. Looking at the 2020 data, you can see that from March 12 on, the daily average soil temperature remanded above 70°, which is something we would normally see in mid-April.
–
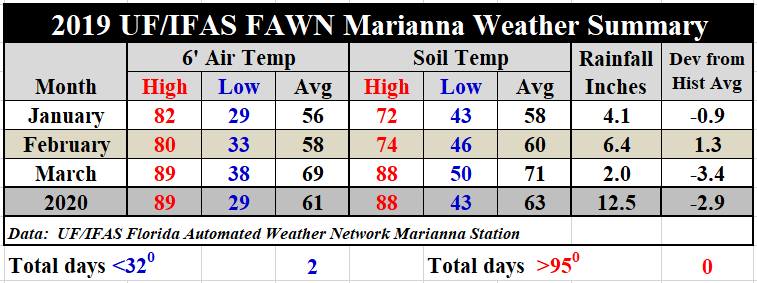
The Marianna FAWN summary chart makes it a little easier to compare the changes in temperature by month. Average 6′ air temperatures increased from 56° in January, to 58° in February, and then jumped to 69° in March. Average soil temperatures increased from 58° in January, to 60°, then 71° in March. To see the complete daily weather data from Marianna, and monthly rainfall at all six Panhandle FAWN stations, use the following link: January-March 2020 FAWN Weather Summary
–
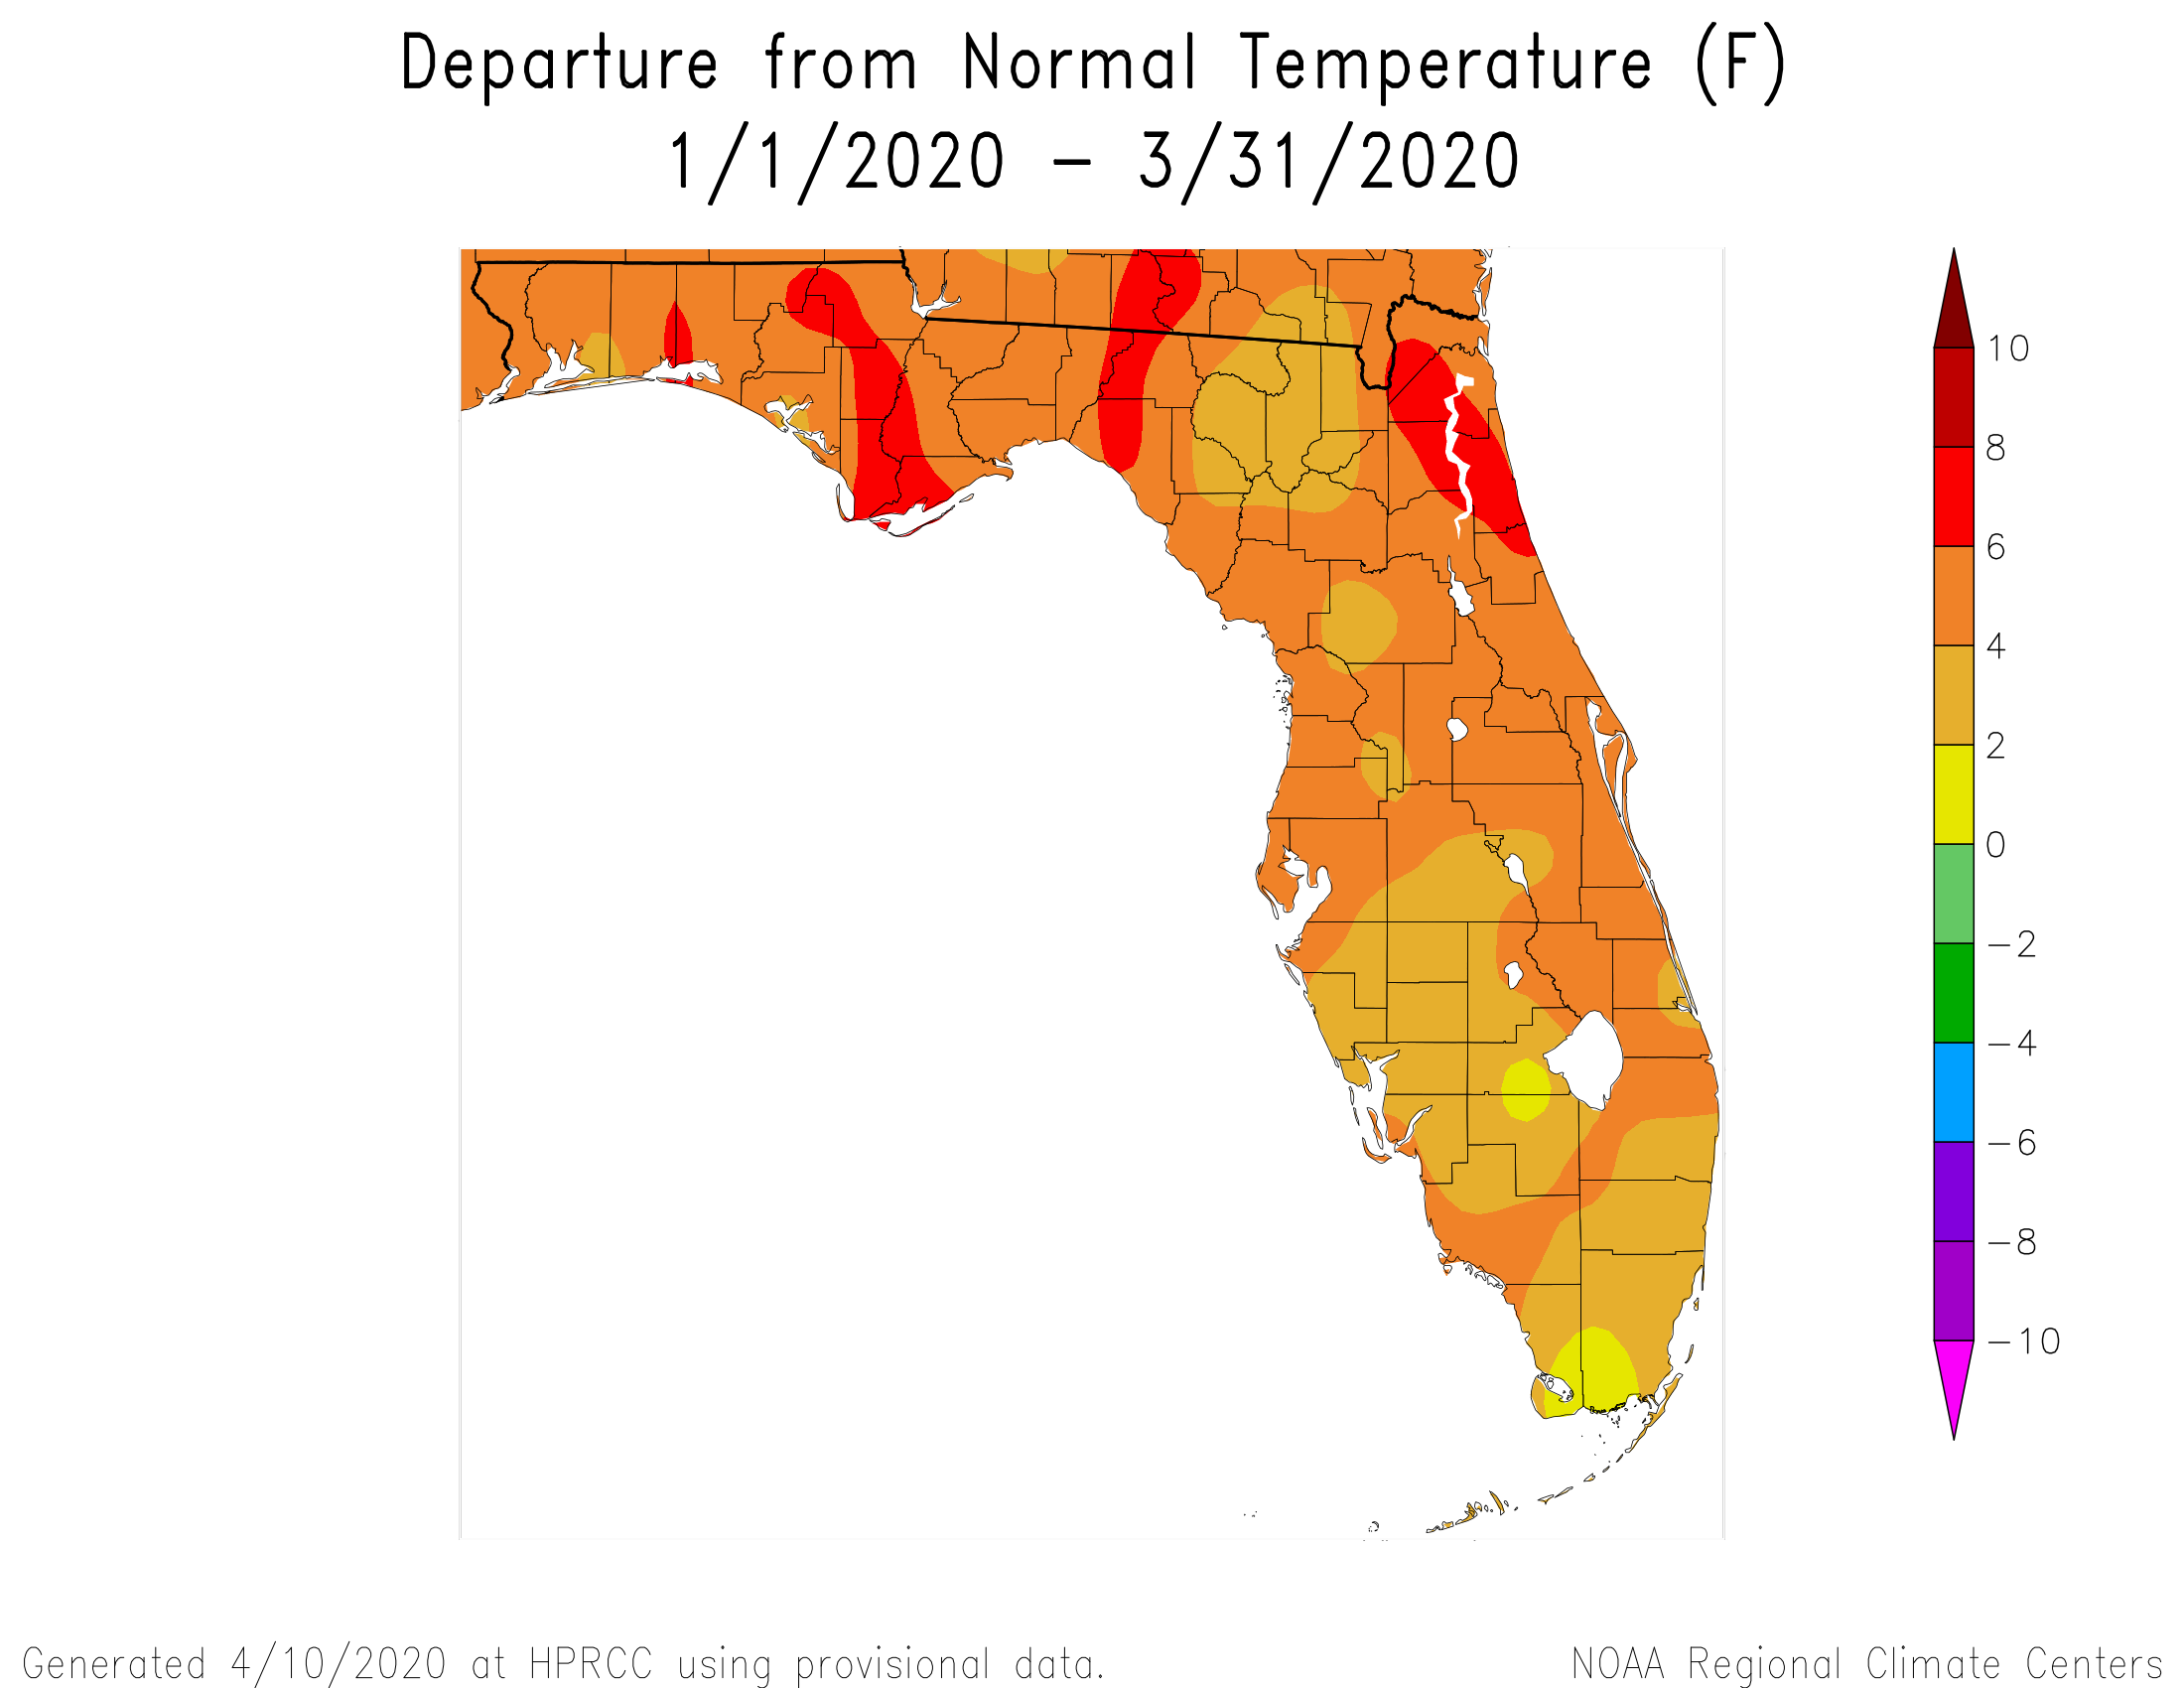
The question arises though, how do the temperatures in 2020 compare to the historic average? You can see from the Departure from Normal Temperature map above that the entire Panhandle was 4-6° warmer than normal (brown), but along part of the the path of Hurricane Michael, it was 6-8° warmer than average through the first quarter of 2020.
Climate Outlook
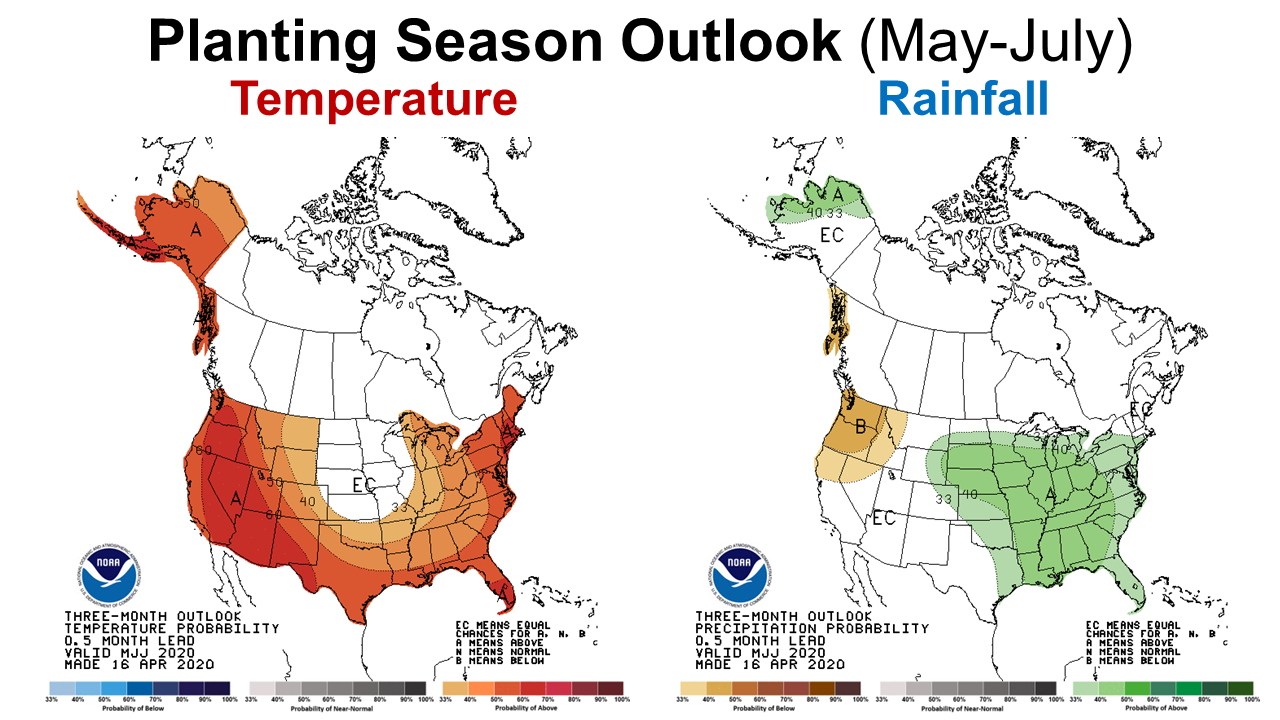
The Climate Prediction Center (CPC) is expecting above average temperatures to continue through July across the peanut and cotton belt, and also above average rainfall. This combination does make early planting look promising.
–
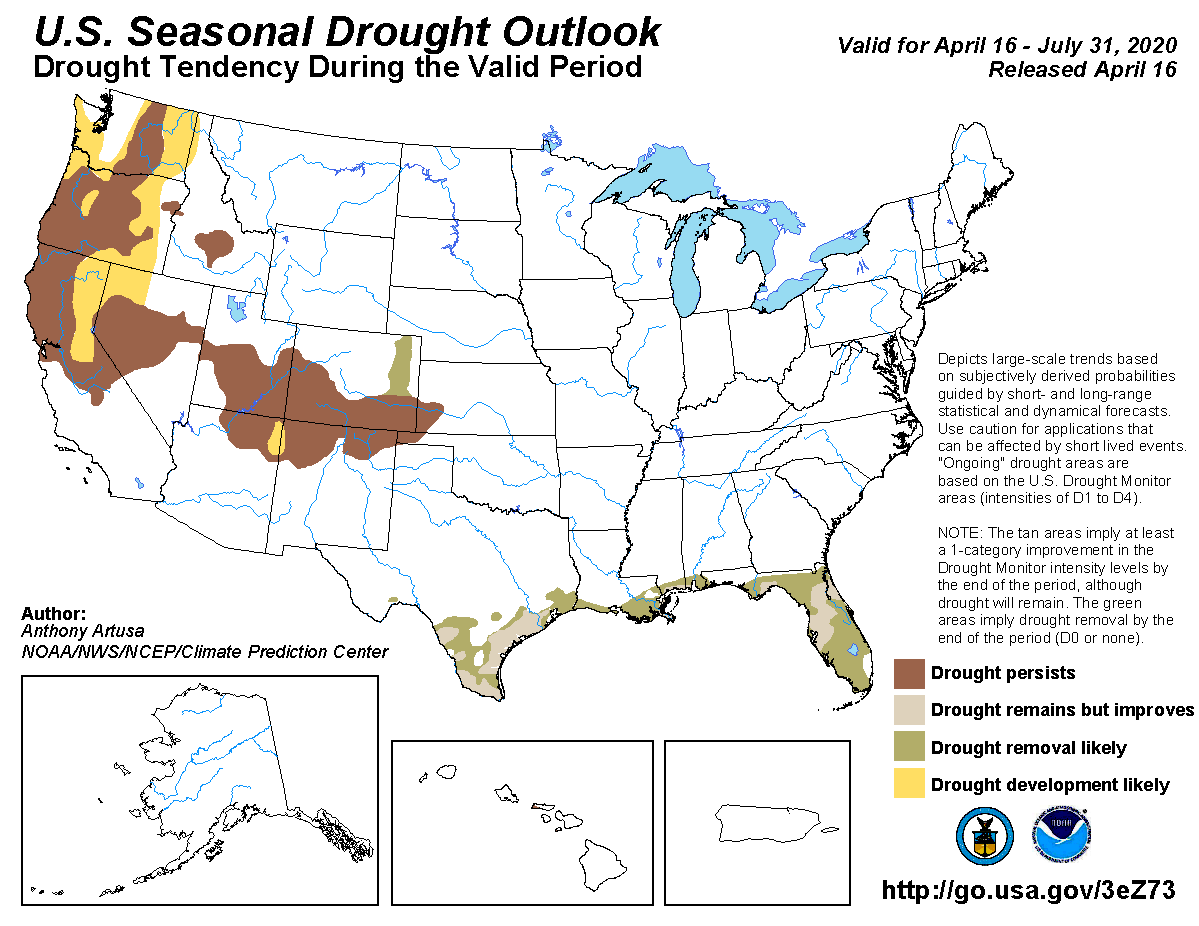
The Seasonal Drought Outlook is somewhat encouraging, as the CPC is expecting improvement throughout Florida between April and July.
–
So what does this mean for farmers and ranchers in the Panhandle?
Based on the CPC forecast, I would expect a warmer than normal growing season again this year. This has been the trend for many consecutive months. The rainfall outlook is also encouraging, but the forecast map shows 40%, so that prediction is not real strong, but that also means there is only a 27% chance of below average rainfall over the next three months. The warmer temperatures mean that farmers can get an early start with planting. Many have already begun taking advantage or the warm soils and current level of soil moisture. So while the rest of the world is focused on the pandemic, at least the weather outlook seems favorable for Panhandle farmers and ranchers through mid-summer.
demayo@ufl.edu - 850-482-9620
Follow me on Twitter
@UFCowman