
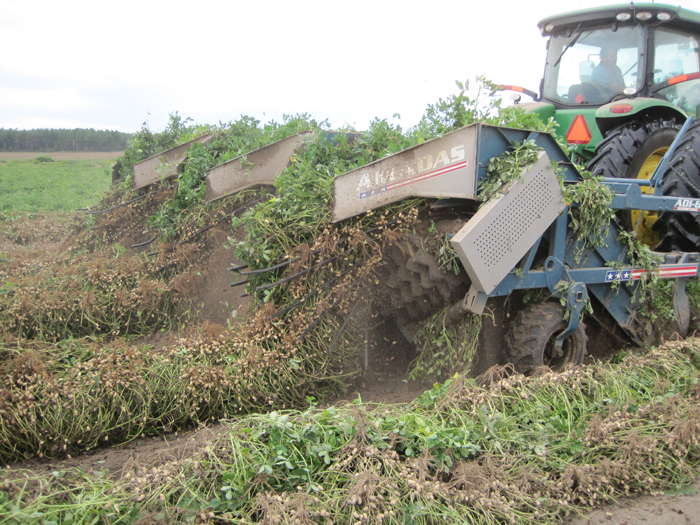
Soil moisture has become a key factor in peanut maturity at the end of September, as days grow shorter. The aGDD Tracker is showing much faster maturity in irrigated vs rain-fed fields. Credit: Doug Mayo, UF/IFAS
As we move through the growing season and watch our fictional fields mature on the Tracker some interesting trends begin to emerge. It has been fairly dry for the past two weeks throughout most of Florida’ peanut producing region, only the Southern end of the region has seen any substantial rainfall. With these dry conditions, relative to earlier in the growing season, we are starting to see a wider spread between irrigated and rain fed fields. As explained in earlier posts, the amount and frequency of the irrigation being supplied to our fictional fields may exceed that of most real-world fields. However, with moisture becoming increasingly limited the impact on speed of maturation will be noticeable even where irrigation is used sparingly. Over the last two weeks the irrigated fields on the Tracker have accumulated an average of 18 aGDDs per calendar day while the rain-fed fields have only averaged 13 aGDDs per calendar day (this number would have been even lower if not for the locations on the Tracker farther south and east which received more rainfall than the Panhandle).
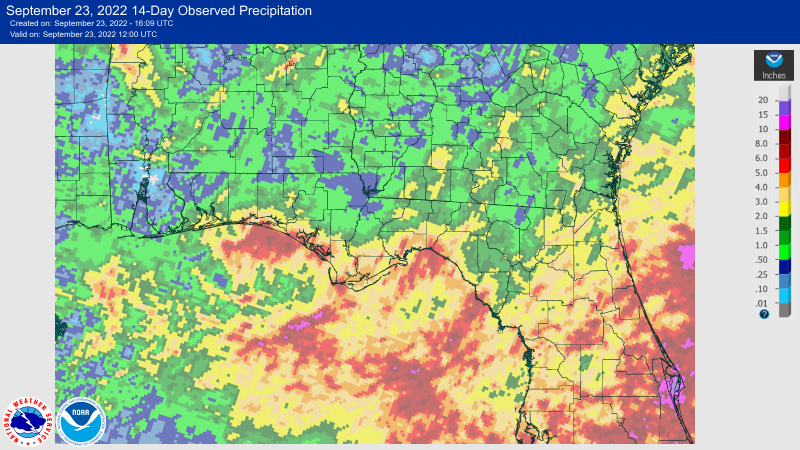
Precipitation accumulation over the past 14 days courtesy of https://water.weather.gov/precip/
It is also worth pointing out that as the days shorten and the nighttime temperatures ease down the overall rate of aGDD accumulation is slowing. For comparison’s sake, back in early August all fields were averaging over 20 aGDDs per calendar day. As always, the best approach is to let the Tracker tell you when your fields should be close to 2300 aGDDs then pull samples and make harvest plans based on the pod-blasting results.
–
aGDD Tracker for the Florida Peanut Producing Region – 9/23/22 edition
The aGDD Tracker is compiled from data generated by PeanutFARM.org. The dark blue bars in the cells with the aGDD values indicates progress towards 2500 aGDDs. The bar extends to the right as aGDDs are accumulated. The entire cell will be dark blue and the text will be orange when a field has accumulated 2500 aGDDs. It is recommended that fields be sampled and exact days-to-harvest be determined via pod-blasting once a field reaches 2300 aGDDs; text will appear yellow for fields that are between 2300 and 2500 aGDDs.
–
If you have fields that are approaching 2300 aGDDs, contact your County Extension Office and make arrangements to have samples analyzed. At this point in the season, with good moisture, fields will accumulate approximately 150 aGDDs each week so plan accordingly – there will be a lot more orange and yellow on the Tracker next week. Remember, that the information generated by the pod-blasting will only be as good as the sample provided. Collect a good representative sample; dig (don’t pull) plants from several locations throughout the field, avoiding field edges and the ends of rows. Below is a link to a document that describes the entire maturity evaluation process in detail.
Methods to Evaluate Peanut Maturity for Optimal Seed Quality and Yield
I understand with the possibility of tropical weather next week the inclination is to “get ‘em out while you can” and I can’t fault that logic. That said, please remember that if in the next few days, it looks like the bad weather will miss your fields harvesting earlier – before 2500 aGDDs, will cost you yield and grade and that the rate at which fields are progressing is slowing.
- Improve Your Pasture Management this Spring - April 19, 2024
- Plant Now for the Panhandle Watermelon Festival Big Melon Contest & New Junior Jubilee Kid’s Contest - March 8, 2024
- Central Panhandle Pesticide Applicator Training Series – February 12-15 - January 19, 2024