
2017 Annual Weather Summary
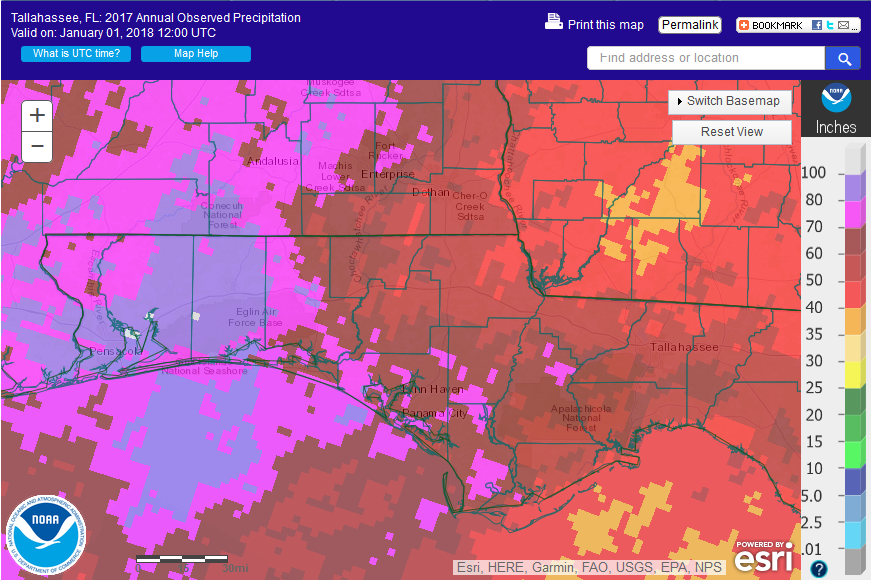
The national weather service provides estimates of annual rainfall. The western counties received considerably more rainfall than those in the eastern portion of the Panhandle.
There was considerable variation in the annual rainfall across the Panhandle in 2017. The graphic above shows National Weather Service’s estimated annual rainfall for the Florida Panhandle Counties. Areas in purple received more than 80″, hot pink 70-80″, dark red 60-70″, red 50-60″, and light red 40-50″.
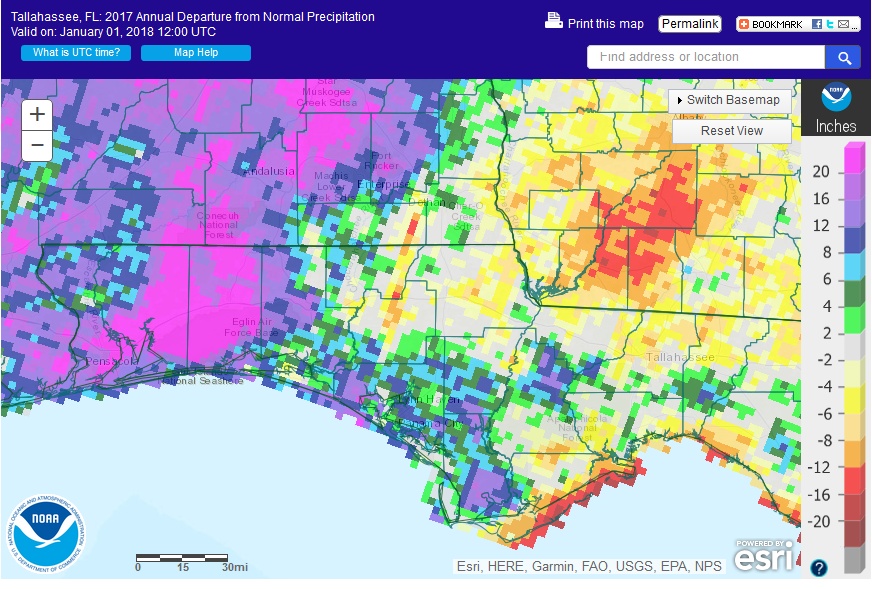
National Weather Service departure from normal rainfall.
The graphic above shows how the area compared to historic average for this region. The areas in green, blue, purple and pink were above average, while, yellow, red and tan were below average.
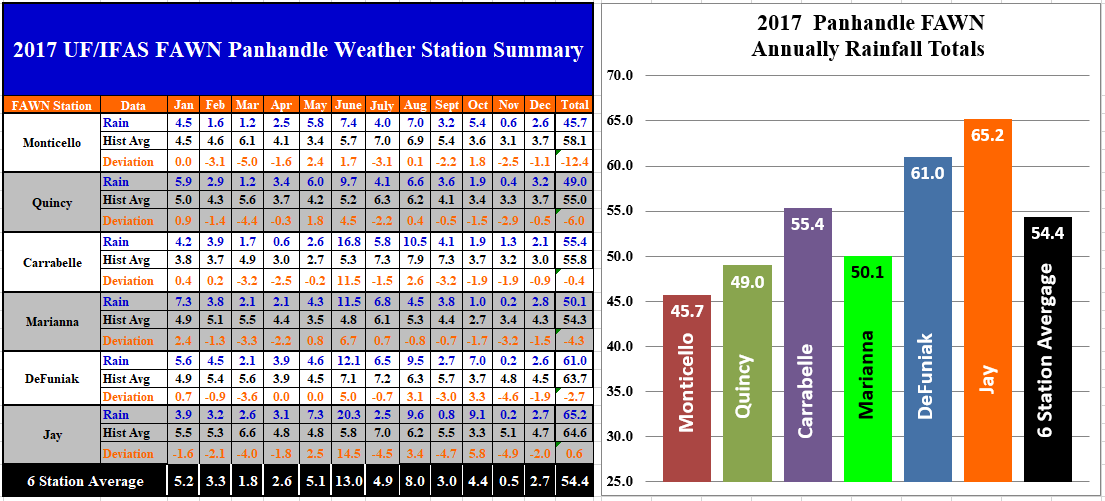
Data summaries from the six UF/IFAS FAWN stations located in the Florida Panhandle.
The University of Florida’s six Florida Automated Weather Network (FAWN) station summaries showed fairly dramatic differences in annual rainfall in 2017. The Monticello station had the lowest annual total with only 45.7″, which was 12.4 inches below historic average for this location. The FAWN station in Jay recorded 65.2″ for the year, and was the only one that was above average for the year. The average for all six stations was 54.4″.
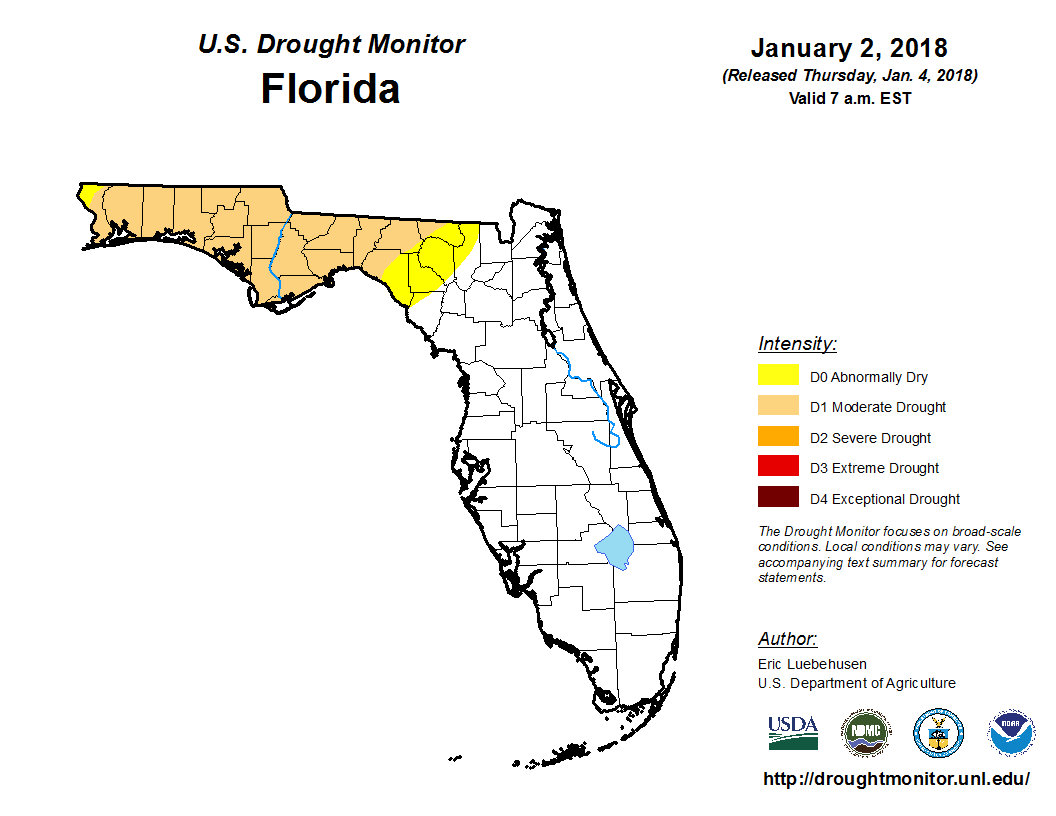 At year’s end, the vast majority of the Panhandle was in the moderate drought category in the U.S. Drought Monitor. The foretasted La Niña did make a significant impact with reduced rainfall in the region through the final quarter of the year.
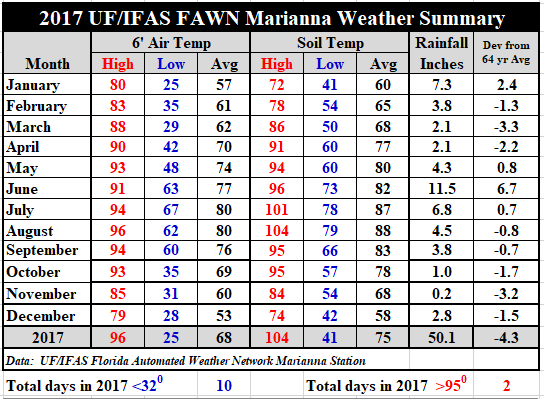 Temperatures were fairly mild in 2017. There were only 10 days with lows at or below 32°, and only two days at or above 95°. The low of 25 came on January 8th and 9th, and the high of 96 on August 20th and 25th. For a complete summary of the 2017 weather download: 2017 Jackson Co Weather Summary, which includes daily temperatures and rainfall summaries at the Marianna FAWN Station, and monthly rainfall totals for all six FAWN stations located in the Panhandle.
La Niña Watch
The CPC issued their most recent report on the status of the current ENSO phase La Niña on December 14.
La Niña strengthened in December, as indicated by an increasingly prominent pattern of below-average sea surface temperatures across the central and eastern equatorial Pacific Ocean. La Niña is predicted to persist through the Northern Hemisphere winter 2017-18. Based on the latest observations and forecast guidance, forecasters favor the peak of a weak-to-moderate La Niña during the winter. In summary, La Niña is likely (exceeding ~80%) through the Northern Hemisphere winter 2017-18, with a transition to ENSO-neutral most likely during the mid-to-late spring. La Niña is anticipated to affect temperature and precipitation across the United States during the upcoming months.
First Quarter Outlook
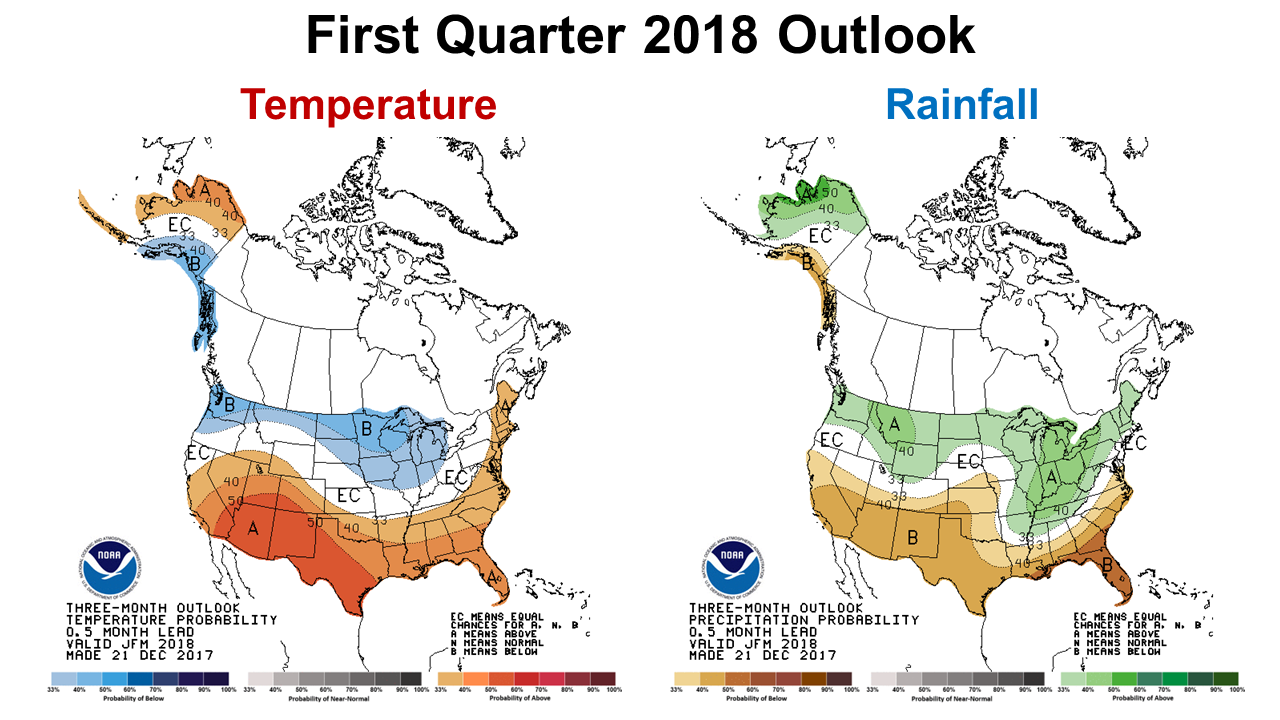 Despite the cold start to 2018, the Climate Prediction Center (CPC) does not expect this trend to continue. Their forecast calls for much warmer than normal temperatures through March. The CPC is also expecting the drought conditions to continue.
Looking ahead to winter, the current phase of the El Nino Southern Oscillation (ENSO) cycle across the eastern Pacific is a weak La Nina, and it is expected to persist through the winter and possibly extend into the spring of 2018. The impact of La Nina on the southeast U.S. is for drier and warmer than normal conditions during the winter season. The latest Climate Prediction Center’s outlook for this winter calls for an enhanced chance of experiencing above normal temperatures and below normal rainfall for the Tallahassee area. Tim Barry, National Weather Service Tallahassee
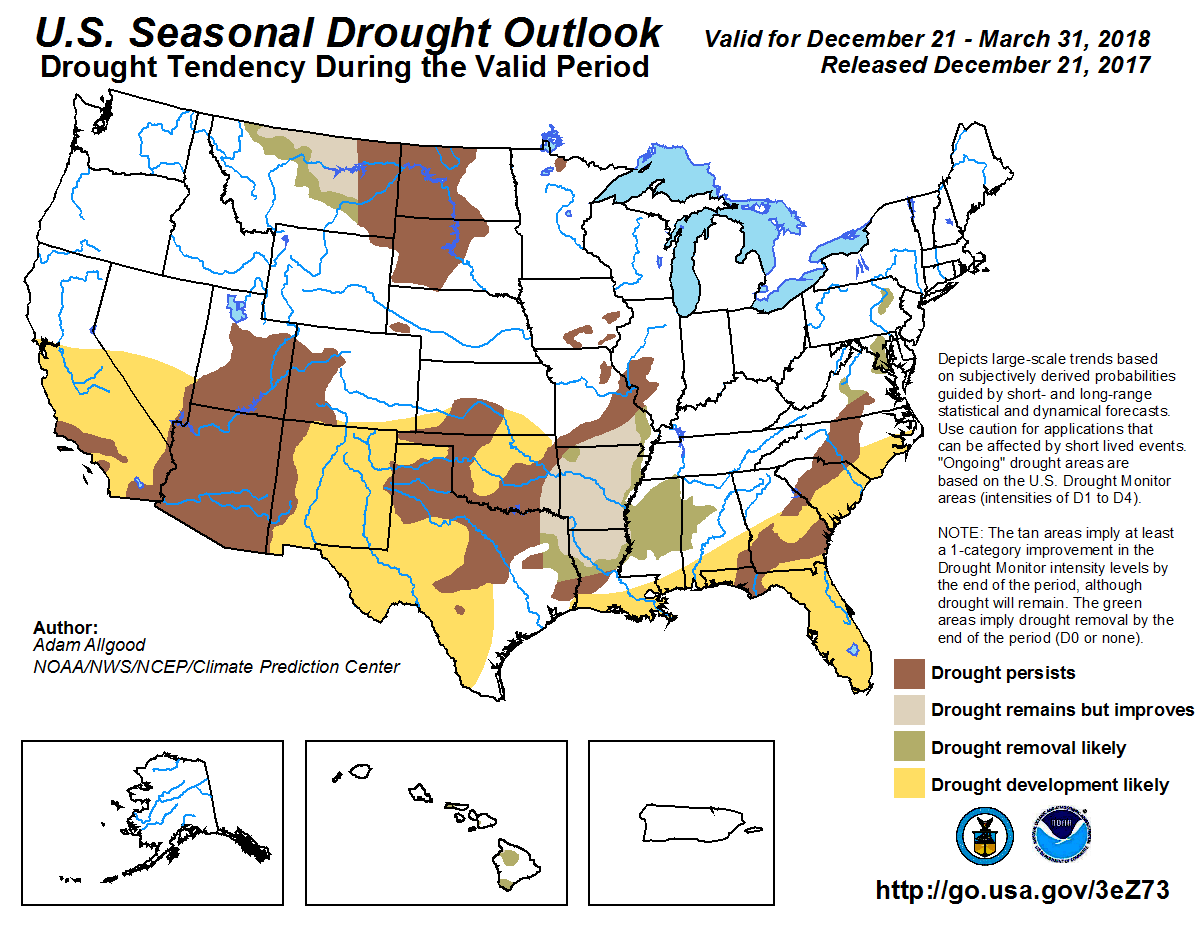 The CPC Seasonal Drought Outlook also shows they do not expect improvement in drought conditions through the end of March. Based on their long-term forecast this may have real impact on vegetable, corn, and grass planting in the late spring. Let’s just hope that the Pacific warms up sooner than expected, so the La Niña will fade to neutral again before planting season begins.

demayo@ufl.edu - 850-482-9620
Follow me on Twitter
@UFCowman
- May 2025 Weather Summary and Summer Outlook - June 20, 2025
- Friday Feature:The History of Angus Cattle - June 20, 2025
- Friday Feature:High Quality Legume Hay Production – Virtual Tour of Conrad Farms - June 6, 2025