
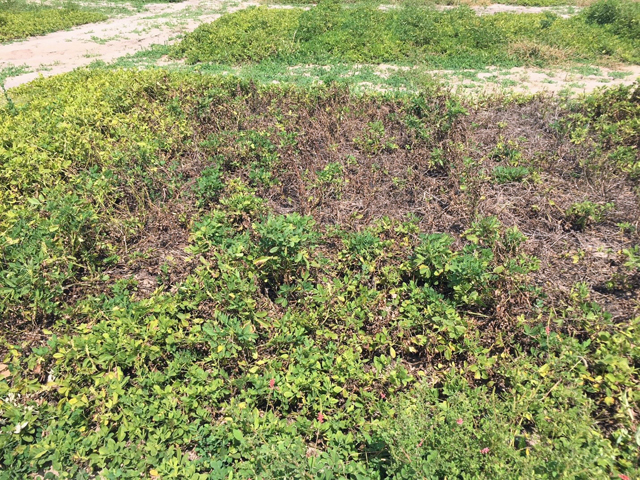
Figure 1: Research plots in 2017 affected by peanut collapse. Photo by B. Tillman
Shannon McAmis, De Broughton, Nick Dufault, Ian Small, Zane Grabau, Barry Tillman, and Diane Rowland, UF/IFAS Extension
In 2017, peanut growers of the Panhandle and North Central regions in Florida, and many areas in Georgia faced a number of issues. In addition to high disease, insect pests, nematodes, and Hurricane Irma’s aftermath, growers were faced with a new problem: peanut collapse or decline. University scientists hypothesized that abnormal weather patterns, including low solar radiation and decreased night-time temperatures during an important part of plant development, may have contributed to the collapse. Late in the season, growers noticed yellowing or necrosis of leaf margins, premature defoliation, plant stunting and weak pegs, all adding up to digging losses and reduced yield. This phenomenon was named peanut collapse or peanut decline by many growers and researchers (Figure 1: Peanut collapse). An estimated 25,000 acres fell victim to peanut collapse and experienced yield reduction of more than 1,000 pounds per acre. (retrieved from: Peanut Season has Begun in North Florida). UF/IFAS Extension Agents and researchers teamed up with University of Georgia and regional producers and scrambled to find the cause, but no main culprit was found.
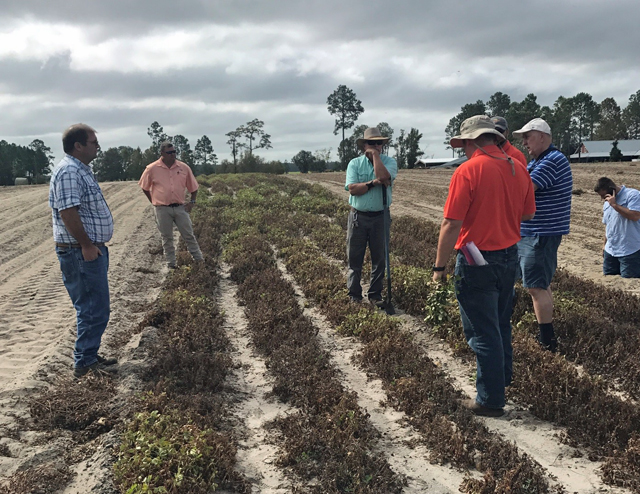
Figure 2: A region-wide tour of peanut collapse took place with researchers, extension agents, and producers present.
In 2018, a team of Extension Agents and scientists are hoping to uncover more of this mystery and begin to gather the data needed to predict problems for harvest this year and into future years. They are using the help of a mobile app combined with drone flights. Researchers are using FieldX, an iOS app that is available through FieldX, Inc. that allows users to map field borders and upload geolocated pictures and notes conveniently on one platform.
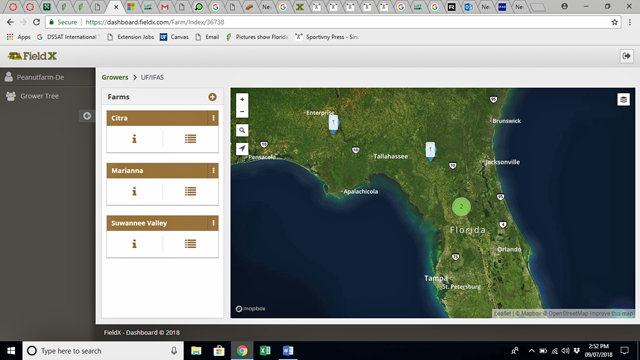
Figure 3: Screenshot of the desktop app FieldX Dashboard.
FieldX is able to map and display multiple farms and fields at one time while individually tracking the geolocation of pictures and notes taken in the field. The app can track the exact path taken while scouting the field as well as record the specific location where pictures or soil and plant samples are taken.
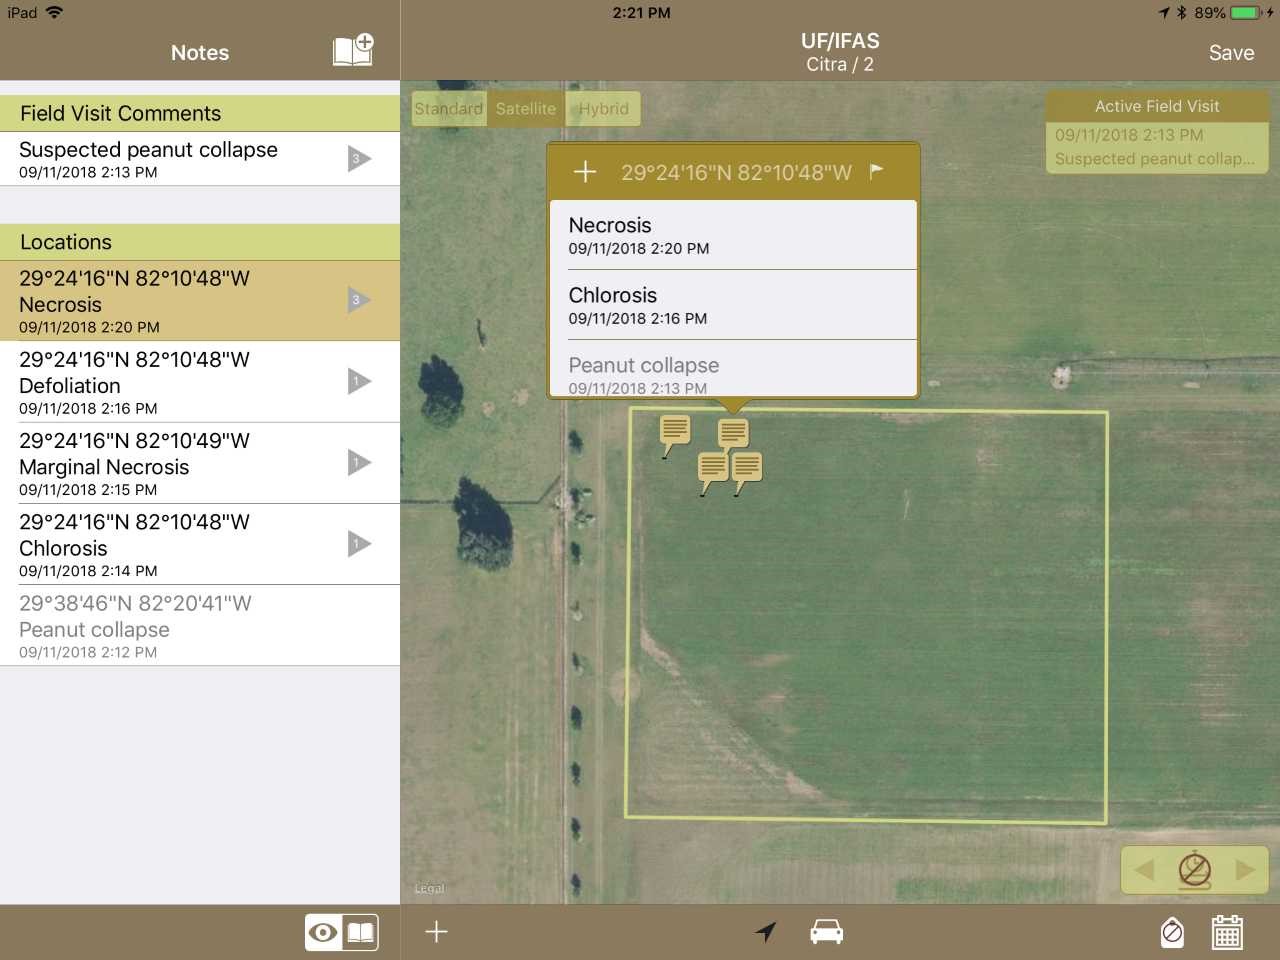
Figure 4: Screenshot of the mobile app FieldX GeoNotes.
The FieldX app will allow for any incident of peanut collapse to be mapped, photographed, and described all on one convenient platform that can be shared with other users. This will help the team visualize the effect of peanut collapse for the entire region, and allow researchers to collect data about what happened when and where.
Recording the occurrence and progression of peanut collapse (and other diseases) will allow researchers to begin tracking symptom progression and begin to formulate models to assess risk in the future. Researchers will also combine drone or Unmanned Aerial Systems (UAS) images from identified fields to help develop early warning signals for the possible onset of collapse. Although the main focus of this work is to better understand peanut collapse, this technology can also be used to record and document other issues that may come up in the field, to better identify and predict risks to peanut production in the future.
The Peanut Decline Research Team encourages growers to report appearance of possible decline. If you suspect peanut decline may be an issue in one or more of your fields, contact your local county agent or De Broughton, Suwannee County Extension, who is coordinating this effort in Florida.
- Rapid Response Team Deployed to Investigate Peanut Collapse - September 21, 2018
- Developing a “Stress Breathalyzer” for Peanuts - April 13, 2018
- Peanut Nodule Analysis to Assess Crop Health - August 18, 2017