
 Rainfall
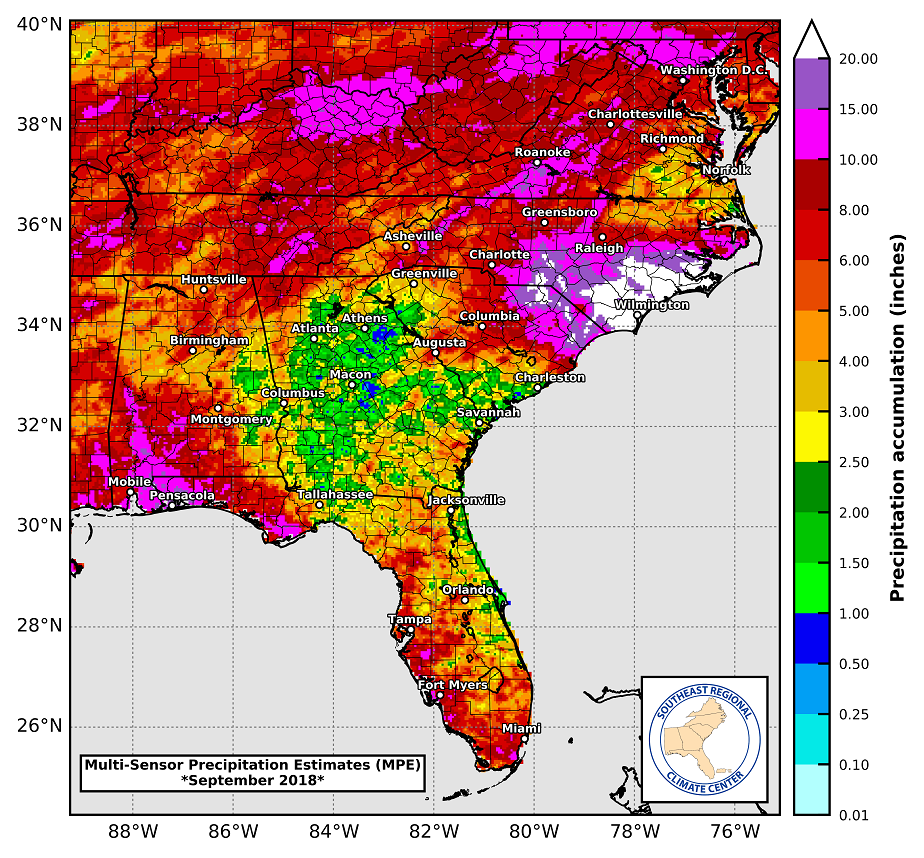
September 2018 was a very unique month. Tropical Storm Gordon dumped significant rainfall in Franklin, Gulf, Okaloosa, Santa Rosa, and Escambia Counties in the Florida Panhandle and Southwestern Alabama. As bad as that was, it did not compare to severe flooding in the Carolinas from Hurricane Florence. Wilmington, North Carolina received 24″ or two feet of rain in the month of September. Yet the areas between these two storm paths were drier than normal.

Closer to home, the National Weather Service map above shows clearly the path of Tropical Storm Gordon. The areas shaded in pink, purple, and white received 10″+ for the month. The Panhandle counties east of the Apalachicola River had much lower rainfall totals, with < 5″ in September.
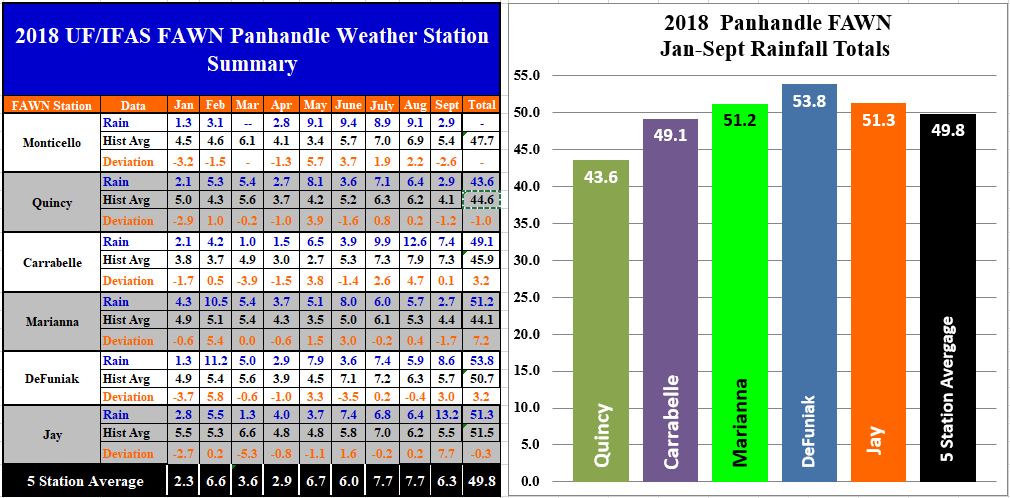
The Florida Automated Weather Network (FAWN) stations located in the rural areas of the Panhandle documented the variation across the region in September. The wettest location was at Jay where 13.2″ were recorded in September. Only 2.7″ was recorded at the station near Marianna. The Marianna, Quincy and Monticello stations recorded below historic average for September, because the tropical storm had little impact on these locations. Through the first 3/4 of the year, the DeFuniak station has received the highest total rainfall with 54″, with the lowest total of 44″ in Quincy. The average for all five stations through September was 50″, which is 2.4″ above average.
Temperatures
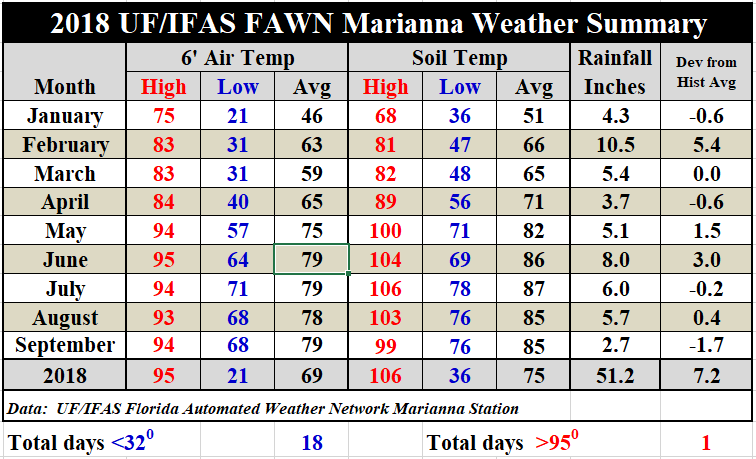
The dog days of summer were worse in September than August. The average 6′ air temperature was 1° warmer than August.
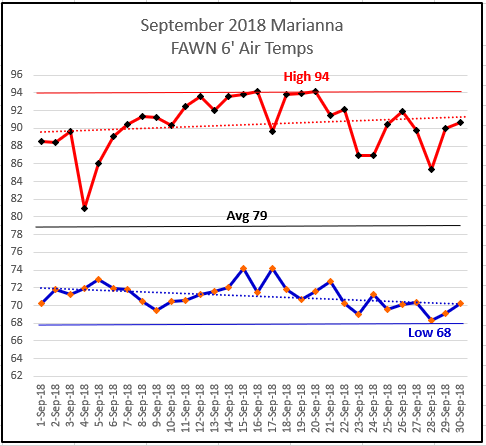 As you can see from the chart above the morning lows did begin to cool off slightly at the end of September, down to a low of 68° on September 28. There were seven days in September with highs reaching 94°(September 12, 14,15,16, 18, 19, & 20). The daytime highs were clearly influenced as Hurricane Florence sucked up moisture like a vacuum. To see the complete daily weather data from the Marianna FAWN station, use the following link: 2018 Jan-Sept Weather Summary.
October Outlook
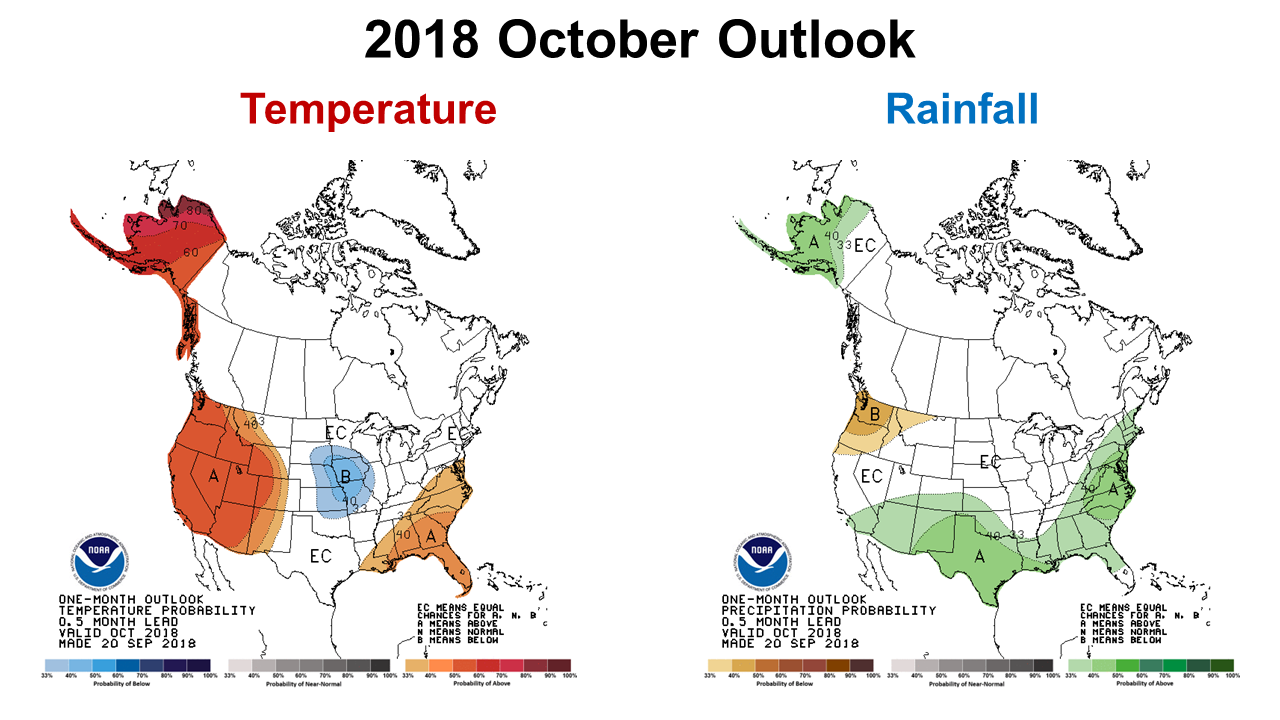 The Climate Prediction Center (CDC) forecast for October calls for well above average temperatures to continue, along with above average rainfall. As peanut and cotton harvest are in full swing, the warm temperatures should continue to dry out the soil. October is the driest month of the year, normally, so above average rainfall may not be a serious issue for crop harvest, except perhaps in the Western Panhandle counties were soils are already saturated.
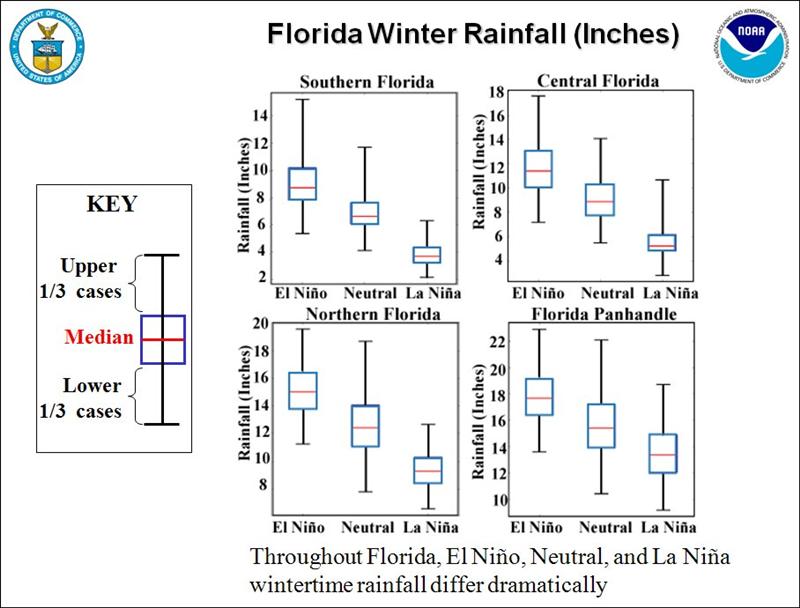
El Niño Watch
The CDC has increased the chances of an El Niño this winter.
 —
—
demayo@ufl.edu - 850-482-9620
Follow me on Twitter
@UFCowman
- Making the Most of High Cattle Prices – Grow More of Your Own Feed - July 18, 2025
- Friday Feature:1960 Corn Farmer - July 18, 2025
- June 2025 Weather Summary and Three-Month Outlook - July 11, 2025