
Many folks in the Panhandle were more than happy to take down their 2018 calendar to start a new year. The weather in 2018 is the main reason for the renewed optimism provided by a new year. There were really two elements that stood out as to what made 2018 a weather year folks here will never forget, terrible wind and rain, rain, and more rain. At least the temperatures were more typical.
Wind
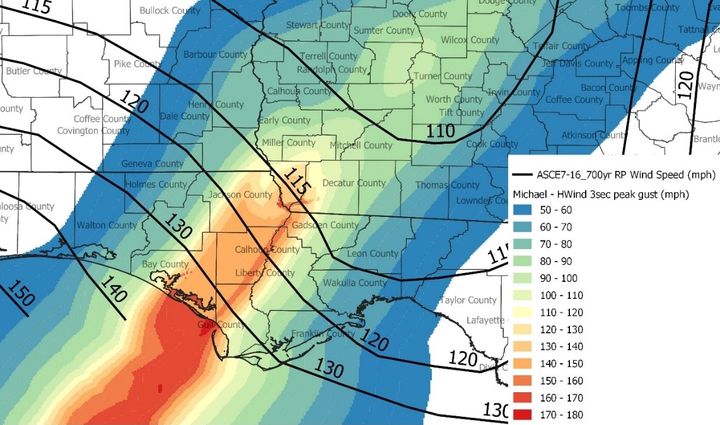
Source: RMS (Risk Management Solutions)
Quite a few people have inquired about the actual wind speeds of Hurricane Michael. The National Weather Service has still not issued a final report on this storm. With the 155 mph reported wind speed at landfall, there has been a good deal of debate about if this was really a Category 5 hurricane (157+ mph). There is a company that does storm assessment and modeling to help the insurance industry asses damages called RMS or Risk Management Solutions. A team of RMS engineers visited the impact zone and issued a report on what they saw: Hurricane Michael Field Reconnaissance: Contrasting Performance of Structures at Design Wind Speeds. The graphic above came from that report. The lines are the building design contours and the shaded colored zones were their estimates of wind speeds based on their observations. From their report, RMS engineers showed that areas of Bay, Gulf, Calhoun, Liberty, Jackson, and Gadsden Counties received 130-150 mph winds, with the worst winds along the Apalachicola River. Just for your reference an F2 Tornado has winds ranging from 113-157 mph, so you may as well say a giant F2 Tornado raged through the center of the Panhandle on October 10, 2018.
The anemometers at the airports and UF/IFAS FAWN Stations were not built to measure winds of this magnitude, so there really is no absolute scientific data, but simply assessments of structure and tree damage. So was Michael a Category 5? What hit us was terrible, so I am not really sure it matters, but I guess for history’s sake those hit by this storm would like it to be remembered as a Cat 5. The main thing was that Michael was a devastating hurricane that created an estimated $1.5 billion in ag industry losses, with the bulk of those losses attributed to the timber industry.
Rain
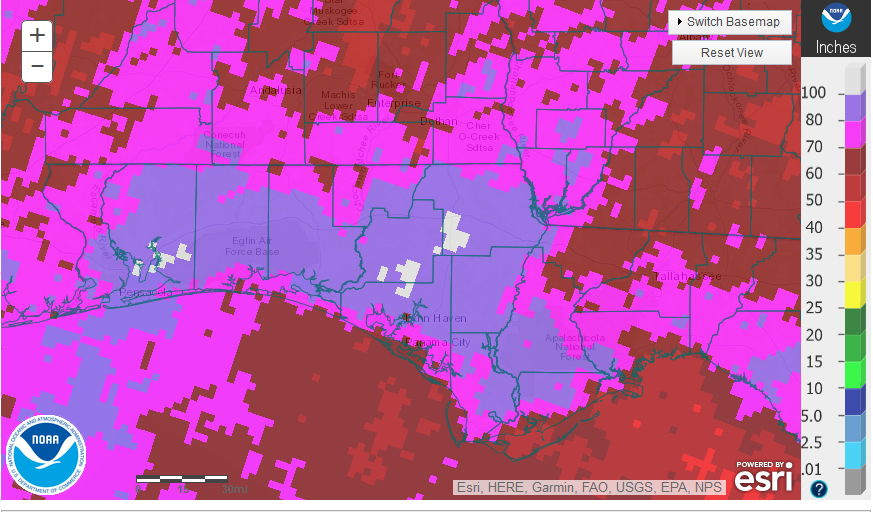
2018 was also a very wet year. The graphic above is the National Weather Service’s estimates for annual rainfall for the Florida Panhandle in 2018. There were isolated areas that received more than 100″ last year (white), large areas of more than 80″ (lavender), areas with more than 70″ (hot pink), and some areas with more than 60″ (dark red). So how did this compare with normal?
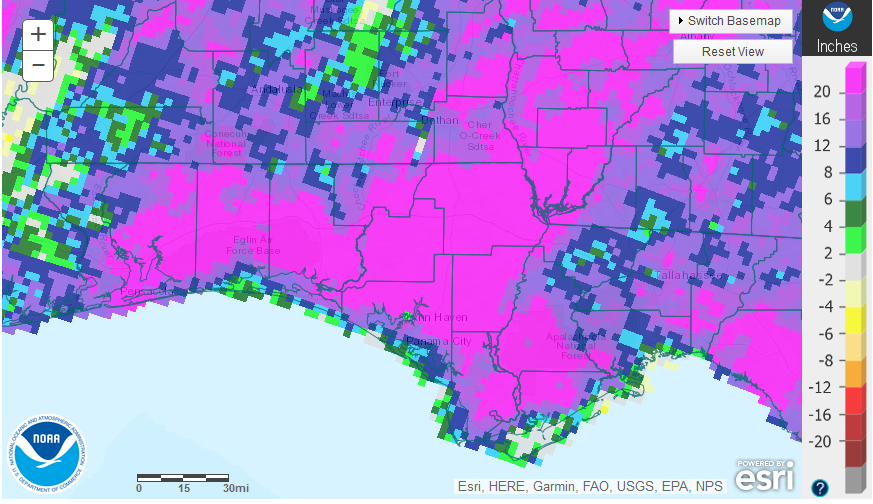
Almost the entire region was well above normal. The map above shows how far above average the area was in 2018, with the majority of the region 16 to 20 inches or more above average. Needless to say, but 2018 was a very wet year.
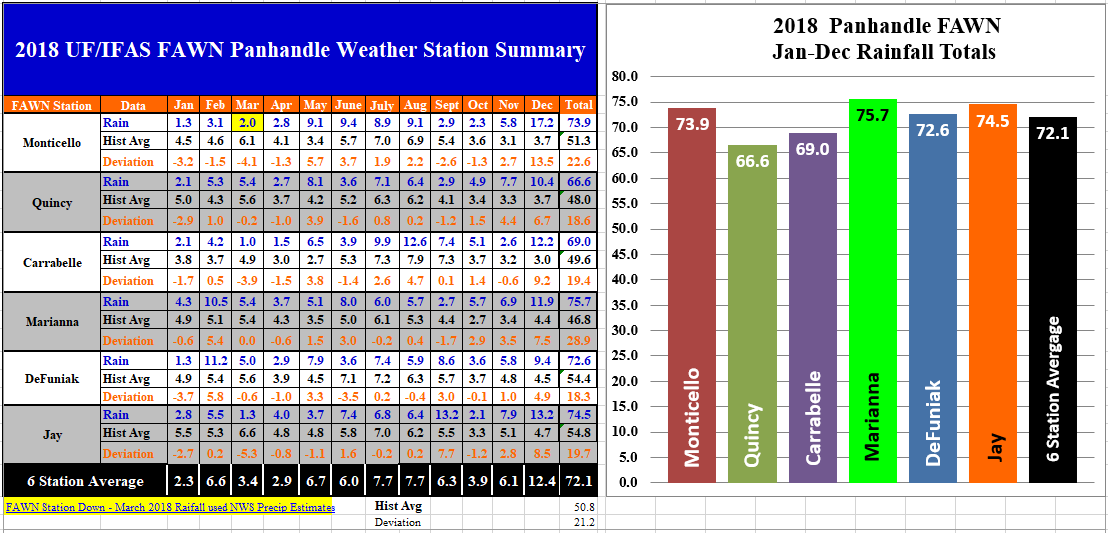
The Florida Automated Weather network (FAWN) stations documented the rainfall totals across the region. The average for all six stations was 21.2″ above historic average for these locations.The wettest site was in Marianna with 75.7″, which was almost 29″ above average. Not since the 80.6″ fell in 1964 (54 years) had this much rain been recorded in that location. Much of the rain in October came from the hurricane. The automated rain gauges at these FAWN stations don’t do so well measuring rain blowing sideways, so the October total may actually be higher than what was reported. The station in Jay received rain from two tropical storms and totaled 75.7″ for the year. Because the FAWN station in Monticello was out of commission in March, we don’t have accurate data for that month, but there was at least 74″ at that location. The driest location was 66.6″ in Quincy, which was still 18.6″ above average.
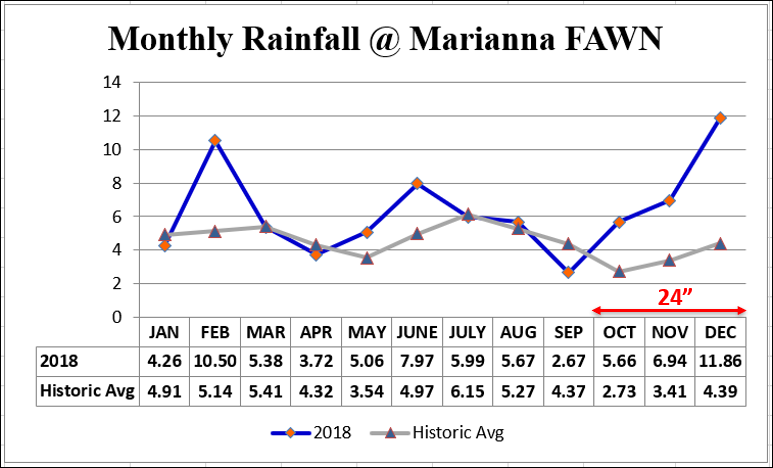
Much of the rainfall came at the end of the year. There were 24″ (almost 1/3 of the total) that fell in the last quarter of the year, right when farmers were trying to harvest cotton and later planted peanuts. What had promised to be an excellent crop year at the end of the summer was ruined by high winds and boggy wet fields at harvest time.
Temperatures
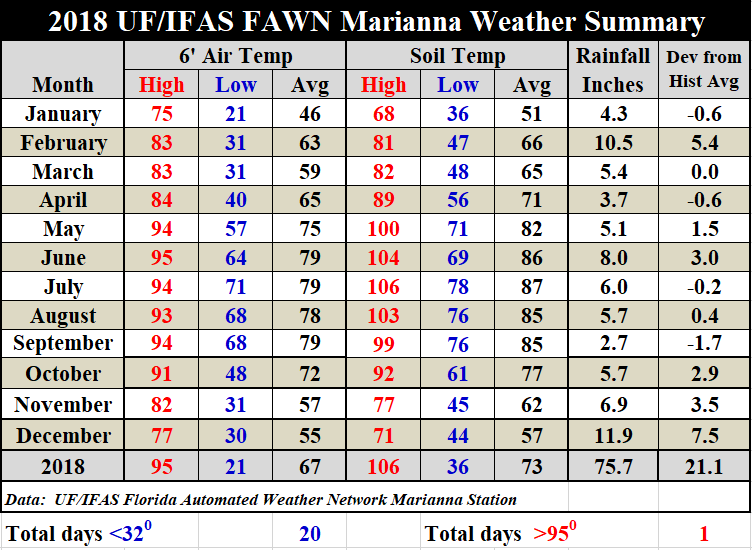
There were not a lot of extreme temperatures in 2018. There were only 20 days below freezing, primarily in January. There was only one day in June above 95°. The simple average temperature for the year was 67°. In general, temperature wise it was a fairly normal year.
1st Quarter Outlook
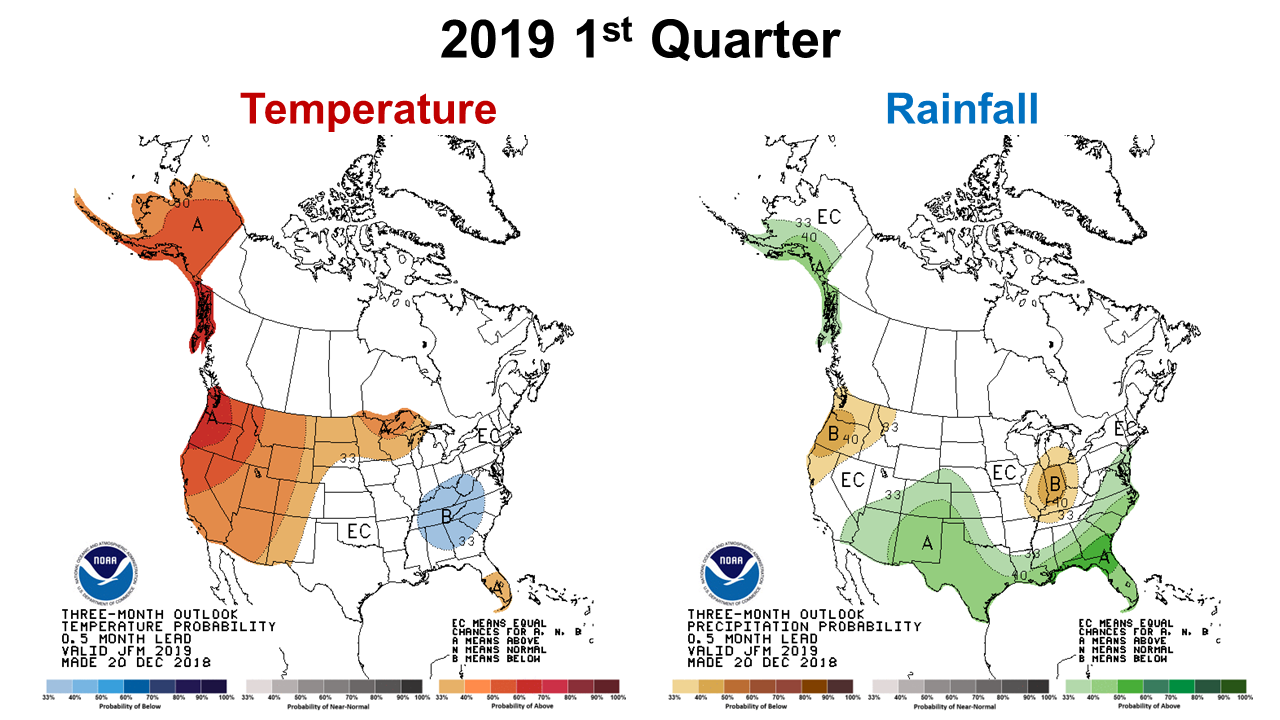
The Climate Prediction Center (CPC) is forecasting the above average rainfall to continue in North Florida over the the first three months of 2019. Temperatures are expected to be near to average for these months. This forecast goes along with the expectation of a weak El Niño ENSO Phase.
El Niño Watch
The CPC is still expecting the onset of an El Niño, but not necessarily the major global impacts of previous strong El Niño periods. The Seas Surface Temperatures (SST) are warmer than average, but the wind patterns don’t match those associated with strong El Niño ENSO phases.
El Niño-level SSTs continued to be observed in the December average, and the subsurface waters continued to be warmer than average. However, most atmospheric variables continued to show ENSO-neutral patterns. The official CPC/IRI outlook calls for a 82% chance of El Niño prevailing during Jan-Mar, and 66% during Mar-May. An El Niño watch is in effect. The most recent forecasts of statistical and dynamical models collectively show continuing weak El Niño-level SSTs through late spring. Climate Prediction Center
So what does this mean for farmers and ranchers in 2019? The above average rainfall is foretasted to continue, but will not necessarily have a major affect on the summer crop season in 2019. The greatest affect may well be for the early planted vegetable crops and field corn. Hopefully the average temperature forecast will mean that colder temperatures will come soon that are important for reducing pest populations. At this point we don’t have enough information to know what to expect at peanut and cotton planting time, but there may be good subsoil moisture to plant into. Perhaps 2019 will be a more average year than 2018, but as the climate is continuously changing, it is hard to know what average is anymore. Let’s hope we do have a good weather year in 2019, because it has been some time since area farmers had a good weather from planting to harvest.

demayo@ufl.edu - 850-482-9620
Follow me on Twitter
@UFCowman
- May 2025 Weather Summary and Summer Outlook - June 20, 2025
- Friday Feature:The History of Angus Cattle - June 20, 2025
- Friday Feature:High Quality Legume Hay Production – Virtual Tour of Conrad Farms - June 6, 2025