
Late last year and through early 2020, University of Florida faculty involved with peanut related research and extension efforts met to form the Florida Peanut Team. Among the goals of the team are to provide research-based solutions to peanut farmers and to provide hands-on training for county extension faculty as they work with Florida peanut farmers. COVID-19 has caused cancellation of the in-person training and field day events that were planned, but the team has developed a website with an assembly of great peanut production information from planting through harvest.
–
Florida Peanut Team Website
One new and unique tool is the Peanut Rx Analysis Calculator. The calculator is the first link on the web page and linked directly here: https://peanutrx.org/. Based on the Peanut Rx, this tool provides a quick and easy way to determine how various production practices can impact the risk of disease in peanut. As the production practices are changed, the risk points are calculated in real time (best viewed on an ipad/tablet or full computer screen). This calculator can help to visualize the “big picture” of how the various production risk factors interact and affect the risk of three major peanut diseases. It can be used as a planning tool for the coming season and it can also help to determine the risk of disease for the current season.
The scenario shown in Figure 1 is an example of a current-season application. Example Scenario:
- Variety: Georgia-06G
- Planting Date: May 1-10
- Plant Population: 3-4 plants/foot
- At-plant Insecticide: Thimet
- Row Pattern: Twin Rows
- Tillage: Conventional
- Classic® Herbicide: No
- Disease a Problem: Yes (because it almost always is)
- Irrigation: Yes
This scenario would give a low spotted wilt risk at 60, high leaf spot risk at 65, and high white mold risk at 55. Taking into account the weather any given farm is experiencing; this would indicate that the leaf spot and white mold fungicide program are very important for the scenario in Figure 1.
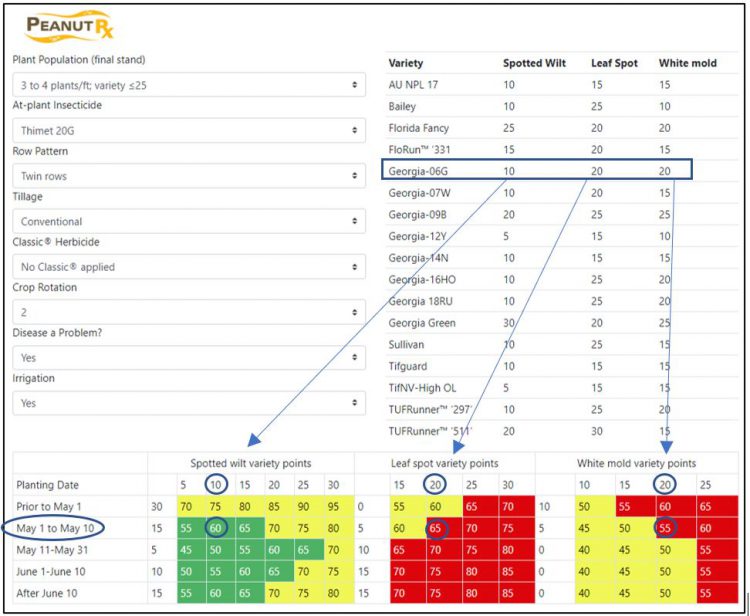
Figure 1. An example of the Peanut Rx Analysis Calculator found at https://peanutrx.org/. For example, using the variety Georgia-06G, planted between May 1 and 10, the spotted wilt risk is low at 60, leaf spot risk is high at 65, and white mold risk is high at 55. Green= high risk, yellow=moderate risk, and red=high risk.
–
Farmers can calculate the risk of disease in their peanut crop similarly. Entering the field parameters you would like to evaluate (Plant population, At-Plant Insecticide, Row Pattern, Tillage, Classic® Herbicide, Disease a Problem, and Irrigation) will change the risk points shown on the tables at the bottom of the page. After the parameters are entered, use the appropriate variety and planting date points to find the field’s risk rating for spotted wilt, leaf spot, and white mold. The risk rating is found where the variety points column and the planting date row intersect.
- FloRun™ ‘725’ – A New High Yielding, Disease Resistant Peanut Variety - April 4, 2025
- Don’t Lean Too Hard on Your Peanut Variety for Disease Resistance - June 28, 2024
- ‘Arnie’ – A New Peanut Variety Released by the University of Florida - February 2, 2024