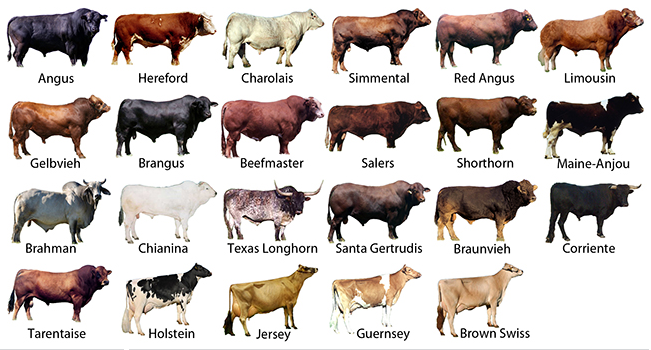
Twenty three of the 46 cattle breeds that are annually evaluated for performance at the U.S. Meat Animal Research Center. Source: US MARC.
Bull buying is a challenging craft. First you have to decide the breed or breeds of cattle you want for your operation, then you have to compare performance of locally available sources, and then negotiate prices. In times like these, when cattle prices are not as strong, you may also want to compare similar breeds to find the best deals. For example you might want to compare both Charolais and Simmental, or Angus versus Red Angus, or Brangus vs. Beefmaster. The problem is that the EPDs (Expected Progeny Differences) for these breeds are only helpful within their single breed. Plus breed associations do not reset their EPD averages to 0 each year, so the numbers don’t compare evenly. To help with this, an across-breed EPD table was created.
USDA’s Meat Animal Research Center (MARC) recently revised their Across-Breed EPD Table (AB-EPD) and performance comparison chart for 18 of the 46 breeds of cattle they evaluate at the station. This is a very useful tool to compare the EPD of bulls from different breeds.
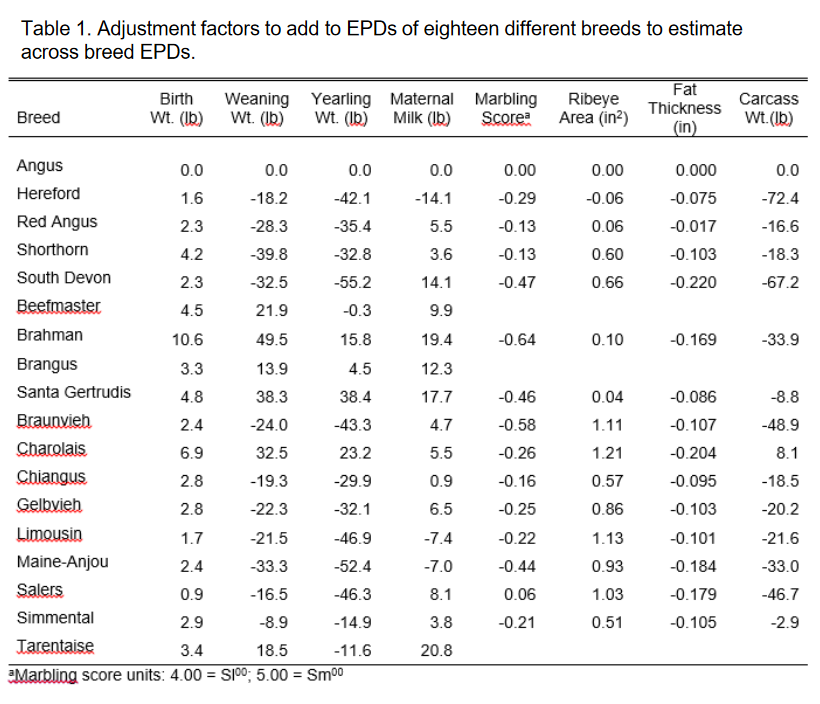
Bulls of different breeds can be compared on the same EPD scale by adding the appropriate adjustment factor to the EPDs produced in the most recent genetic evaluations for each of the eighteen breeds. Normally, the EPDs of animals from different breeds cannot be compared because most breed associations compute their EPDs in separate analyses and each breed has a different base point. The across-breed adjustment factors allow producers to compare the EPDs for animals from different breeds for these traits; these factors reflect both the current breed difference and differences in the breed base point. Larry Kuehn and Mark Thallman, U.S. Meat Animal Research Center
The chart above should only be used as factors for comparisons of EPDs.
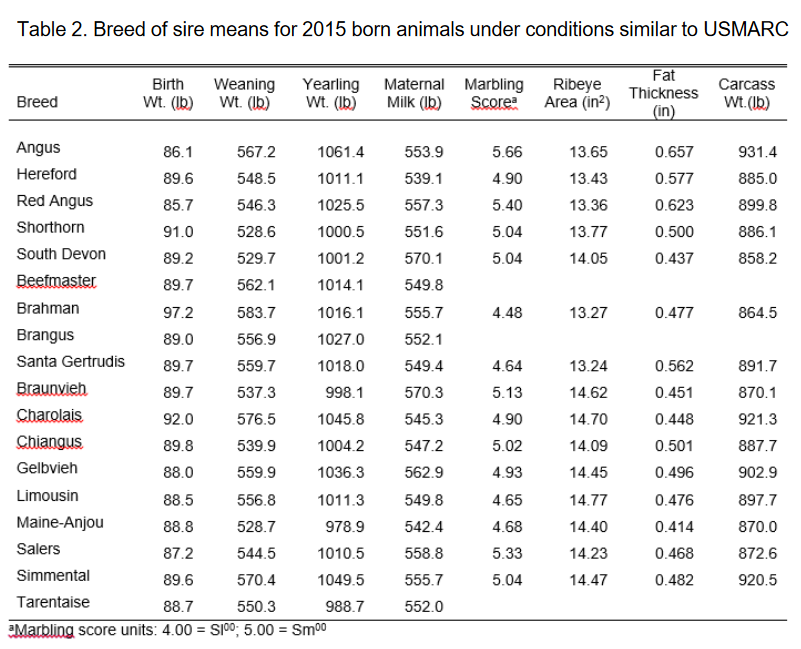
It is important to note that the table factors (Table 1) do not represent a direct comparison among the different breeds because of base differences between the breeds. They should only be used to compare the EPDs (AB-EPDs) of animals in different breeds. To reduce confusion, breed of sire means (i.e. one half of full breed effect; breed of sire means predict differences when bulls from two different breeds are mated to cows of a third, unrelated breed) for animals born in 2015 under conditions similar to USMARC are presented in Table 2. Kuehn & Thallman, U.S. Meat Animal Research Center
The factors in the chart compare all other breeds to to those of Angus. Angus is 0 in this chart for all traits, because they are using Angus as the comparison breed. EPDs from other breeds can be compared using the factor supplied in the chart. The Angus non-parent average weaning weight (WW) EPD for bulls is +50, and the average WW for Red Angus is +58, but these are not comparable. To generate an all breed EPD you would subtract 28.3. So a Red Angus bull with the breed average WW of +58 would actually be and across-breed or AB-EPD of 29.7 for comparison (58-28.3= 29.7). So then to find a comparable Red Angus bull, to the breed average Angus (+50), you would need to have a bull with a WW EPD of 78.3 in the Red Angus Breed. (78.3-28.3=AB-EPD 50).
If all of this math makes your head hurt, you may want to simply compare the average traits of breeds, to decide which breeds might best fit your ranch’s goals. The MARC center also created Table 2 below, that shows the average difference in performance of different breeds bred to unrelated breeds in a crossbreeding system. Once you select comparable breeds, you can try to find the best bulls of each breed available to compare prices. Once you have narrowed your search down to a specific bull, you can go back and use the factors in Table 1. to see how that bull compares to other breeds.
It is important to note that the table factors (Table 1) do not represent a direct comparison among the different breeds, because of base differences between the breeds. They should only be used to compare the EPDs (AB-EPDs) of animals in different breeds. To reduce confusion, breed of sire means (i.e. one half of full breed effect; breed of sire means predict differences when bulls from two different breeds are mated to cows of a third, unrelated breed) for animals born in 2015 under conditions similar to USMARC are presented in Table 2. Kuehn & Thallman, U.S. Meat Animal Research Center
With the Florida Bull Test Sale coming up next week, the ability to compare bulls of different breeds is helpful. For more details on how to utilize the data in these tables, use the links below to read the full eXtension fact sheet. To read the USDA fact-sheet, select either the online (html) or printable (PDF) version below:
2017 Across-Breed EPD Table & Improvements (html version)
2017 Across-Breed EPD Table & Improvements (PDF version)
- Ranch Record Keeping for Annual Analysis & Innovation - January 23, 2026
- Friday Feature: 2026 Farm Dog of the Year - January 23, 2026
- 2025 Weather Summary and 2026 1st Quarter Outlook - January 16, 2026


