
Rainfall
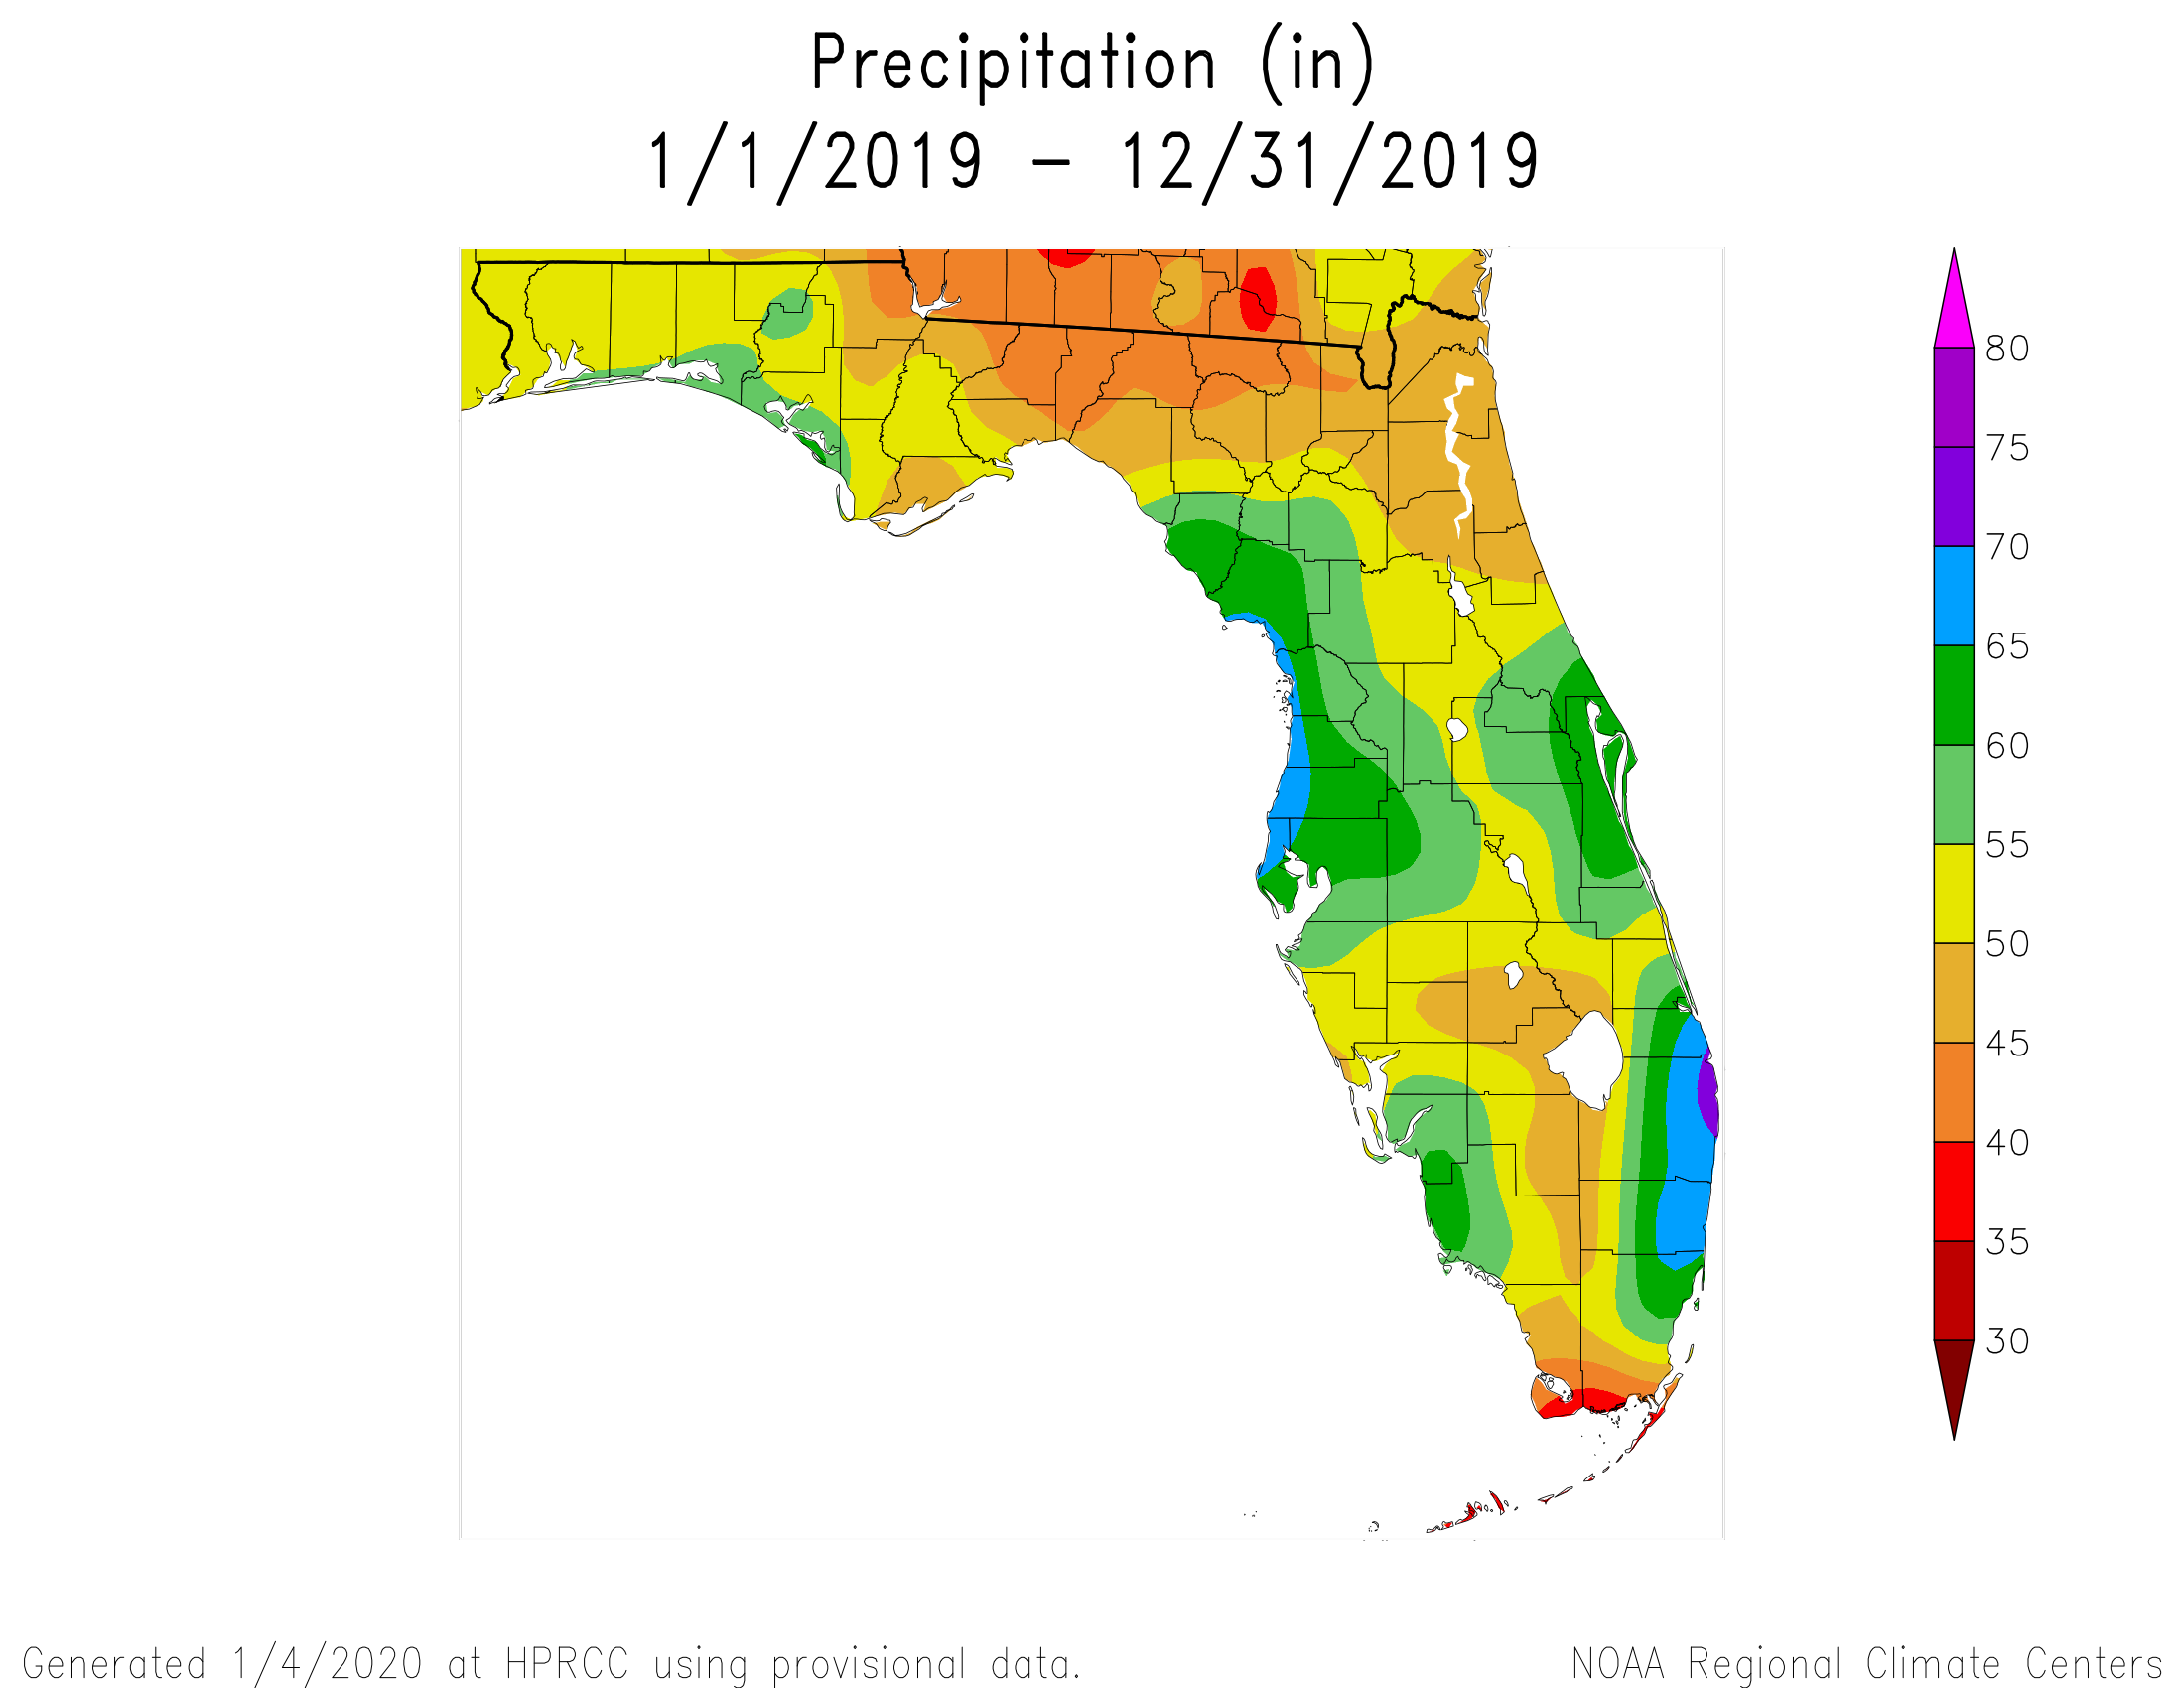
2019 was not a good weather year for farming in the Panhandle. It was the hottest year on record along the impact zone of Hurricane Michael. It was also abnormally dry over the second half of the growing season, so that was a bad combination for growing crops and forages. However, rainfall late in the year brought much of Florida closer to annual averages. NOAA estimated 2019 rainfall totals across the Florida Panhandle as seen in the map above ranged from 40-45″ (brown), 45-50″ (tan), 50-55″ yellow, and with limited areas receiving 55-60″ (light green).
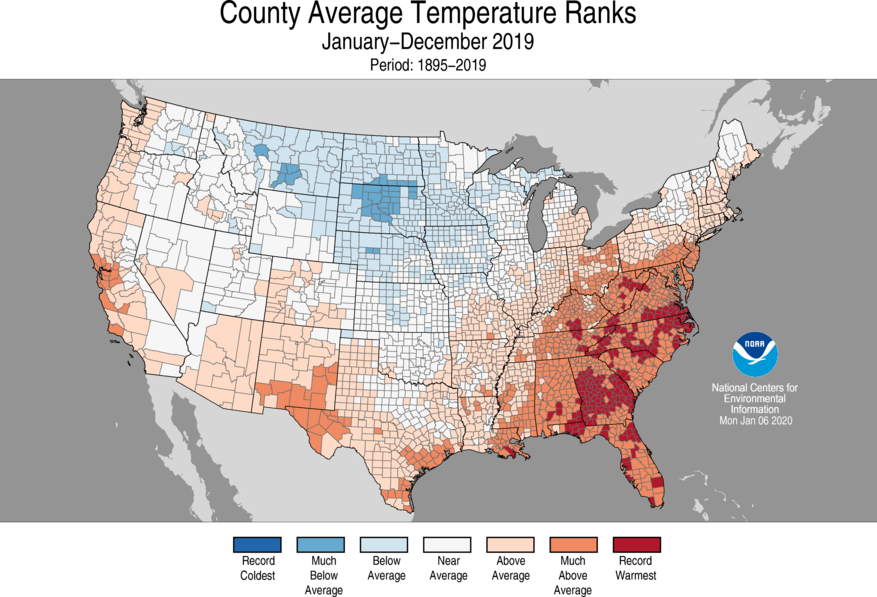
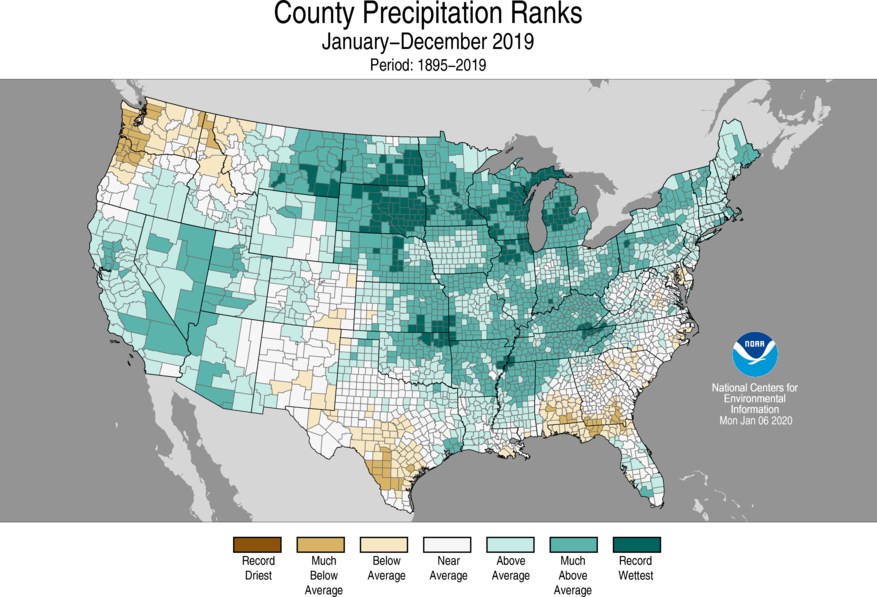 NOAA also produces national maps that compare annual rainfall to historic averages for each county. Through this map you can see that the Eastern Panhandle, Southern Alabama and Southwest Georgia all received below average rainfall in 2019.
–
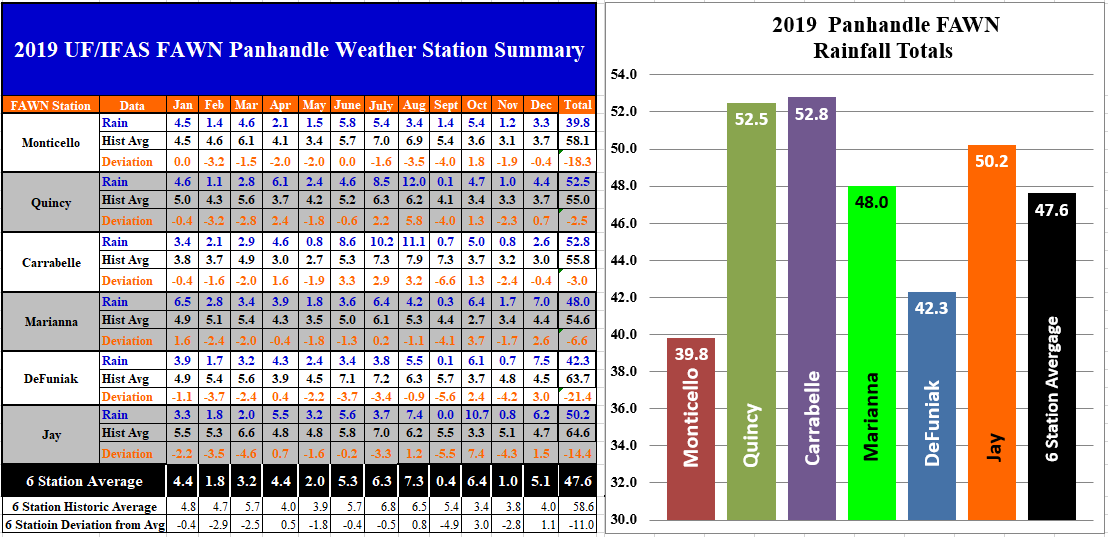
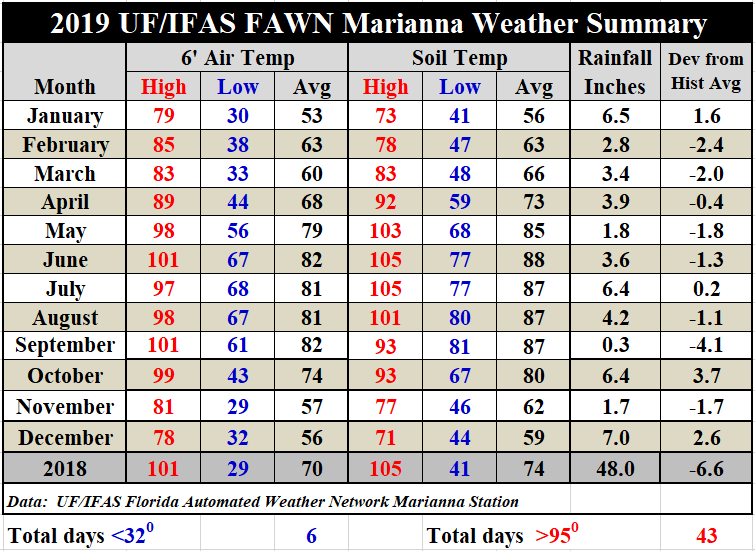
The rainfall records from the six Florida Automated Weather Network (FAWN) stations in the Panhandle show the variation in rainfall that occurred in 2019. The lowest total of 39.8″ was recorded in Monticello, with the highest total of 52.8″ in Carrabelle. All six stations were below historic average in 2019, ranging from -21.4″ in DeFuniak to -2.5″ in Quincy. The average for all six stations was 47.6″, which was 11″ below average.
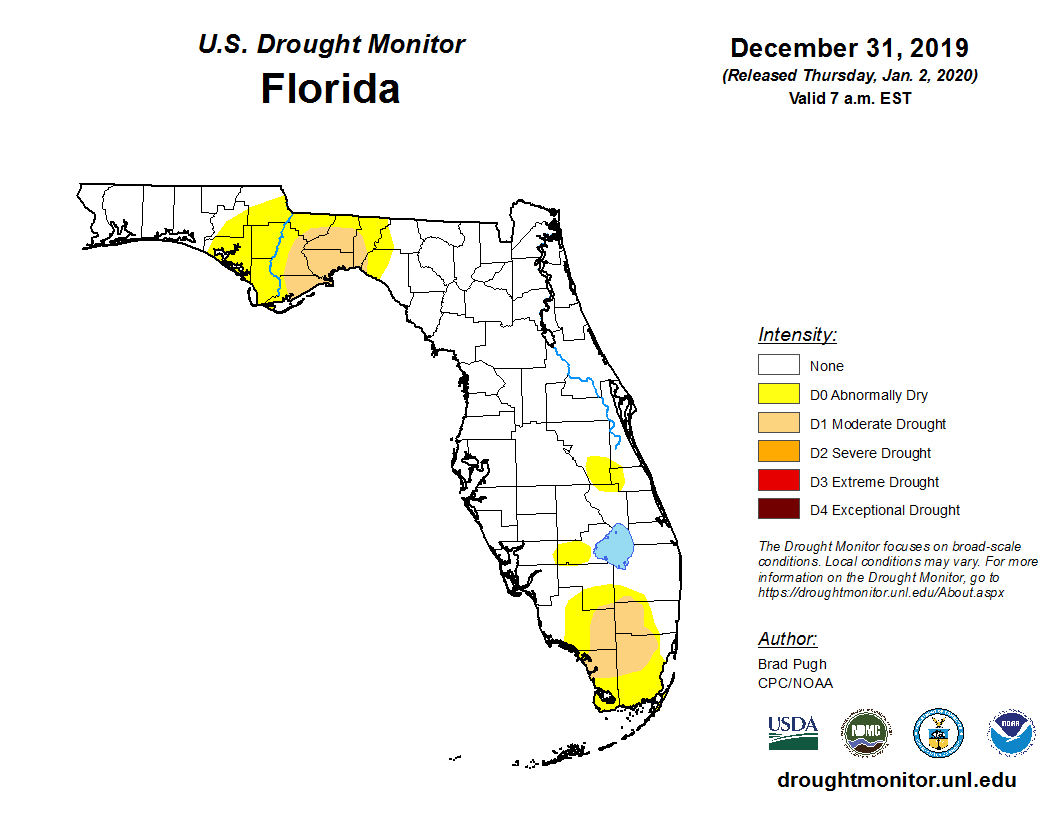
As would be expected, the Central Panhandle region was in the abnormally dry or moderate drought categories of the Drought Monitor at year’s end. This was the same area that was much below average in 2019.
Temperatures
NOAA has tracked average temperatures since 1895. As was mentioned earlier, the Panhandle Counties impacted by Hurricane Michael had record average temperatures in 2019. You just can’t loose that much tree canopy without some negative effects. In addition to all of the damage and lost potential income from downed trees, the area was hotter than ever before. Almost all of the Southeast was much above average for the year, as can been seen in the map below.
 ––
––
–
There were 43 days in 2019 above 95°, and only 6 days below 32°. The average temperature for the year in Marianna was 70°, which was three degrees warmer than 2018, but the spreadsheet used to calculate the annual average is based on the simple averages from each month. I am not sure how NOAA calculates average annual temperatures for the map above, but am fairly certain it is more complicated than the average of 12 averages. The 43 days above 95° was considerably more than the previous five years, with only six days below 32°. To see the complete summary of daily temperatures and rainfall from the Marianna FAWN Station, use the following link: 2019 Jackson Co Weather Summary
 –
–
2020 Outlook
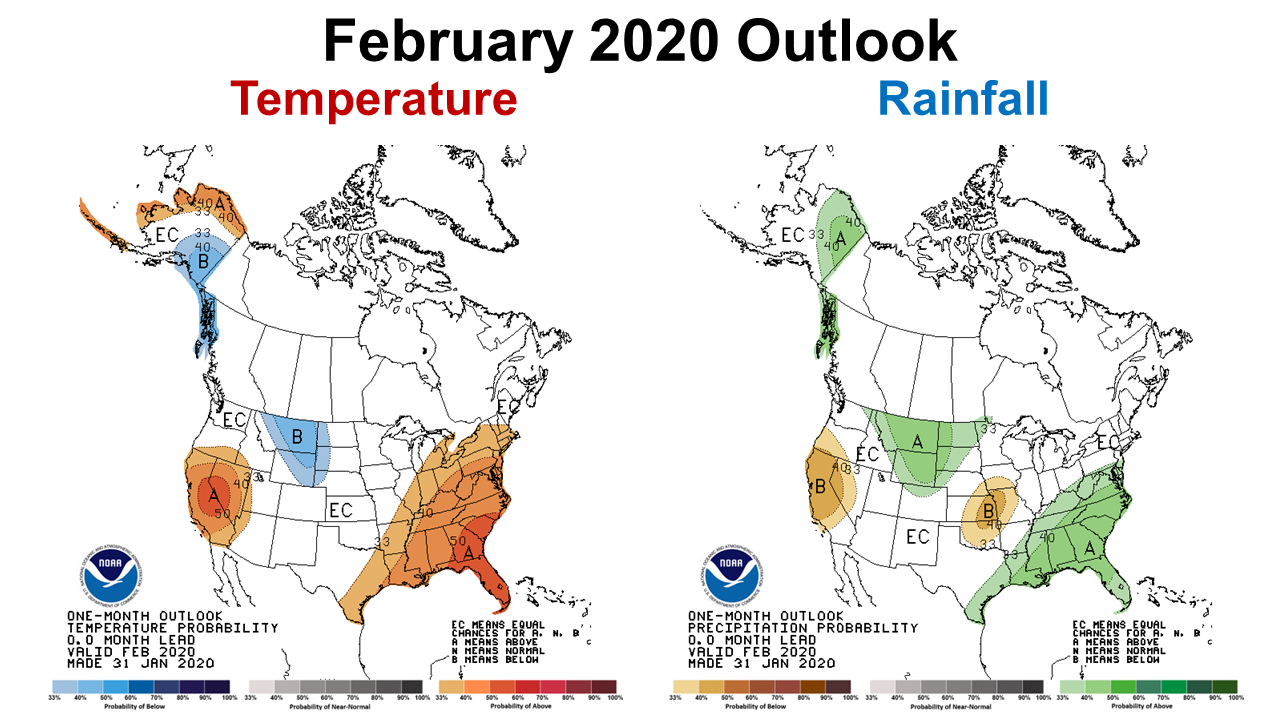
February
The Climate Prediction Center (CPC) forecast calls for a 50% chance of above average temperatures, and a 40% chance of above average rainfall in February across Florida.
 –
–
The above average rainfall expected in February should help get the Big Bend region of the Panhandle out of the Drought Monitor. This is good news, so hopefully farmers can get a clean start to a new cropping season with adequate soil moisture.
 –
–
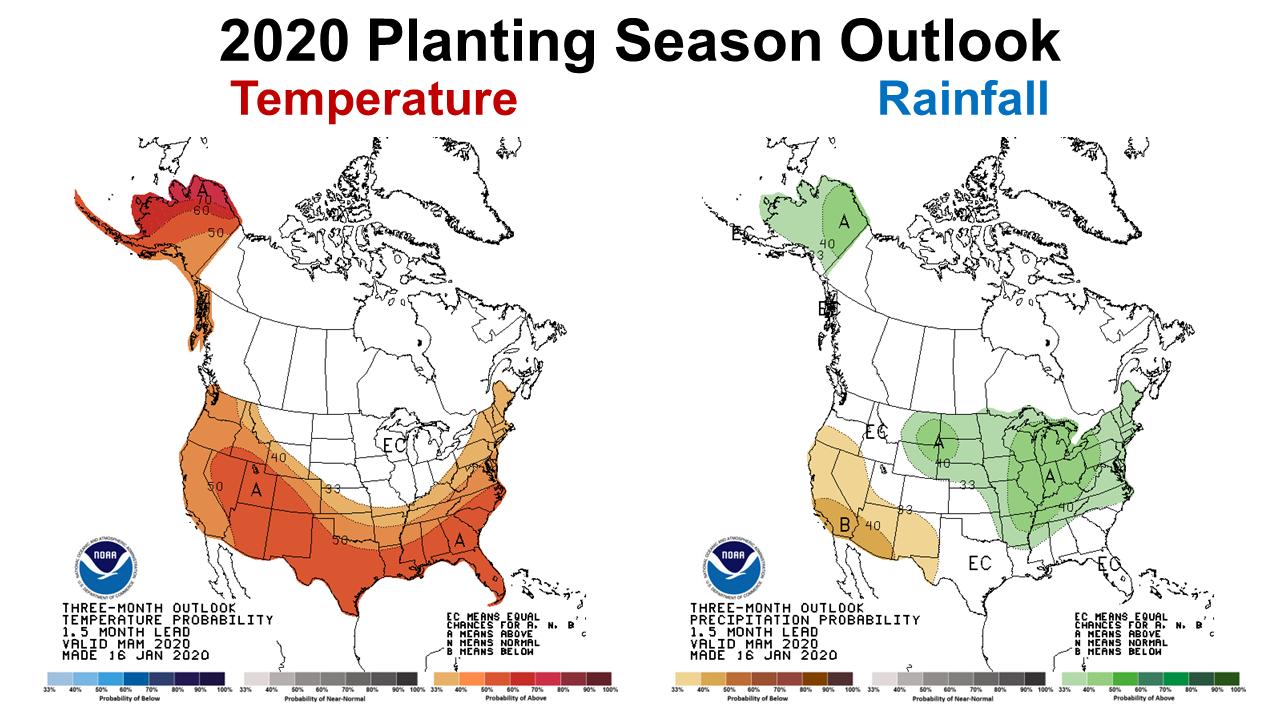
Planting Season Outlook (March-May)
The longer ranged CPC outlook for the planting season of March through May 2020 does not provide any forecast for rainfall, with equal chances of above average, normal or below average precipitation. It does appear that they are expecting the corn belt to be wet again this coming spring. It will be interesting to watch the Corn Futures market, if planting is delayed again this year. The CPC forecast offers a 50% chance that it will be warmer than normal this spring, which could offer an opportunity for early planting, if there is adequate moisture.
 –
–
ENSO Watch
Part of the reason for the uncertainty of the long range forecast is because of the current ENSO neutral conditions. There is a high probability that neither El Niño or La Niña will influence the weather through August of this year.
ENSO-neutral conditions are present. Equatorial sea surface temperatures (SSTs) are near-to-above average across the Pacific Ocean.The tropical atmospheric circulation is generally consistent with ENSO-neutral. ENSO-neutral is favored through Northern Hemisphere spring 2020 (~60% chance), and continuing through summer 2020 (~50% chance). Climate Prediction Center
–
So what do these forecasts mean for area farmers and ranchers?
It is encouraging that the climate forecasters are expecting drought removal for the Panhandle this spring. The short range forecast for February is for warm and wet conditions, so cool-season forages and cover crops should really take off in the weeks ahead. There could be opportunities for planting at least a few fields early, if the soil moisture and temperature are right for adequate germination. Remember though, that these longer range forecasts are less accurate. We have also seen that even though average temperatures for a month are higher, there still can be significant cold snaps that can rapidly cool the soil for a few days. For the most part this current outlook is encouraging, because it appears that the planting season weather looks favorable at this point for the Panhandle.
–
Use the following link to review daily temperatures and rainfall in Marianna, and monthly rainfall totals at all six FAWN stations in the Panhandle:
2019 Jackson County Weather Summary

demayo@ufl.edu - 850-482-9620
Follow me on Twitter
@UFCowman
- Making the Most of High Cattle Prices – Grow More of Your Own Feed - July 18, 2025
- Friday Feature:1960 Corn Farmer - July 18, 2025
- June 2025 Weather Summary and Three-Month Outlook - July 11, 2025