Mark Mauldin, Ag & Natural Resources Agent Washington County, Dr. Barry Tillman, Peanut Breeder UF/IFAS NFREC, Ethan Carter, Regional Row Crop IPM Agent, and Camila Ichazo
The days keep ticking by as we progress through this 2021 crop year. As you can see in the aGDD Tracker below, most March and early April planted fields have reached or passed optimum maturity at this point. I recognize that planting dates that early are not standard for the Panhandle, and certainly not throughout Georgia and Alabama. However, in the southern end of Florida’s peanut producing region they are, and harvest is in full swing in North Central Florida. Here in the Central Panhandle, the fields I’ve been in or discussed recently with growers are still 30 to 60 days out.
As Panhandle growers near the finish of this year’s crop, there is optimism about yield potential, but also concern about building disease pressure. The abundant moisture that has driven yield potential has also maintained a great environment for fungal growth, and made accessing fields for timely applications difficult. Protecting the crop all the way to harvest is crucial for protecting yield, but as we approach harvest you must consider the pre-harvest intervals (PHI) before applying any crop protection products. Below is a table listing some key information (including PHI) for several common fungicides used on peanuts. The table, created by Dr. Nick Dufault, UF/IFAS Plant Pathologist and Ethan Carter, Regional Row Crop IPM Agent, is a handy reference to help you determine which product(s) best fit your disease pressure and anticipated days until harvest. Always read and follow product labels for full details.

*The information in this publication is provided for educational and informational purposes only. The use of any brand names and any mention or listing of commercial products or services in this publication does not imply endorsement by the University of Florida, nor does it imply discrimination against similar products or services not mentioned here. Recommendations for the use of agricultural chemicals were included in this publication as a convenience to the reader. Individuals who use agricultural chemicals are responsible for ensuring that their intended use of the chemical complies with current regulations and conforms to the product label.
** Rates were based on Peanut Rx guides from the respective companies, if available
*** Target pest indicates the likely pathogen use for this fungicide, but does not encompass all the possible pathogens it may control. Refer to the label for more information about target pests.
aGDD Tracker for the Florida Peanut Producing Region – 8/27/21 edition
The aGDD Tracker is compiled from data generated by PeanutFARM.org. he dark blue bars in the cells with the aGDD values indicates progress towards 2500 aGDDs. The extends to the right as aGDDs are accumulated. The entire cell will be dark blue and the text will be orange when a field has accumulated 2500 aGDDs. It is recommended that fields be sampled and exact days-to-harvest be determined via pod-blasting once a field reaches 2300 aGDDs; text will appear yellow for fields that are between 2300 and 2500 aGDDs.
I think it is worth pointing out the 4/7 planting date. That planting date is now 141 days after planting; right at the rule-of-thumb number of days it takes to mature a peanut crop. There are no locations with exactly 2500 aGDDs. Instead, as we would expect, there is considerable variation in the number of aGDDs accumulated; anywhere from 303 aGDDs short to 114 aGDDs past optimum maturity (2,197-2,614). The difference of 417 aGDDs, is based on local growing conditions. The calendar does not consider growing conditions. It is important to track aGDDs for your fields, and when they get close to maturity collect and analyze samples to help optimize harvest timing.
If you have fields that are approaching 2300 aGDDs contact your County Extension Office and make arrangements to have samples analyzed. Over the past two weeks fields accumulated approximately 145 aGDDs each week, so plan accordingly. Remember, that the information generated will only be as good as the sample provided. Collect a good representative sample; dig (don’t pull) plants from several locations throughout the field, avoiding field edges and the ends of rows. Below is a link to a document that describes the entire maturity evaluation process in detail.
Methods to Evaluate Peanut Maturity for Optimal Seed Quality and Yield
Use the Tracker to approximate how your fields are progressing by following the fields on the Tracker that are the most similar to yours in terms of planting date, location and irrigation status. For more precise tracking of your fields got to PeanutFARM.org and set up your fields in the system. You will be able to enter field specific rainfall/irrigation data and soil type. Temperature data will come from the closest FAWN weather station.
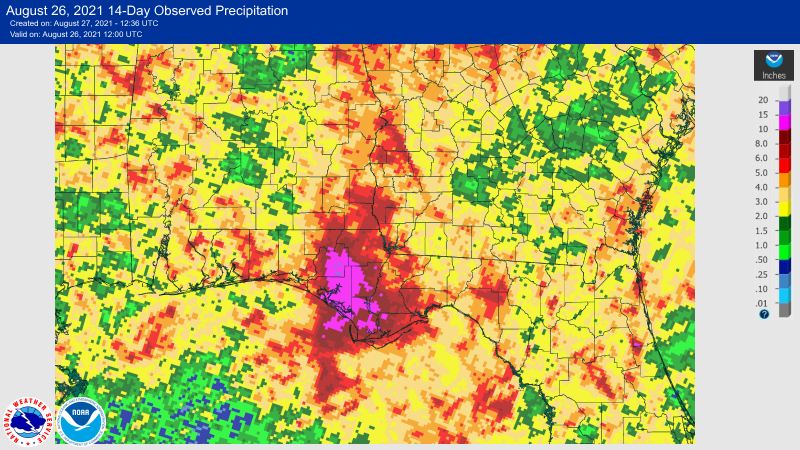
The past 14 days have been particularly wet in the Central Panhandle and it looks like Tropical Storm/Hurricane Ida is posed to bring even more moisture to the region. Applying crop protection products has been, and likely will continue to be difficult due to wet field conditions – do what you can to aggressively protect the crop. https://water.weather.gov/precip/