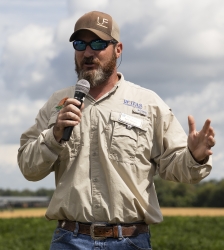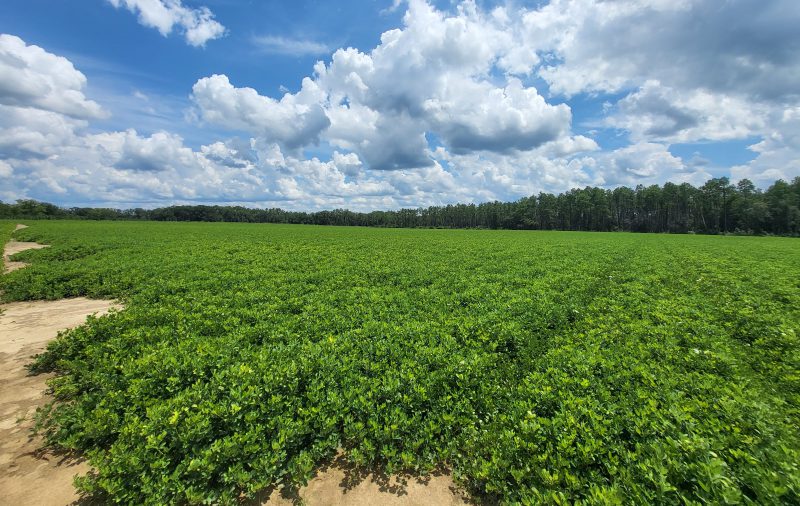
Peanut variety trial in Washington County. These peanuts were planted May 4 (107 DAP) and according to the aGDD Tracker they should have accumulated just under 2000 aGDDs at this point. We will pull samples and pod-blast in about 2 weeks. Credit: Mark Mauldin, UF/IFAS
Green (immature) peanuts are already being harvested for boiling, and this morning on the news they were previewing high school football games – a busy summer has almost completely flown by without my having published an aGDD Tracker. Apologies for my tardiness but in this case I suppose better late than never. While we are rapidly closing in on harvest time for some of our earliest planted peanuts, for the bulk of the crop it is time to start monitoring maturity closely in order to time harvest so that yield and grade can be maximized.
The tracker below shows the number of Average Growing Degree Days (aGDDs) accumulated by 88 fictional fields (8 locations x 11 planting dates) as of 8/19/22. Real temperature and rainfall data from the locations is used as well as common soil types for the areas (Jay – loamy sand, Marianna – sandy loam, Marianna Irrigated – sand, Monticello – sandy loam, Live Oak and Bronson – sand). Use the Tracker to approximate how your fields are progressing by following the fields on the Tracker that are the most similar to yours in terms of planting date, location and irrigation status. For more precise tracking of your fields got to PeanutFARM.org and set up your fields in the system. You will be able to enter field specific rainfall/irrigation data and soil type. Temperature data will come from the closest FAWN weather station. If you are interested in setting up your own fields on PeanutFARM.org don’t hesitate to contact me for assistance.
=
aGDD Tracker for the Florida Peanut Producing Region – 8/19/22 edition
![]()
The aGDD Tracker is compiled from data generated by PeanutFARM.org. The dark blue bars in the cells with the aGDD values indicates progress towards 2500 aGDDs. The bar extends to the right as aGDDs are accumulated. The entire cell will be dark blue and the text will be orange when a field has accumulated 2500 aGDDs. It is recommended that fields be sampled and exact days-to-harvest be determined via pod-blasting once a field reaches 2300 aGDDs; text will appear yellow for fields that are between 2300 and 2500 aGDDs.
If you have fields that are approaching 2300 aGDDs, contact your County Extension Office and make arrangements to have samples analyzed. At this point in the season, with good moisture, fields will accumulate approximately 150 aGDDs each week so plan accordingly – there will be a lot more orange and yellow on the Tracker next week. Remember, that the information generated by the pod-blasting will only be as good as the sample provided. Collect a good representative sample; dig (don’t pull) plants from several locations throughout the field, avoiding field edges and the ends of rows. Below is a link to a document that describes the entire maturity evaluation process in detail.
Methods to Evaluate Peanut Maturity for Optimal Seed Quality and Yield
=
A few “Nerd Notes” from the Tracker:
Based on the current numbers, we see the expected trend of the later planting dates averaging more accumulated aGDDs per number of calendar days after planting than the earlier planting dates. This is expected because the later planted fields have had few if any days where air or soil temperatures limited growth. Both the 6/6 and 6/13 planting dates are averaging 20.5 aGDDs per calendar day, whereas the 4/4 and 4/11 planting dates are averaging 17.3 and 17.9 aGDDs per calendar day. Again, the difference is caused by cooler temperatures the early planted fields experience in the early growing season. At this point in the season, temperature is not a factor – we have plenty of heat and assuming adequate moisture all the fields will be accumulating aGDDs at approximately the same rate.
Also as expected, the irrigated fields are out pacing the rain fed fields. For the irrigated fields shown on the Tracker, PeanutFARM is counting aGDDs as they would accumulate with absolutely zero drought stress. Since the fields are fictional and we don’t have to pay to run an imaginary pivot, our imaginary peanuts get every drop of water they want on demand. In this scenario, our irrigated fields have averaged 21.0 aGDDs per calendar day across all locations and planting dates compared to the rain fed fields which are averaging 17.9 aGDDs per calendar day. Real-life irrigation management may not result in that substantial of a difference. Back in computer model world, the later planted, irrigated fields (no drought stress and plenty of heat since planting) are averaging 22.4 aGDDs per calendar day. This rate of accumulation would allow a peanut crop to mature in 112 days. Before you rush off to hook up the digger, remember this is a “perfect world” scenario, disease and insect pressure, among other things can slow peanuts down even if moisture and heat are in abundant supply. The best approach is to let the Tracker tell you when your fields should be close to 2300 aGDDs then pull sample and make harvest plans based on the pod-blasting results.