
Ethan Carter, Regional Row Crop IPM Agent and Mark Mauldin, Washington County Agriculture Agent
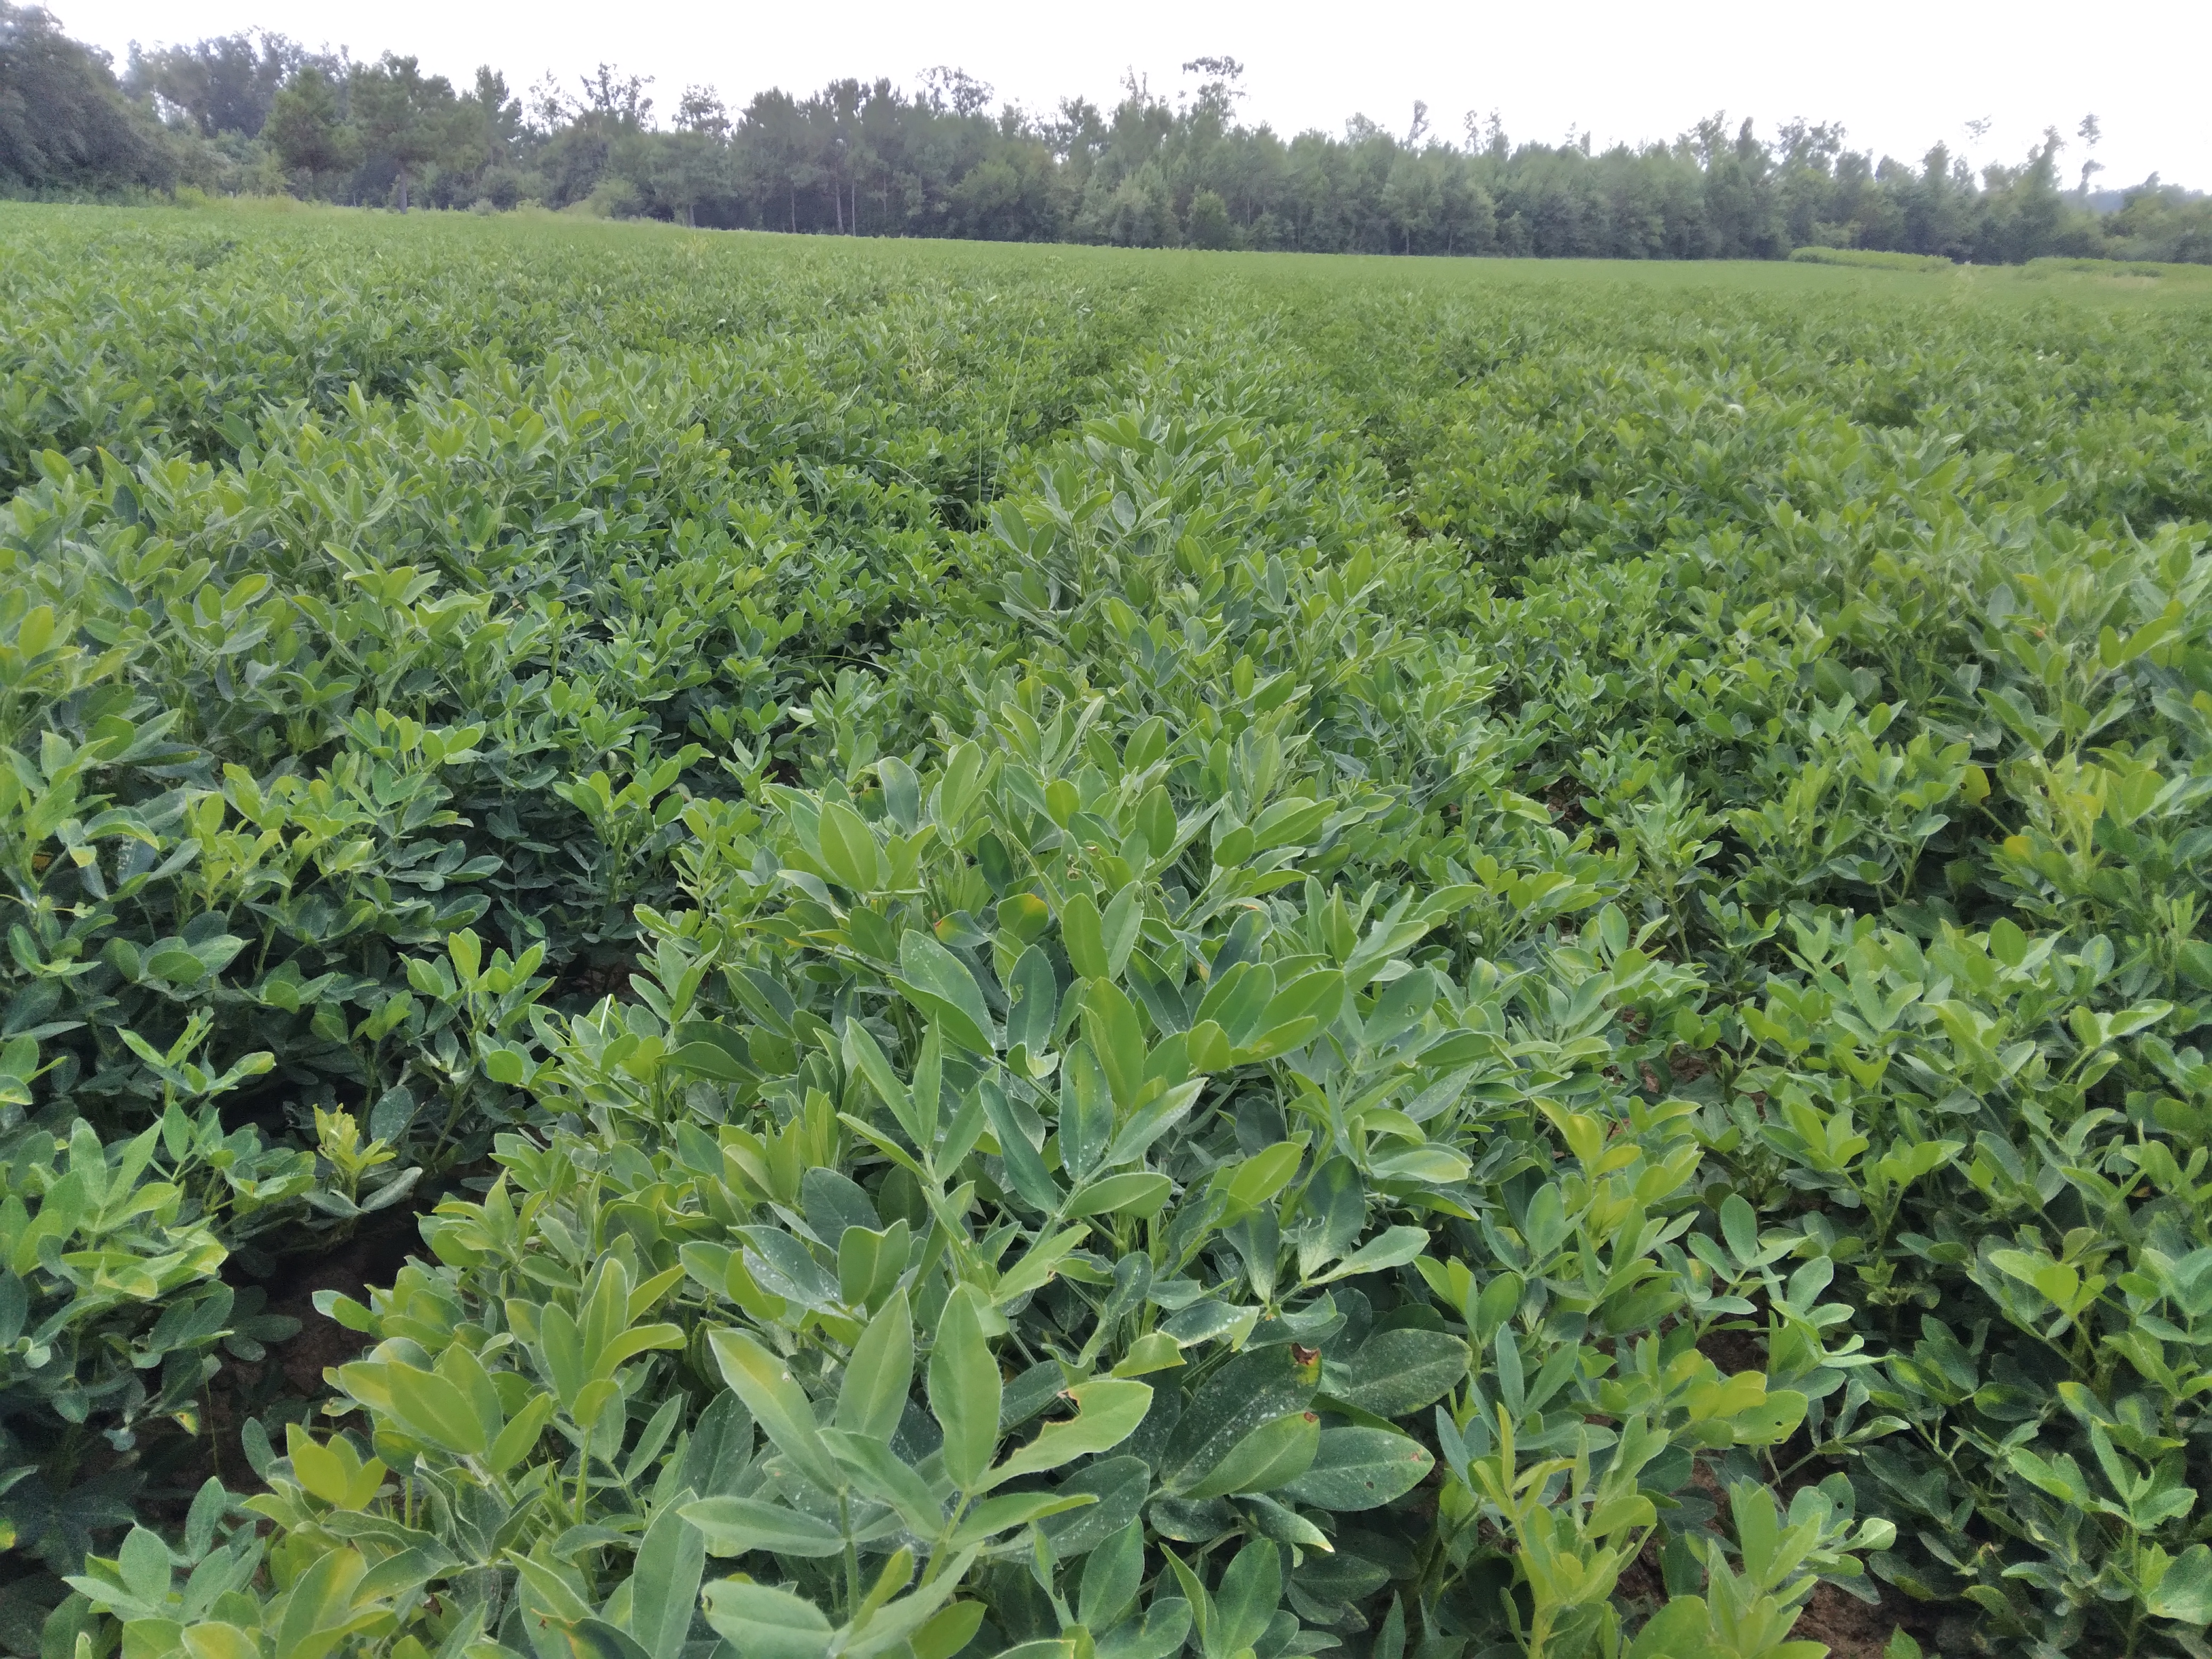
Dryland peanut field, September 2022 in Jackson County, Florida.
September is here, and that means peanut harvest is just around the corner. Equipment is starting to move down the roadways, maturity samples are being pod-blasted and boarded, and some Panhandle growers have started digging early planted peanuts this week.
–
Optimizing Harvest Date
A majority of April planted fields are approaching 140 DAP (days after planting) on the calendar, the harvest window for many commercial varieties, including the industry standard, Georgia 06G. Fields planted in May are also rapidly progressing towards the 140 DAP mark. For example, a May 1st planted field would be 132 DAP on September 9th. As we come to the end of the growing season it is important to closely monitor the crop’s physiological maturity in order to optimize harvest timing to maximize yield and grade. Tracking the accumulation of adjusted Growing Degree Days (aGDDs) is an excellent way to monitor crop maturity as it accounts for variations in speed of maturity associated with weather factors. The aGDD Tracker below shows the number of aGDDs accumulated by 88 fictional fields (8 locations x 11 planting dates) as of 9/9/2022. Real temperature and rainfall data from the locations is used as well as common soil types for the areas (Jay – loamy sand, Marianna – sandy loam, Marianna Irrigated – sand, Monticello – sandy loam, Live Oak and Bronson – sand). Use the Tracker to approximate how your fields are progressing by following the fields on the Tracker that are the most similar to yours in terms of planting date, location and irrigation status.
aGDD Tracker for the Florida Peanut Producing Region – 9/9/22 edition
![]() –
–
The aGDD Tracker is compiled from data generated by PeanutFARM.org. The dark blue bars in the cells with the aGDD values indicates progress towards 2500 aGDDs. The bar extends to the right as aGDDs are accumulated. The entire cell will be dark blue and the text will be orange when a field has accumulated 2500 aGDDs. It is recommended that fields be sampled and exact days-to-harvest be determined via pod-blasting once a field reaches 2300 aGDDs; text will appear yellow for fields that are between 2300 and 2500 aGDDs.
When a field has reached approximately 2300 aGDDs it is time to pull a sample and use the maturity profile board to fine-tune the number of days until optimum harvest. To use the maturity board peanut plants are pulled in the field, 180-200 pods are picked off and then blasted using a pressure washer and a rotating turbo nozzle. Once the outer layer of shell is removed, the maturity level of different pods can be assessed based on their mesocarp (secondary shell) color. Farmers can do this at the farm, if they have the necessary materials or they can reach out to their local extension office and have them blast and board samples. Maturity checks are typically performed when one of two requirements are met, nearing 140 DAP or the accumulation of 2300 aGDD (heat units).
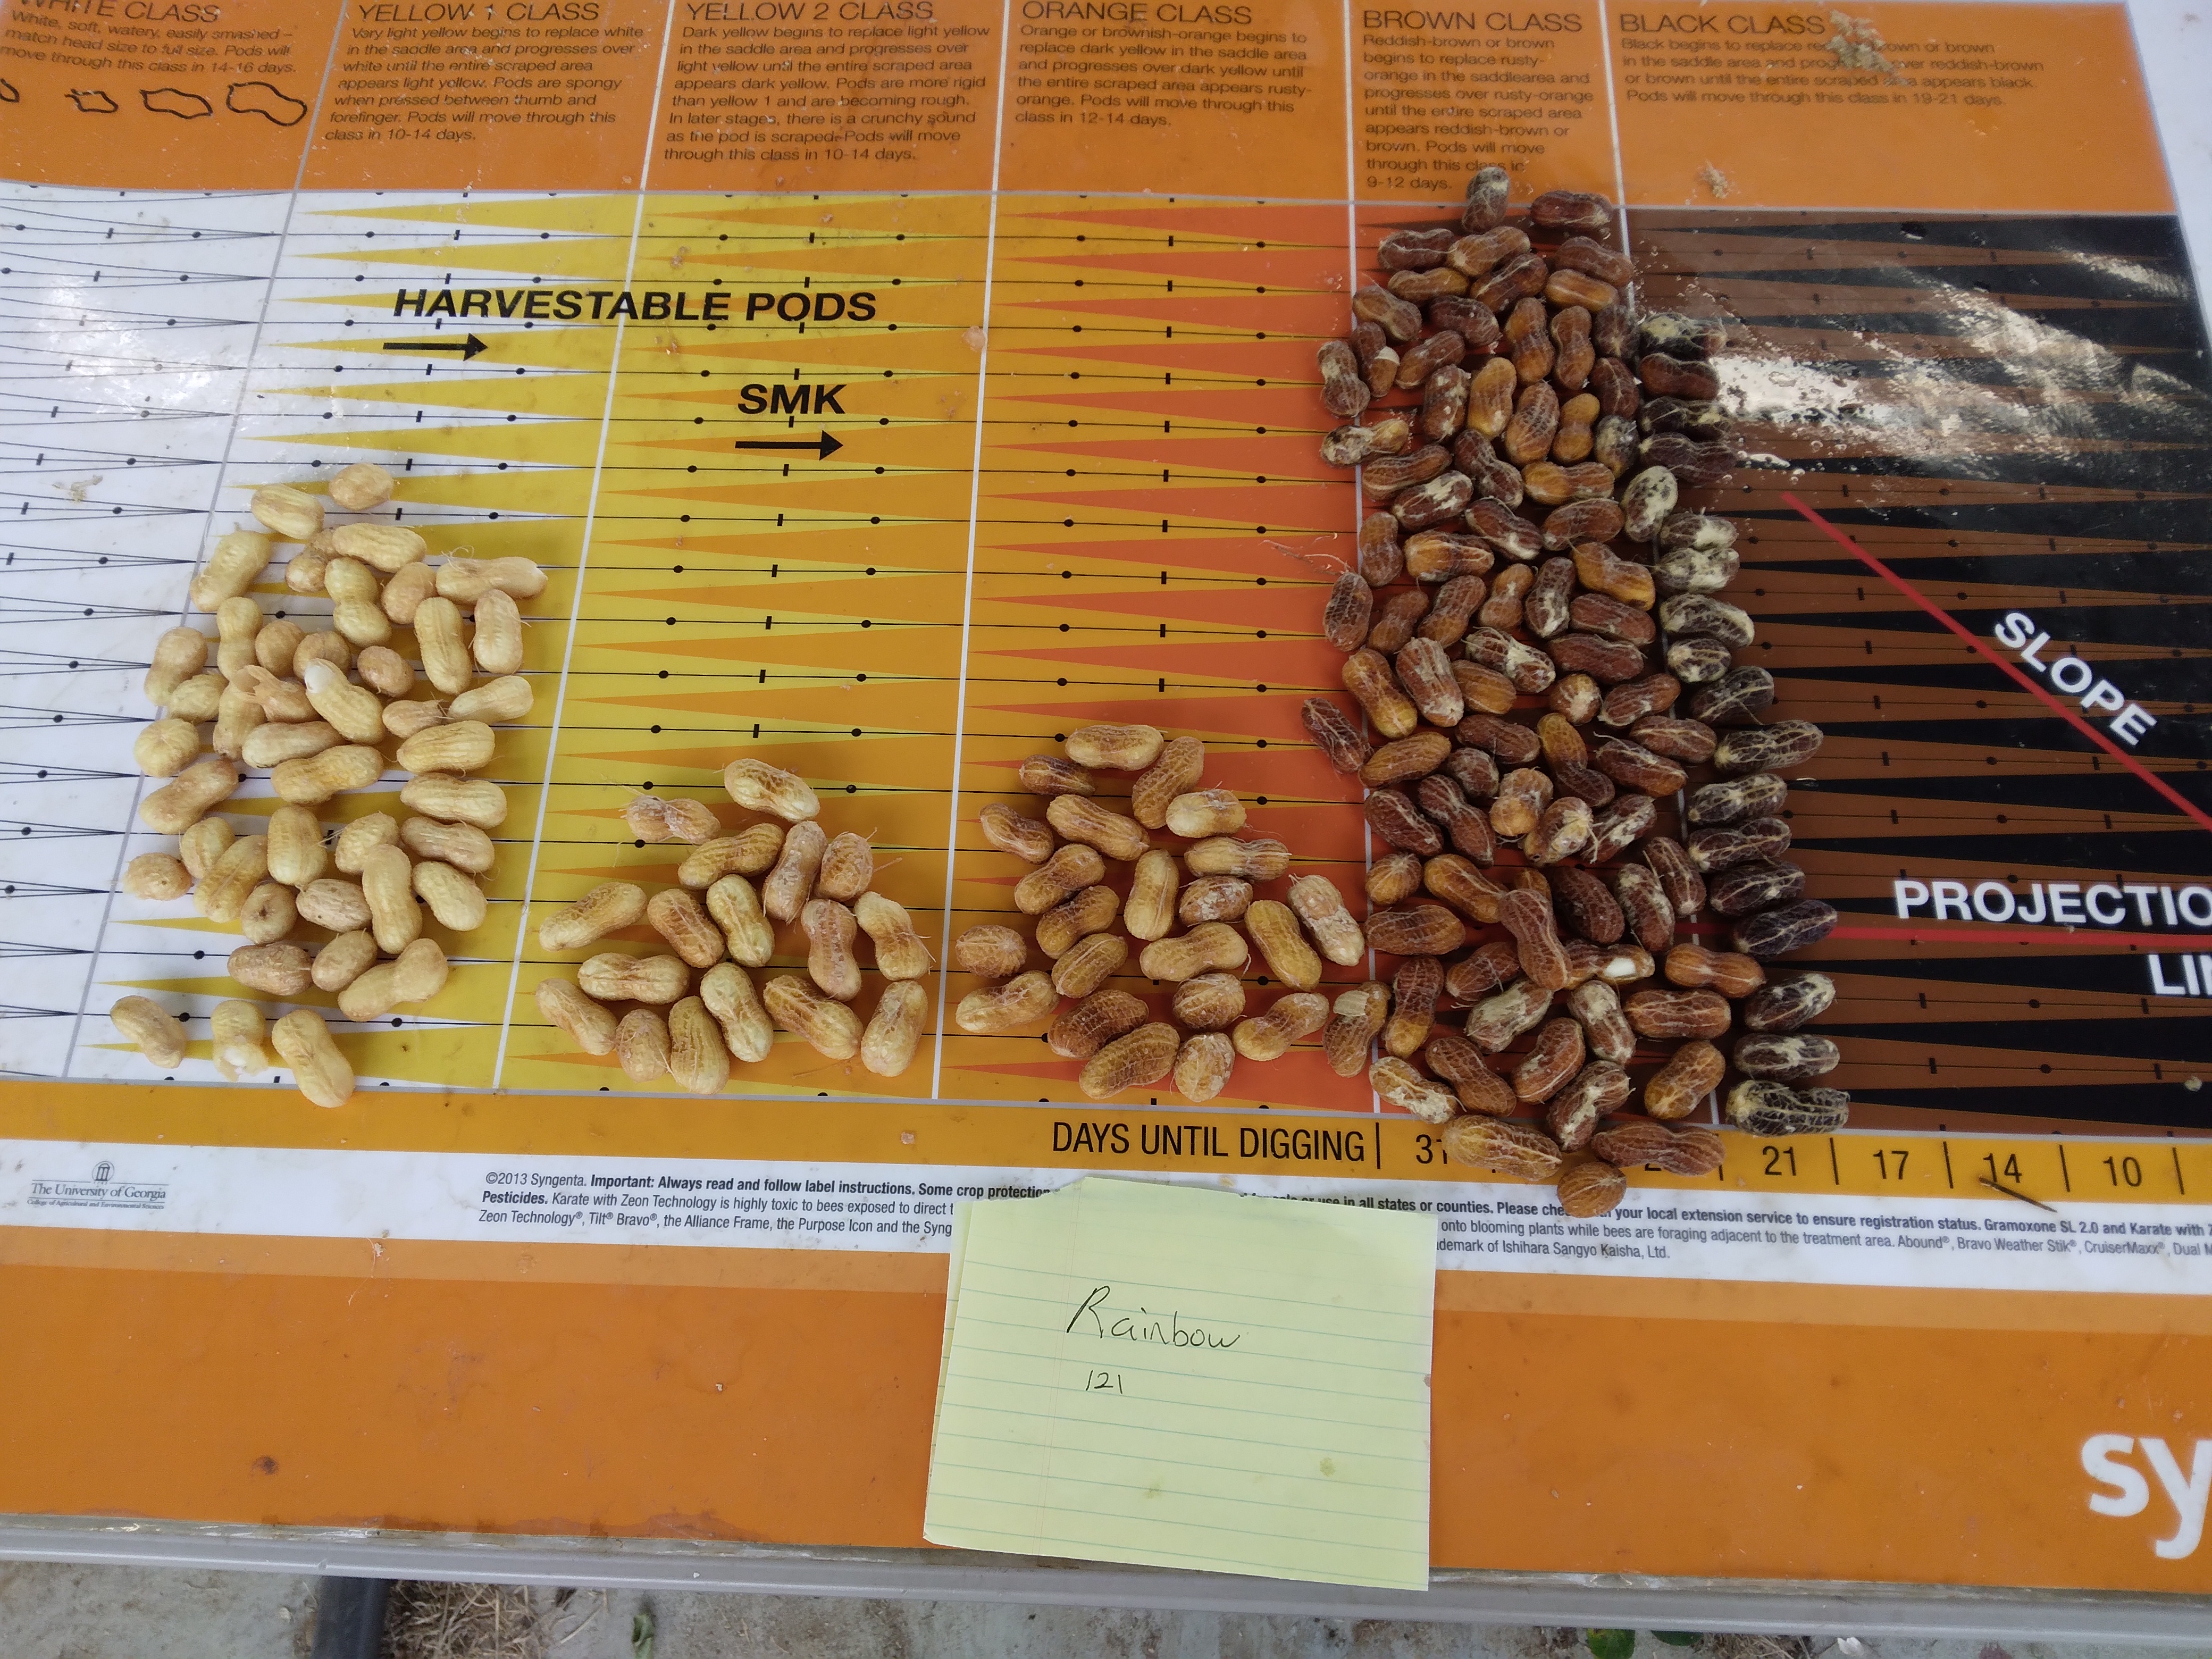
Peanut maturity board for peanuts sampled in early September for maturity. Credit: Ethan Carter, UF/IFAS
–
A Peanut Maturity Anecdote
The peanut variety trial in Washington County was planted on May 4th (128 DAP) and would be most closely approximated by the Marianna / 5/2 planting date field shown in the Tracker. Based on the Tracker, we would expect that field to have accumulated approximately 2277 aGDDs thus far. Because we were getting very close to 2300 aGDDs, today samples were pulled and pod-blasted, there was some some variation between varieties but the when averaged together the indicated 12 more days until optimum harvest time. 128 DAP plus 12 more days comes out to exactly 140 DAP. The field has been averaging about 17.5 aGDDs per calendar day. 12 more days x 17.5aGDDs/day = 210 more aGDDs. 210 + 2277 (already accumulated) = 2487 total aGDDs. While this is not exactly 2500 it is very close, less than one day’s accumulation different. It is somewhat unusual that a field so closely follows all of the averages but it is a nice affirmation when all of the harvest timing tools point us in exactly the same direction. This doesn’t mean you should just use DAP – it hardly ever works out this neatly. The maturity board is the most reliable option.
–
Final Decisions – To Spray or Not to Spray
Disease pressure increases as the season progresses, and this year is no exception. In late August or early September, leaf spots tend to cause rapid defoliation when most fields are between 115 and 130 DAP. If leaf spot has gotten out of hand and plants are severely defoliated preventing pod-loss takes precedence over optimizing maturity. As a rule, if a field is 50% defoliated, we recommend that producers dig within 7 days regardless of what the maturity board says. When 75% or higher defoliation has occurred pod loss is a huge risk and peanuts should be dug as soon as possible.
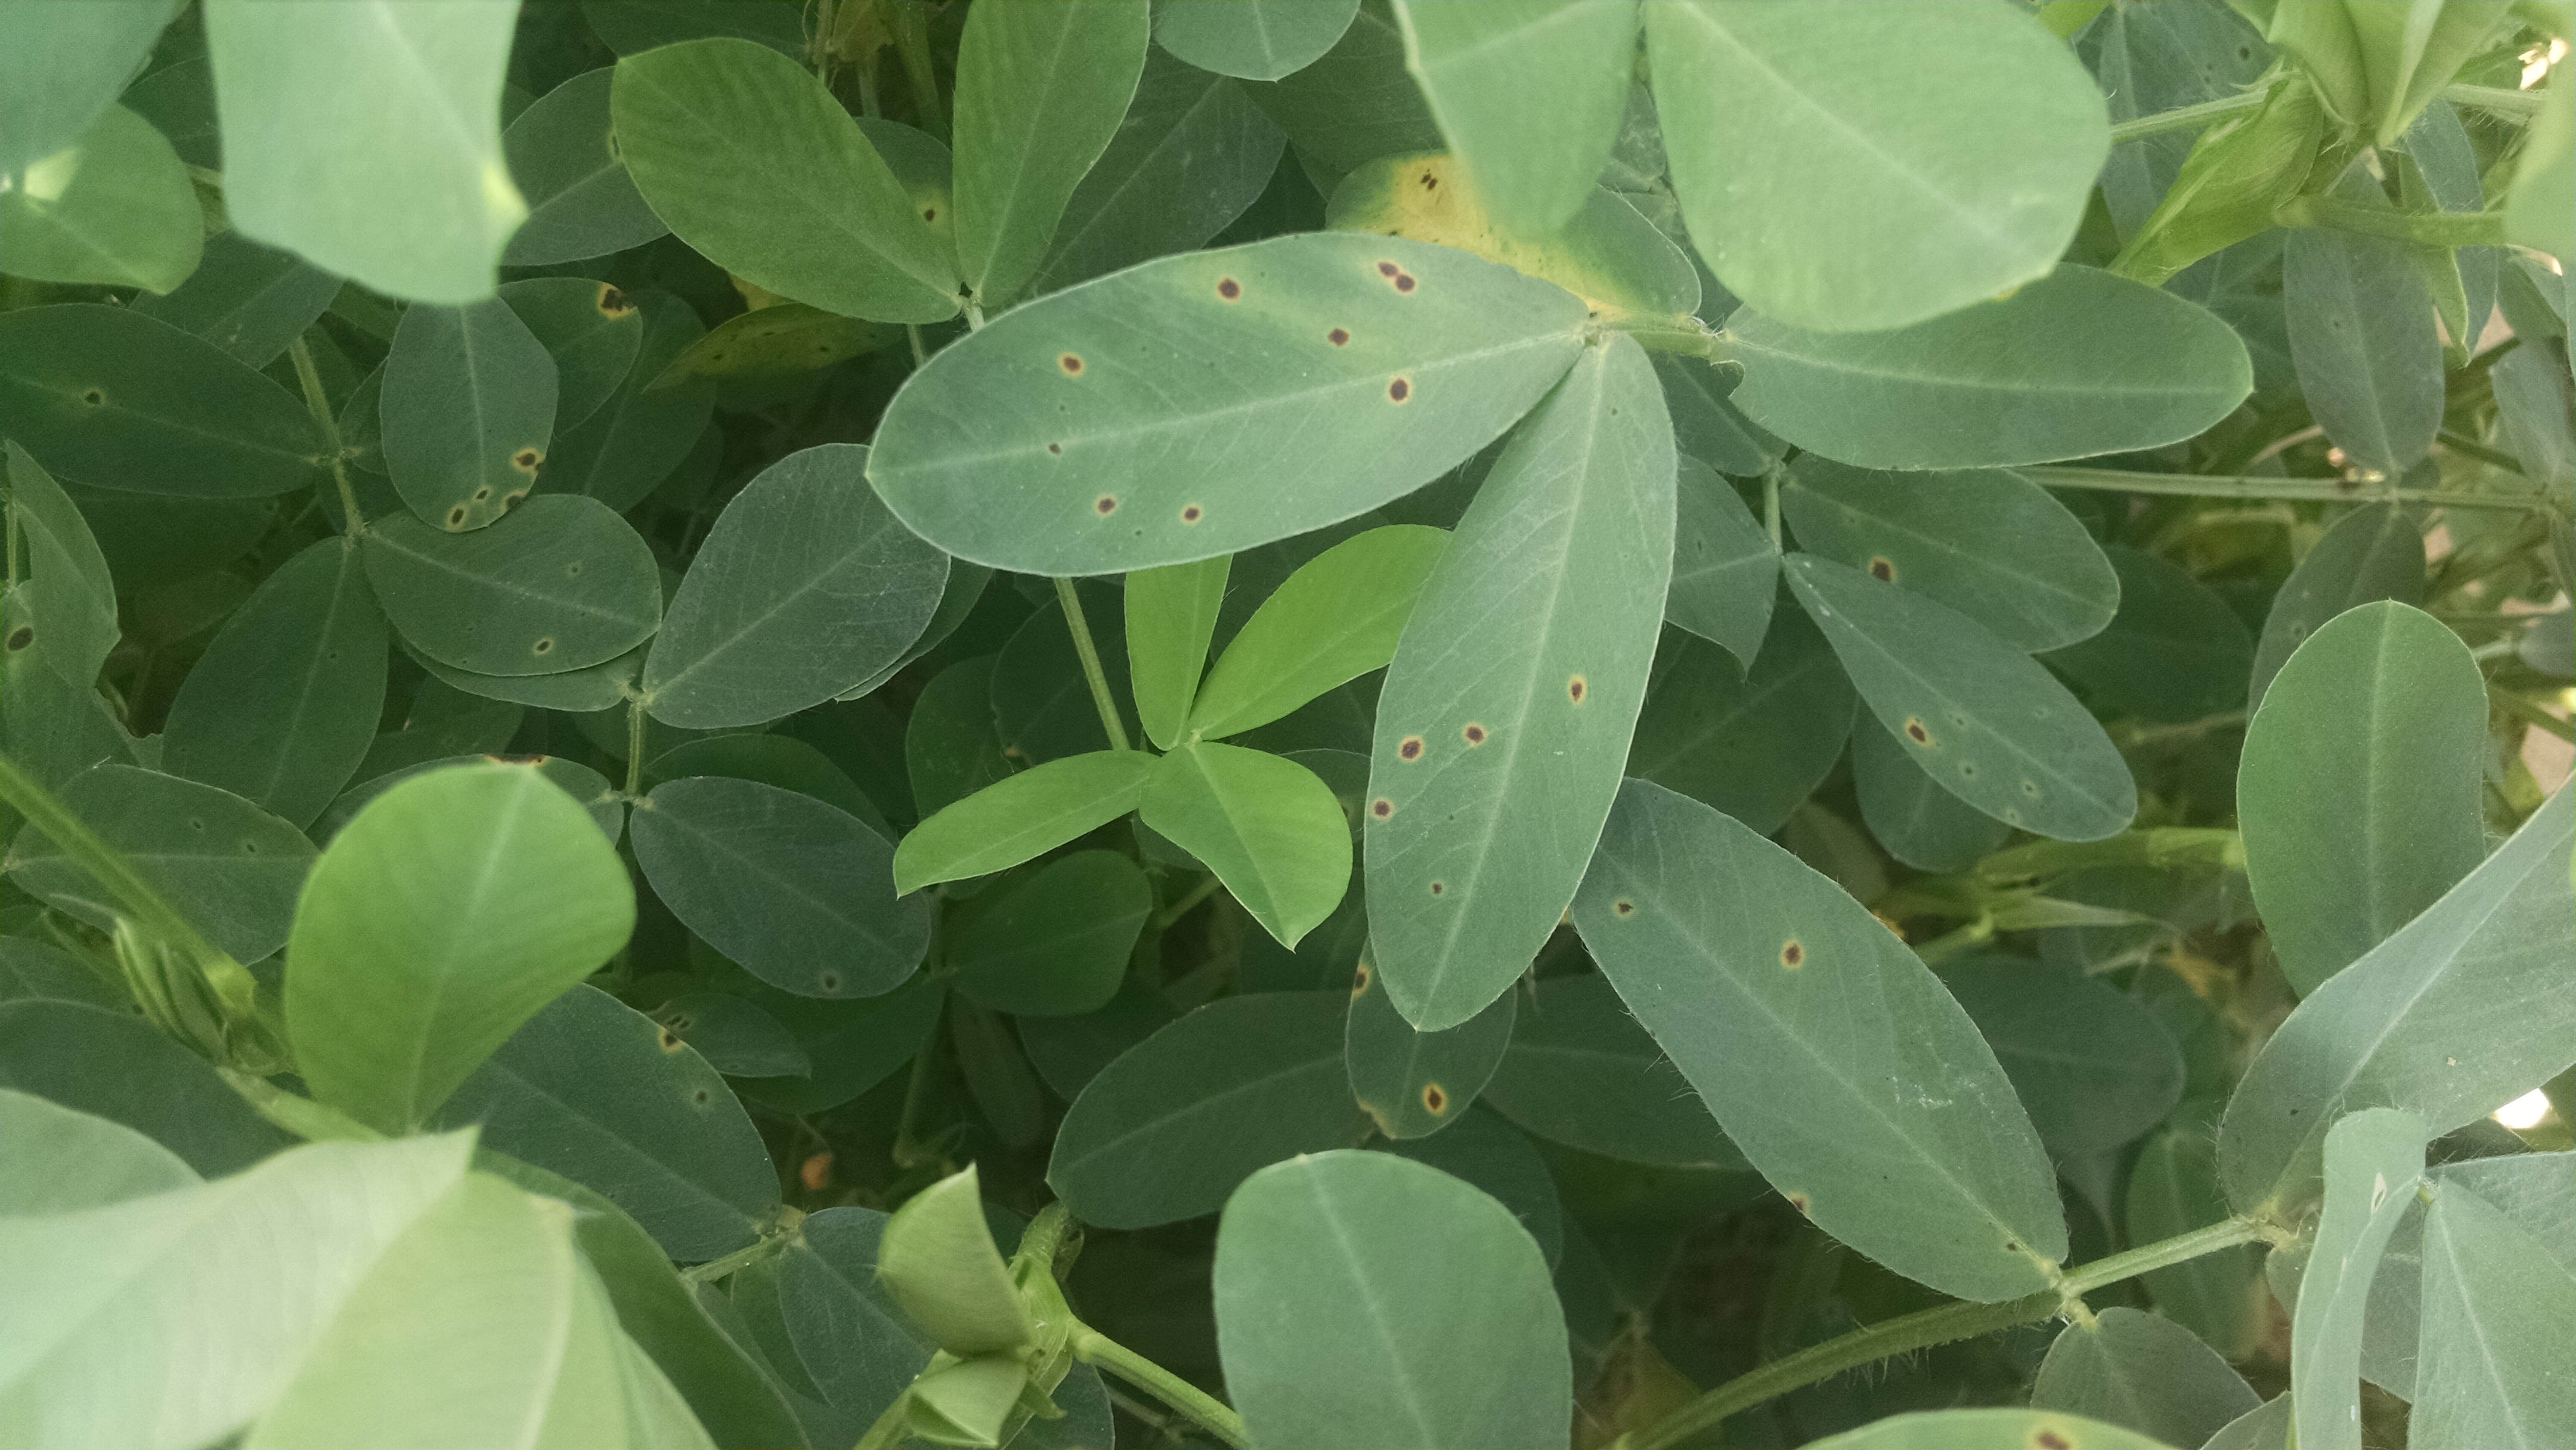
Early leaf spot, a disease that produces spores on the top side of the leaves. The yellow halos are generally associated with this disease, although they are not always present.
–
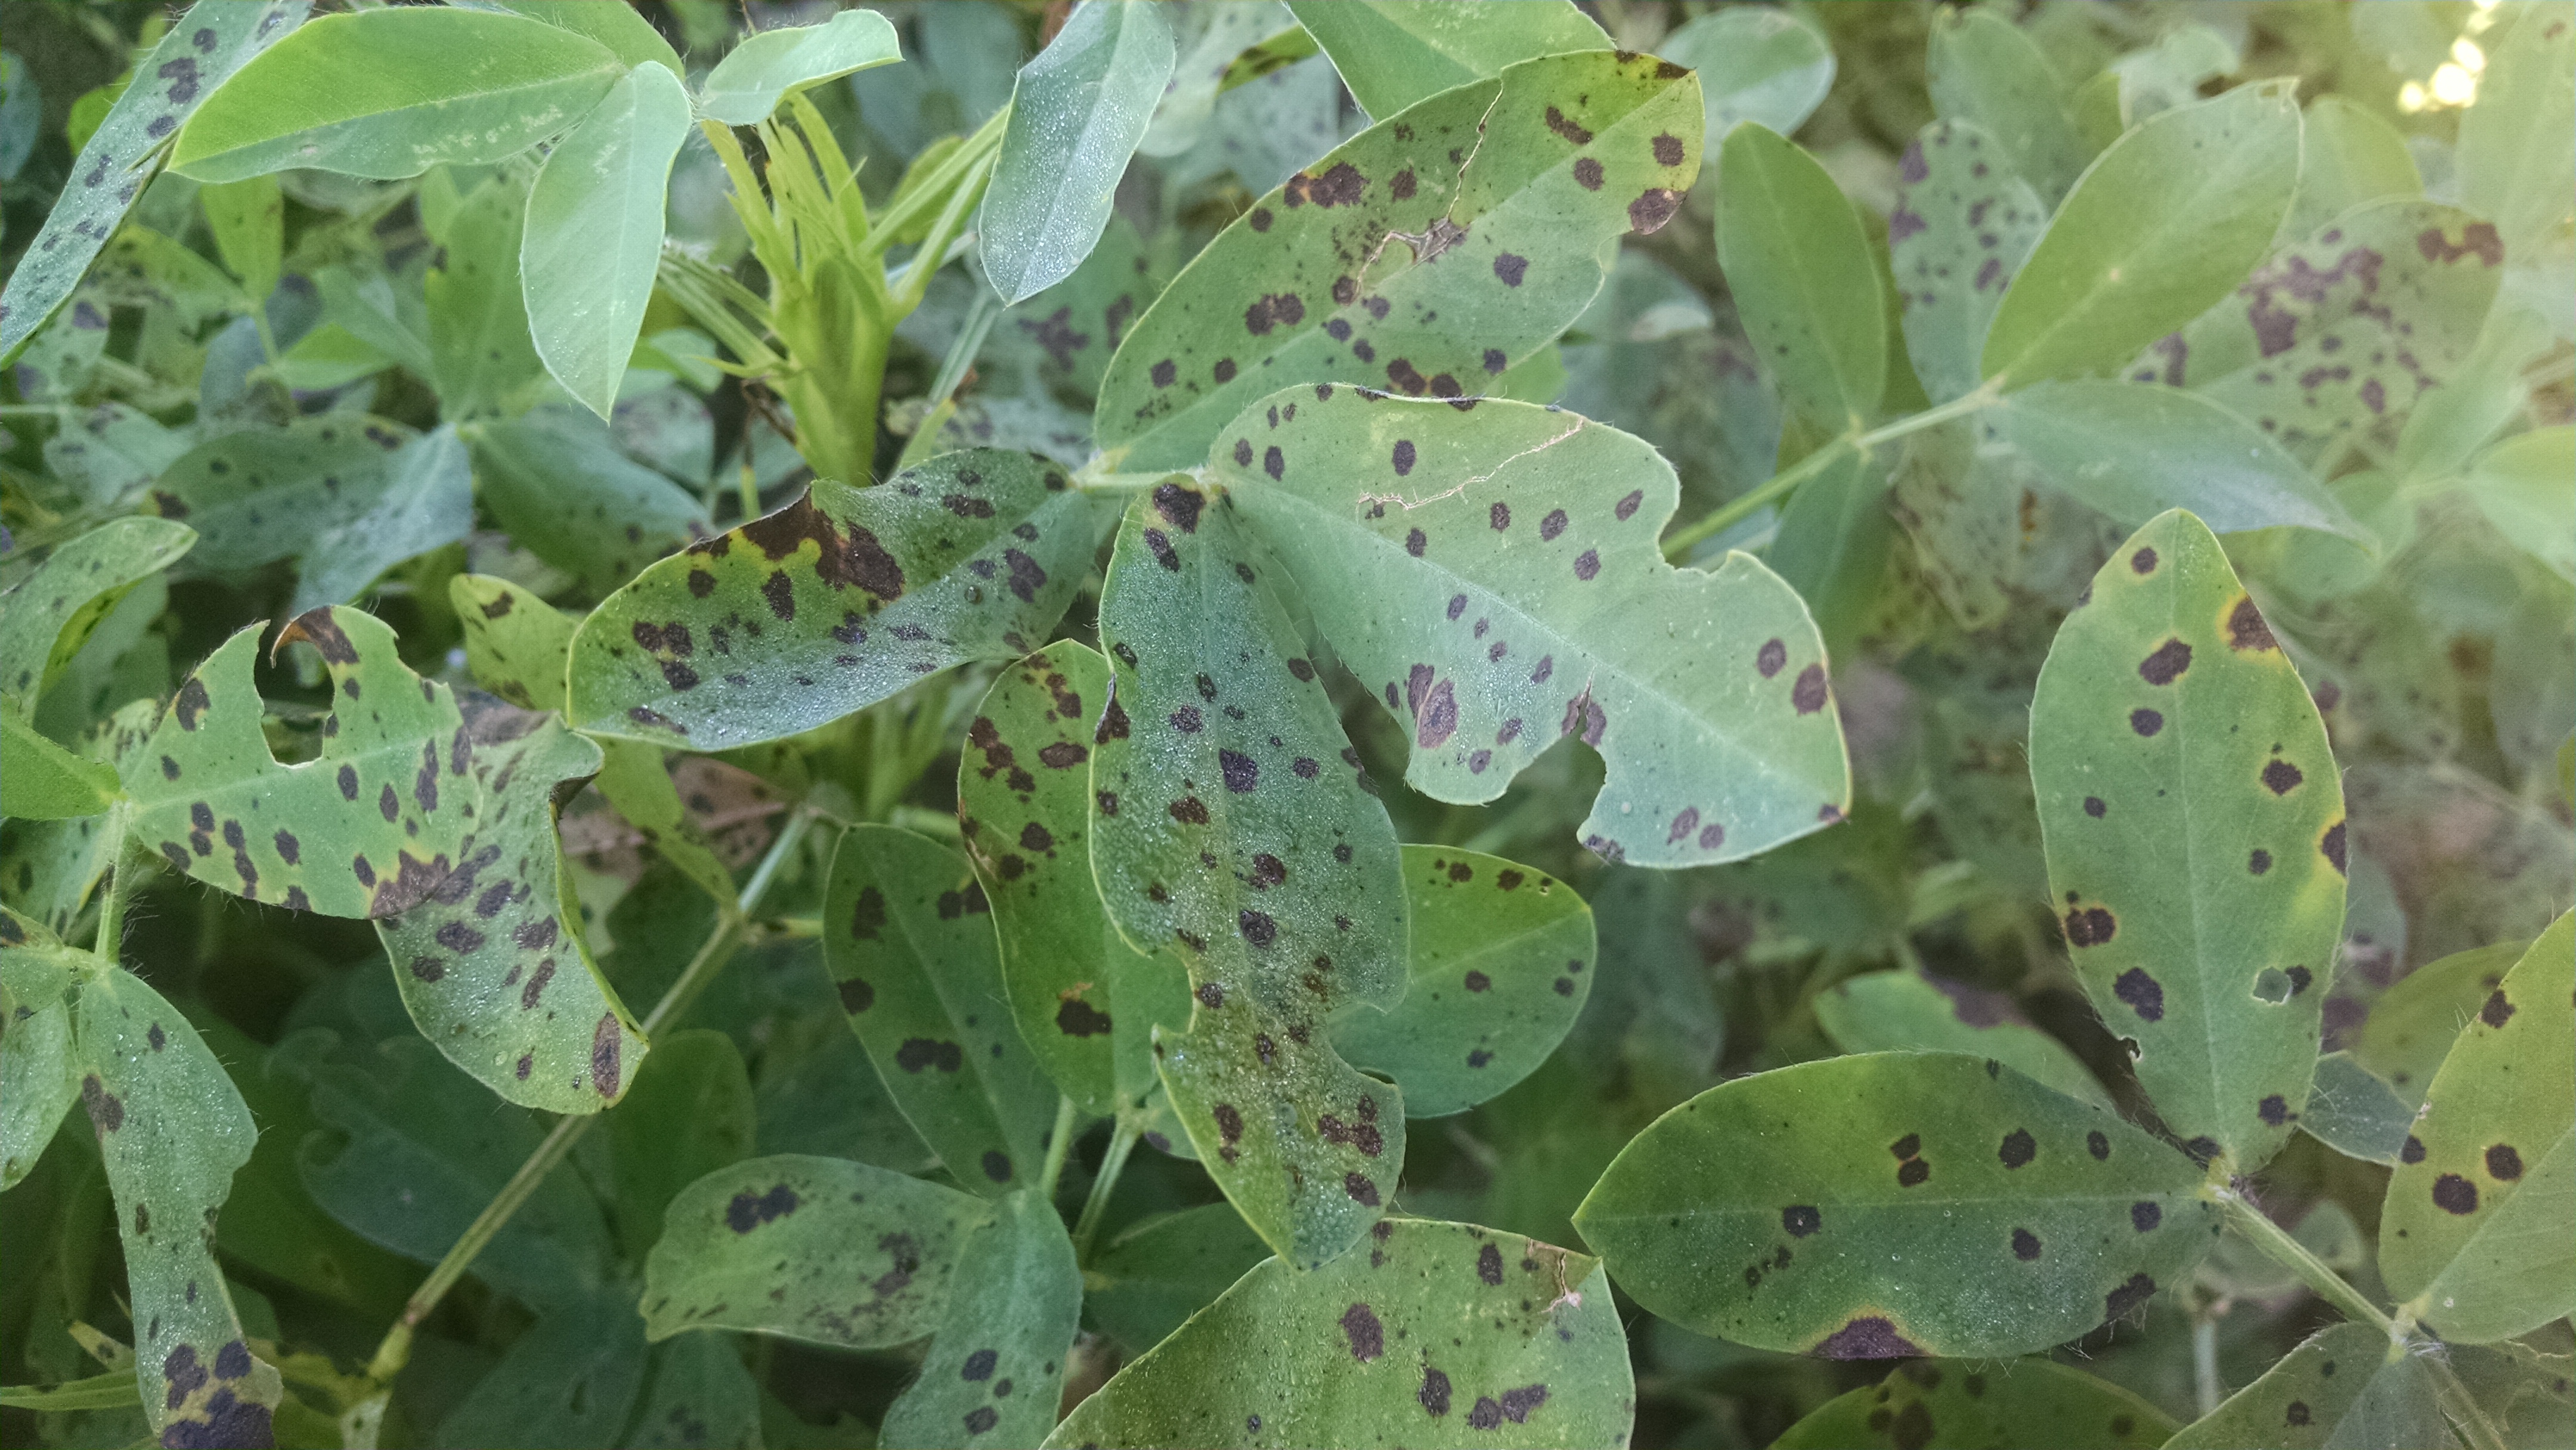
Late leaf spot on peanut. This disease produces spores on the underside of the leaves.
–
Even if leaf spot is not out of control it is a huge threat this late in the season. Keep plants protected right up until harvest so they can keep filling pods. However, one factor to consider as we get closer to harvest is the preharvest interval associated with crop protection products. Use the tools discussed above to project a target harvest time then work backwards to time your last spray so that the plants are protected and the PHI is obeyed.
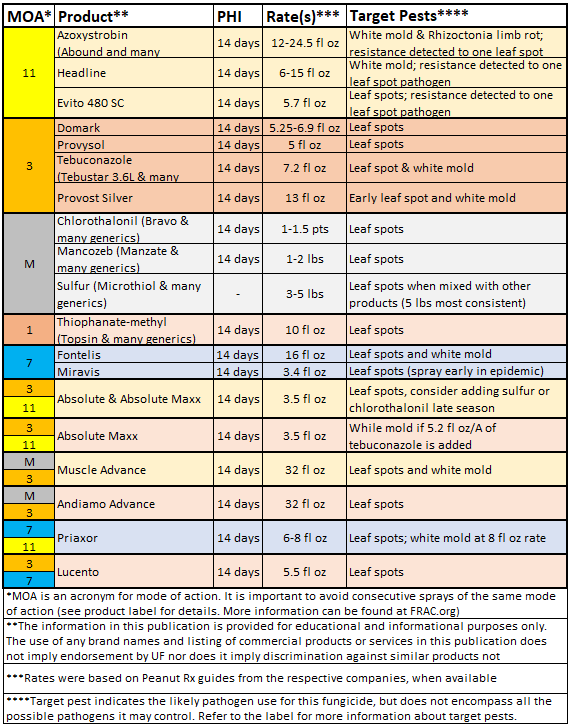
The table below provides information regarding common peanut fungicide preharvest intervals (PHI), application rates and target pests for late season disease management.

- Provisional Nitrogen Fertilization Recommendation for Florida Cotton for the 2025 Season - June 20, 2025
- NFREC-Quincy Row Crop Field Day – July 21 - June 20, 2025
- NFREC-Marianna Peanut Field Day – August 14 - June 20, 2025