
Eeusha Nafi, Sudeep Sidhu, Ted Stansly, Ian Small, Sheeja George, David Wright, Cheryl Mackowiak, UF/IFAS North Florida Research and Education Center
Libbie Johnson and Ethan Carter discussed cotton nitrogen (N) rate research in the article: May Update on the Cotton Nitrogen Rate Research Project. Current UF/IFAS N recommendations and stipulations put forth by Florida Senate Bill 712 limit the use of nitrogen for row crop production in North Florida. However, it is important to understand varietal, environmental, and site-specific differences in order to optimize fertilizer use in crop production. Nitrogen deficiency in cotton during the early to mid growing season can cause lower boll and lint production. To avoid nitrogen losses through volatilization, leaching, runoff, and/or denitrification, “spoon feeding” throughout the cotton growing season until late bloom is a common practice among cotton growers in this region. However, excessive rainfall or irrigation could cause leaching of the late season unused N especially in coarse-textured soils with low organic matter. Efficient N management, therefore, remains a challenge given the variability in soil texture, soil health, and many uncertainties related to weather patterns, all of which collectively affect the total N cycling. Combining soil characteristics with canopy reflectance measurements using handheld optical sensors and UAV-based imagery could be a potential solution to improve specific in-season N topdressing in cotton. Here we present some findings from an FDACS-funded project to look at the utility of an in-field nitrogen calibration strip (reference strip) to inform more precise, field-specific, in-season N application for optimal yield. This approach assumes that in-season cotton normalized difference vegetation index (NDVI or “greenness”) together with visual quality scores (VQS; height, branching etc.) can be directly related to mid-season N requirements. This tool is quite commonly used in other parts of the country but not prevalent in the Southeast US.
We established two on-farm locations, one each in Jackson and Madison Counties in the spring of 2022. Varieties DP-2038 and DP-1840 were planted in the Jackson County while DP-2038 was planted in the Madison County.
–
Soil Mapping
To understand variability within each field, we used the Veris MSP3 (Veris Technologies Inc.) to map the fertility gradients in the fields and zoned them into “light” and “dark” zones based on soil electrical conductivity (EC) at various depths (Figure 1). We identified only one zone in the field in the Madison County field based on EC range (0.62-0.84 mS/cm) while we identified two distinct zones, light (EC 0.4-0.6 mS/cm) and dark (EC 0.9-4.0 mS/cm) in the Jackson County field.
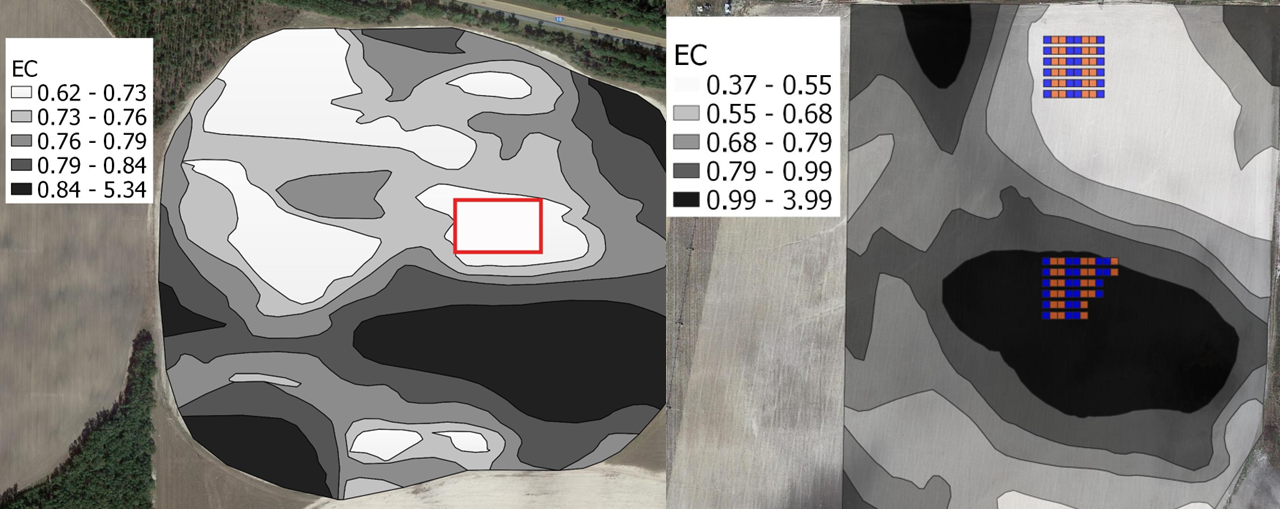
Figure 1. Maps showing the variation in soil electrical conductivity (EC) for both fields in the trial.
–
Strip Establishment
The nitrogen calibration strip (NCS) was established at plant using four N rates (60, 100, 140, and 180 lbs N/A) in the Jackson County field and six N rates (60, 90, 120, 150, 180, and 210 lbs N/A) in the Madison County field in a two-way and three-way split, respectively.
–
In-season Data Collection
In-season crop growth data were recorded every other week. We recorded in-season NDVI using a handheld multispectral canopy sensor. The VQS were based on leaf color, branching, plant height, and uniformity of the stand on a numerical scale of 1 to 5 where 1 equals no live cotton plants and 5 equals dark green leaves, tall, branched, and uniform plant stand (Figure 2).
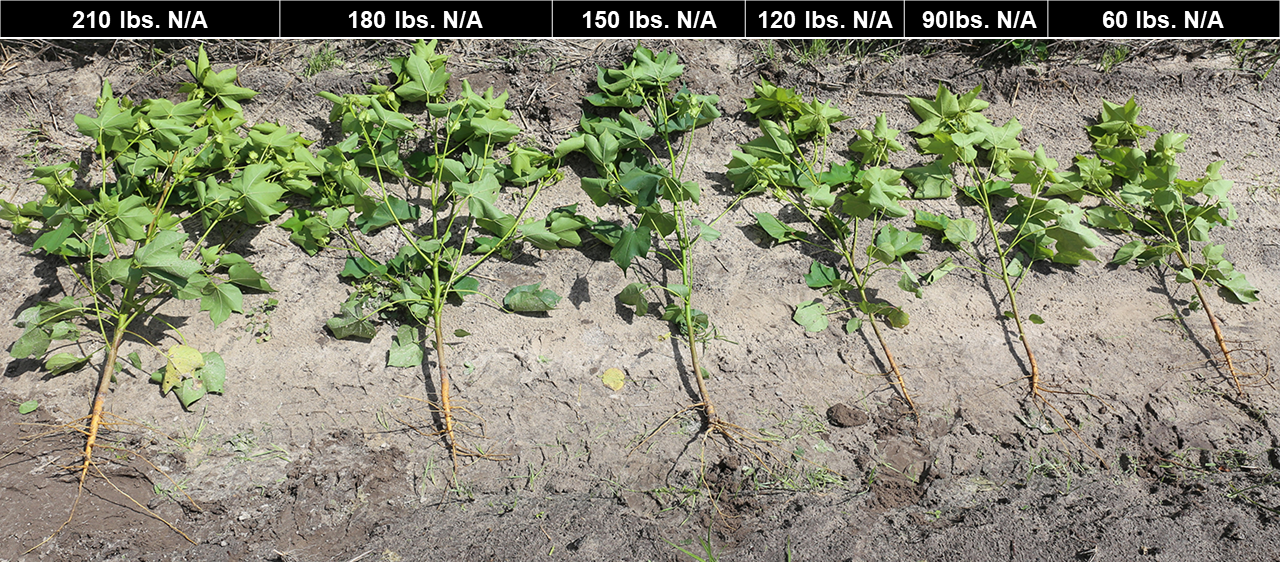
Figure 2: Early bloom cotton plant height comparison for growth scoring at various N rates between 210 to 60 to 210 lbs N/A (left to right).
–
At early bloom, based on our observations in the strip, we determined what the best N rate would be for in-season topdress. This rate is the lowest rate above which there was no difference in plant “green-ness” or the visual quality. In the Madison County field, the strip informed rate was 165 lb/A of N. In the Jackson County field, the strip informed rates for DP-1840 (both light and dark zones) was 160 lbs N/A. For DP-2038 the rate was 145 lbs N/A in dark zone, and 170 lbs N/A in light zone. We compared the NCS informed rate with farmer’s normal rate of 195 lb/A in Madison County and 165 lb/A in Jackson County. The NCS recommended N rates were then compared with the standard farm rate for crop yield.
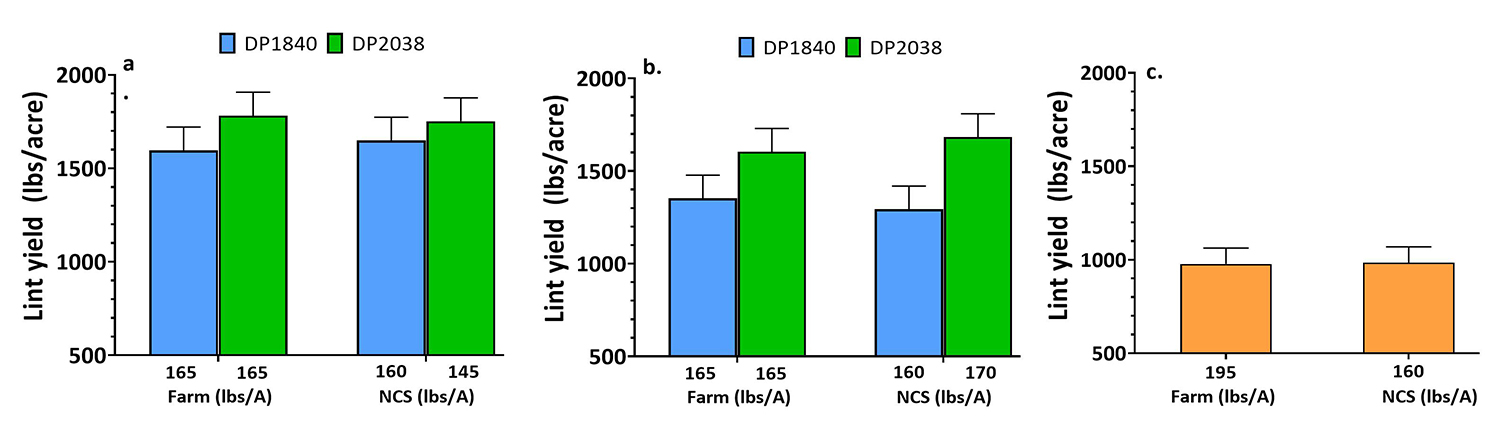
Figure 3: Cotton lint yield comparison between NCS informed N rate and farmer’s N rate in fields in Jackson County (a. for dark and b. for light zone) and Madison County (c.).
–
Yield comparison
We did not see any significant yield difference between NCS-informed N rates and farmers’ N rates in both fields. In the Jackson County field, the dark zone cotton yield was higher (1,645 lbs/A) than the light zone yield (1,324 lbs/A). DP2038 averaged 1,720 and 1,414 lbs. of lint per acre in dark and light zone, respectively. DP1840 produced 1,571 and 1,235 lbs. of lint per acre in dark and light zone, respectively, confirming varietal differences in N uptake and utilization. Cotton lint yield in the Madison County field averaged 997 lbs/A.
–
Take Home Message
- Leveraging in-field variability is an important way to optimize N use for both yield stability and environmental sustainability
- The use of calibration strip in this study showed a 15-18 percent reduction in N use without negative impact on yield
- Multi-year and multi-site NCS trial data with pre-season soil mapping, remote sensing, and dynamic crop models could improve in-season N management and cotton N use efficiency.
–
Acknowledgement: The Florida Department of Agriculture and Consumer Services provided the founding for this research.
- 2025 Cool-Season Forage Tour – February 26 - February 14, 2025
- Florida Soils are an Indispensable Natural Resource - January 10, 2025
- Regenerative Agriculture: What it Means to You - June 21, 2024