
Rainfall
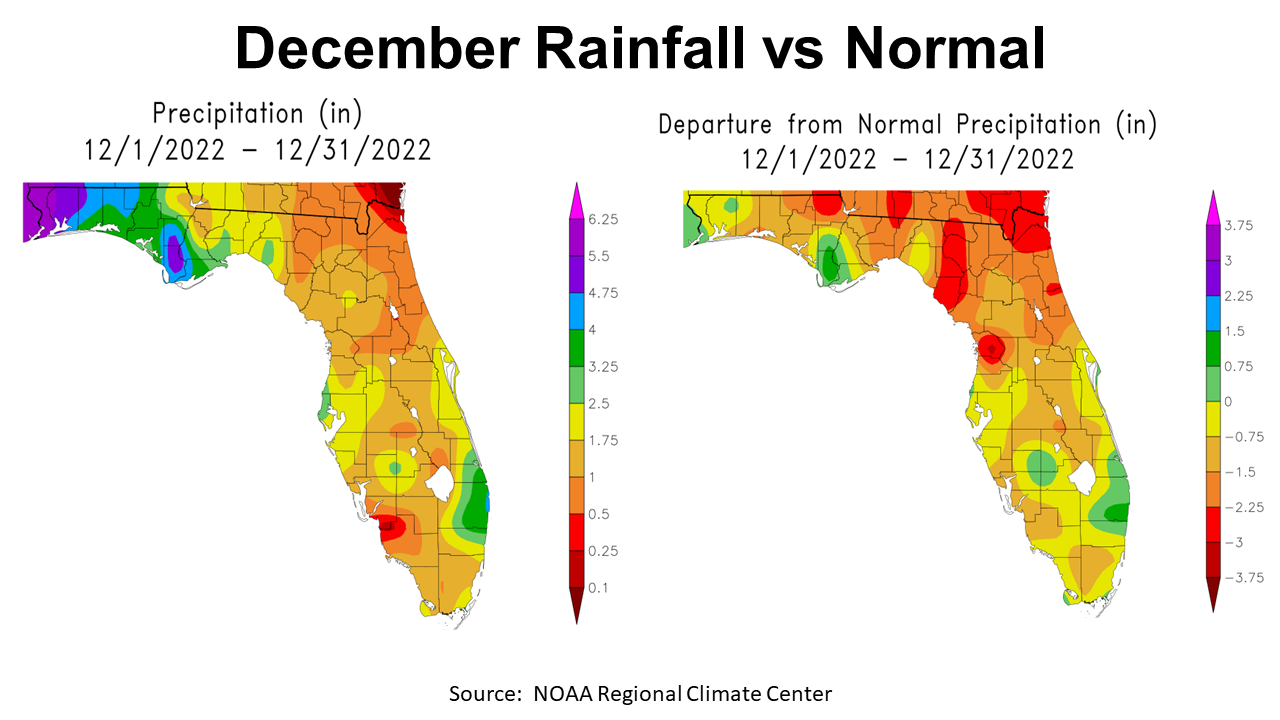
2022 was a unique weather year in the Panhandle. After several wetter than normal years, the end of 2022 got significantly drier than it has been in recent years. The map above shows the comparison of actual rainfall estimates with historic average in December. You can see in the map to the left shows that there was quite a discrepancy in estimated rainfall totals across the Panhandle in December, ranging from 4.75″ to 6.25″ (mauve and purple) in in Escambia and Santa Rosa Counties to as little 1″ to 2.5″ (tan and gold) in the Eastern Panhandle Counties. In the map to the right, you can see how December 2022 compared with historic average. Only the portions shaded in light and dark green were above average for the month. The majority of the Panhandle was -0.75″ (tan) to as much as -3″ below average (red).
–
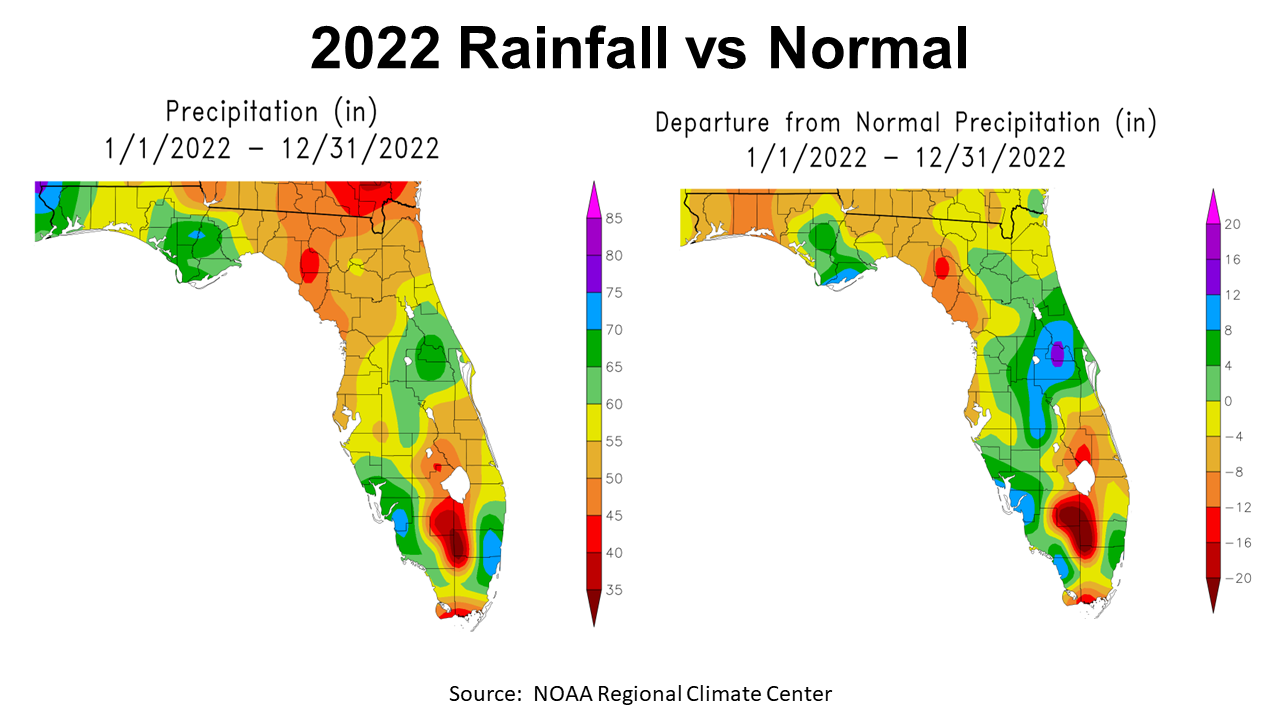
The maps above compare the rainfall for the entire year vs historic average. In the map to the left, you can see the blue portion of Escambia County that received over 70″, areas in green ranged from 60-70″, in yellow 55-60″, and tan 50-55″. The map to the right shows how 2022 rainfall compared with historic average. Only the regions shaded in green or blue were above historic average for the year. The vast majority of the Panhandle -4″ to -12″ below average for the year.
–
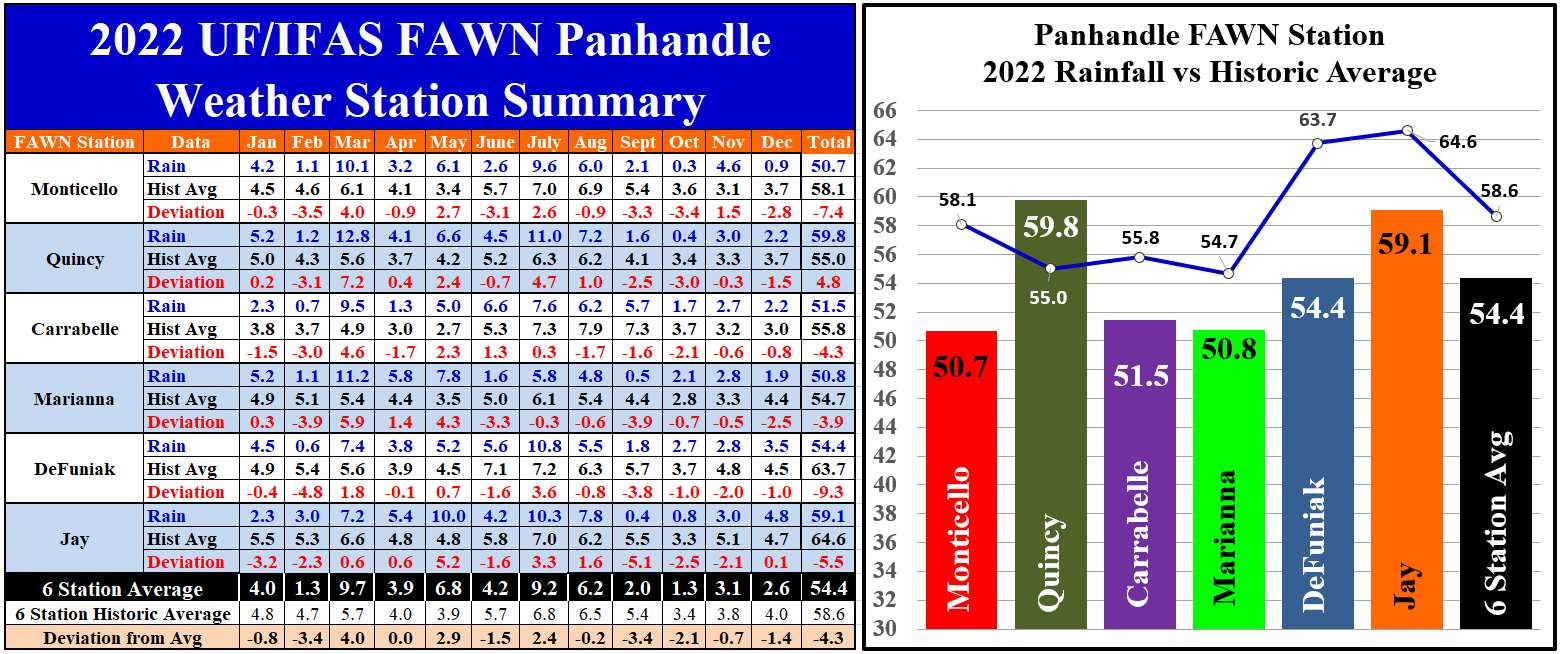
The six Florida Automated Weather Network (FAWN) stations tracked actual rainfall data in the agricultural regions of Northwest Florida. The wettest location in December was Jay with 4.8″ for the month, which was 0.1″ above average. By contrast, less than an inch, 0.9″ fell in Monticello, -2.8″ below normal. The average for all six stations was 2.6″ that was -1.4″ below normal.
For the year, the rainfall totals are not that far off from Normal. The station at Quincy was the only one with a higher than normal rainfall total, 59.8″ compared to the 55″ historic average (+4.8″) in that location. The station at Marianna only recorded 50.8″ in 2022, which was -3.9″ below historic average. The average rainfall measured at all six FAWN stations was 54.4″ for the year, which was -4.3″ below normal in 2022.
–
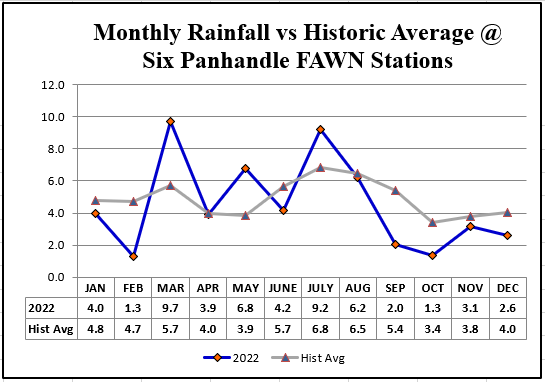
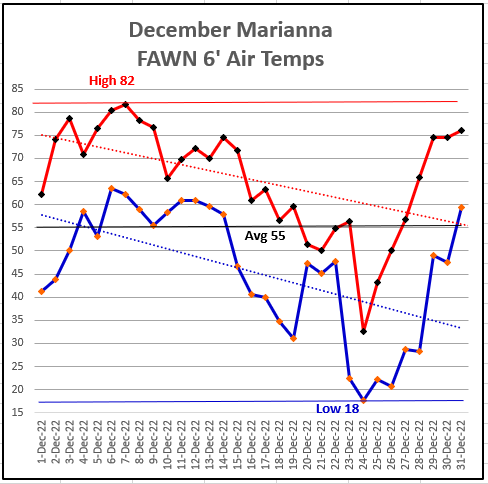
Averages never tell the whole story. 54″ does not sound that bad, but it is when the rain fell and when it didn’t. As you can see in this chart above, it really was a feast or famine weather year. There were three months with considerably higher than normal rainfall: March, May, and July. The rest of the year was below or well below average. All in all it could have been worse, and we had some of the best crop harvest weather this fall as we have seen in some time. The lack of rainfall late in the growing season hurt overall yields but farmers were able to gather all that was out there.
–
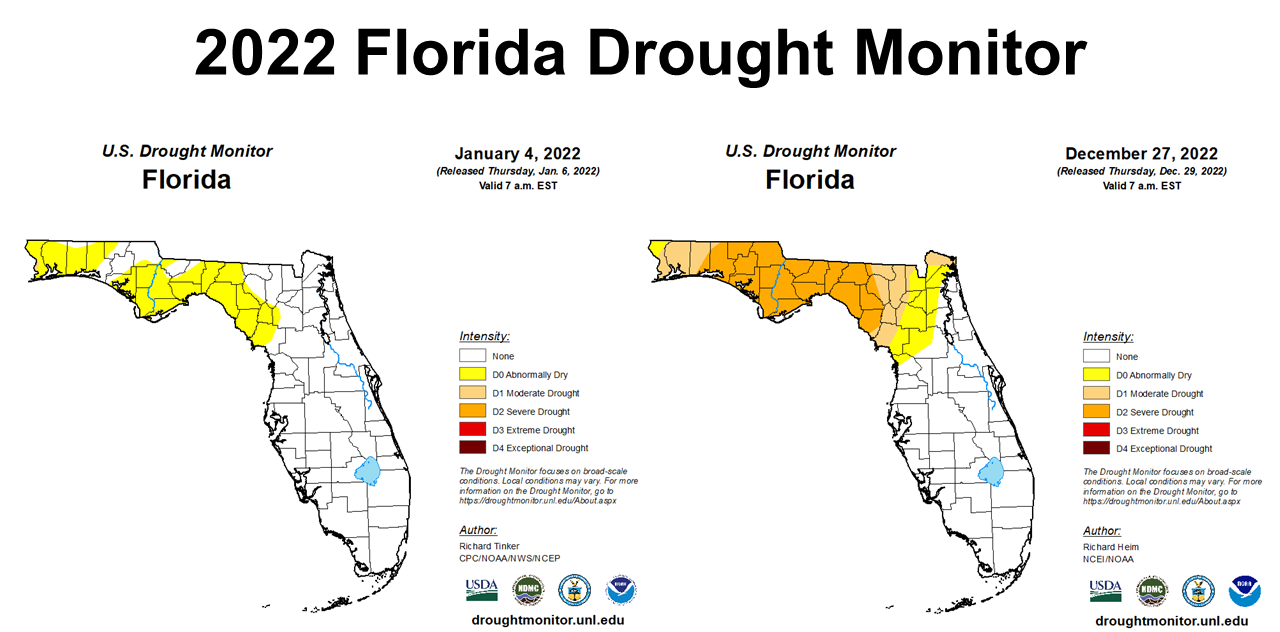
You can see in the graphic above that we started 2022 abnormally dry across most of the Panhandle. By year’s end the Panhandle Counties were classified in D1 Moderate (tan) or D2 Severe Drought (gold). There were a number of weeks in April, July, August, and early September when the region was not included in drought monitor, so don’t get the wrong idea that the Panhandle was in drought for the entire year.
–
 Temperatures
The month of December started much warmer than average but really got cold around Christmas. The high for the month was 82° on December 7, but fell to 18° on December 24. Christmas Eve was a strange day for this region as it never got above freezing. This hard freeze did not set any records for cold (Tallahassee 13° 12/24/89, or 14° 12/25/83), but it was much colder than it has been in 20 years. I have heard that there were lines of people in hardware and home improvement stores who needed to repair PVC pipe on the day after Christmas this year. Many folks had forgotten what three days of cold weather could do to unprotected pipes.
–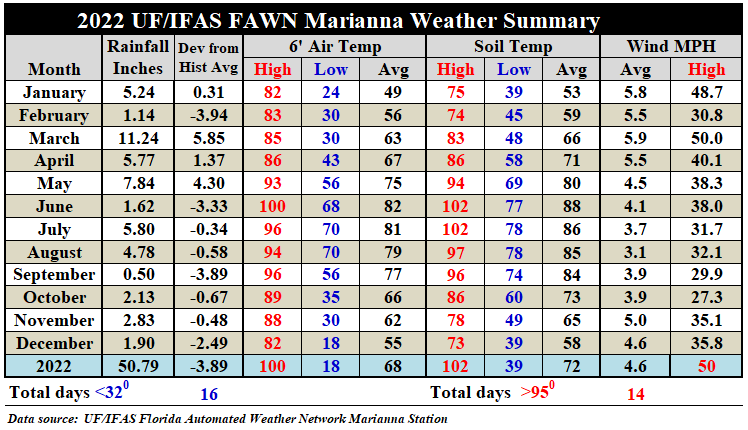
The average six foot air temperature was 55° in December, which was seven degrees cooler than the 62° average in November. The soil also cooled 7° from an average of 65° in November to 58° in December. If you would like to see the daily weather records from the Marianna FAWN Station, or the monthly rainfall records for all six FAWN stations, use the following link:
2022 Jackson Co Weather Summary
–
For the year, we saw quite a range in temperatures in 2022 from an official high of 100° at six feet in June to a low of 18° in December. The average for the year was 68°, which was only slightly higher in Marianna than average.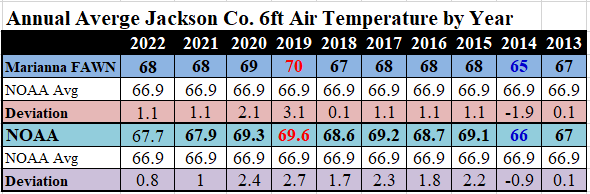
The average temperature the last ten years has increased somewhat, but not as much as in other areas. The county average temperature was only below normal in 2014, but has not increased again since 2019.
–
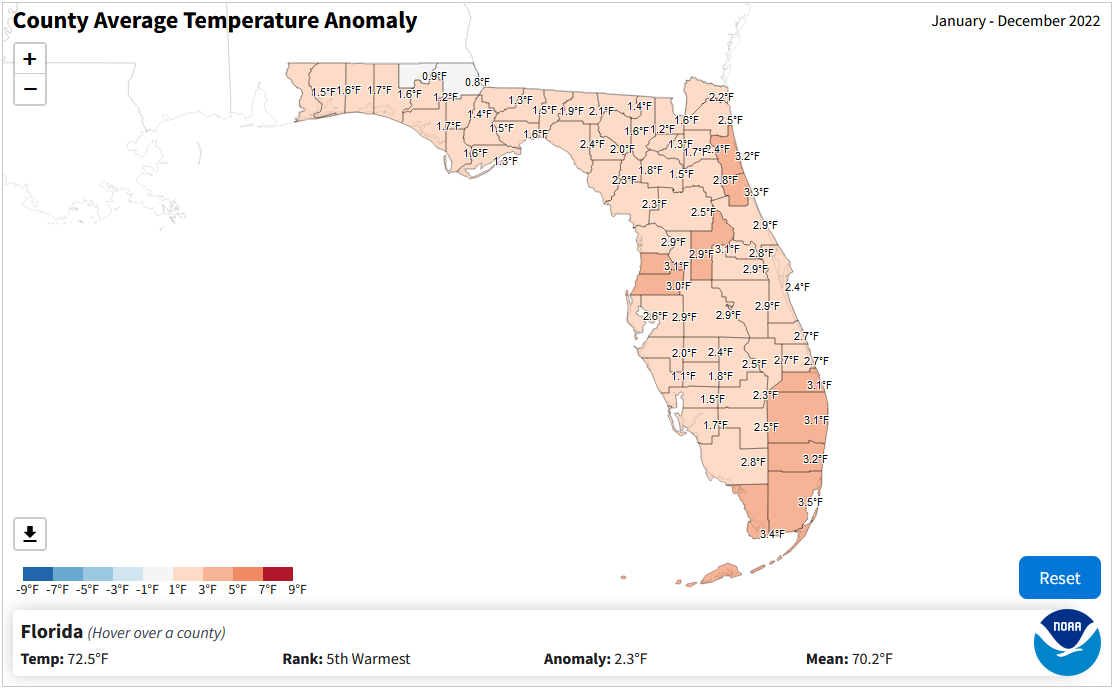
As you can see in the map above, however, Jackson and Holmes County were the only two in Florida that were within one degree of historic annual average temperature. The entire state of Florida was 2.3° warmer than average in 2022. Was this climate change, La Niña, or just the cycle of weather? The general trend is that temperatures are generally increasing as compared to the mean from the previous century.
–
Climate Outlook
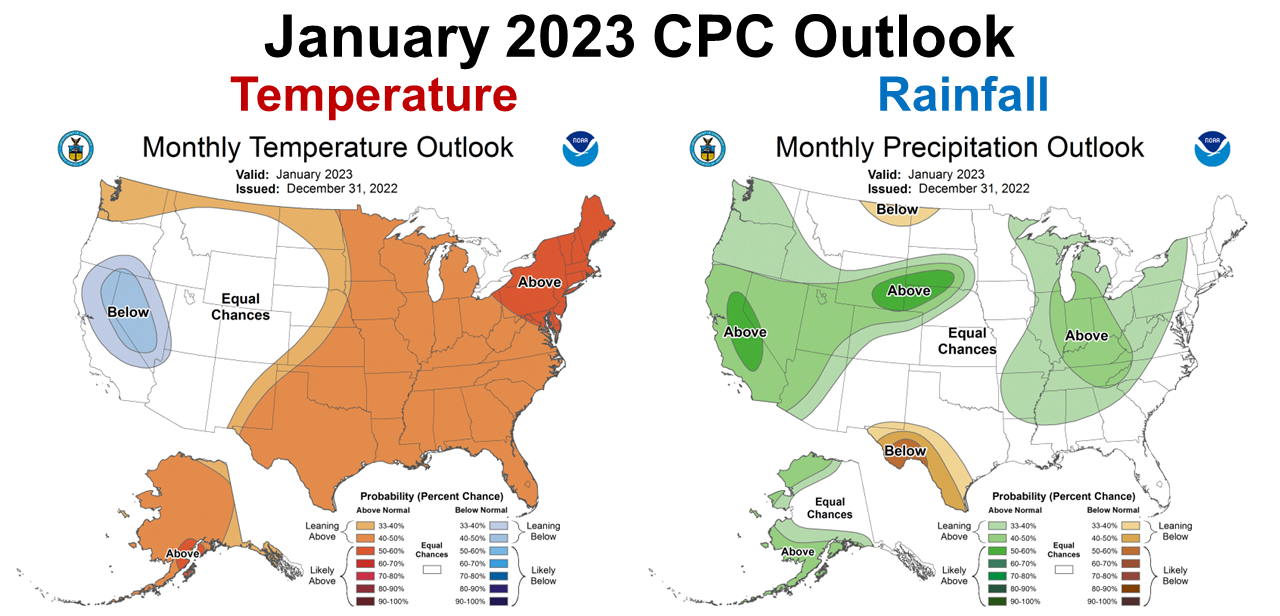
La Niña is still affecting the climate this winter. The January Outlook provided by the Climate Predication Center (CPC) above shows they expect the warmer than normal trend to continue this month. Just as in December this outlook does not mean there will not be other weather factors that bring short-term cold weather, but for the whole month they expect it to be warmer than normal across the eastern half of the US. When this forecast map was generated on December 31, the CPC made no predictions for rainfall in our area.
–
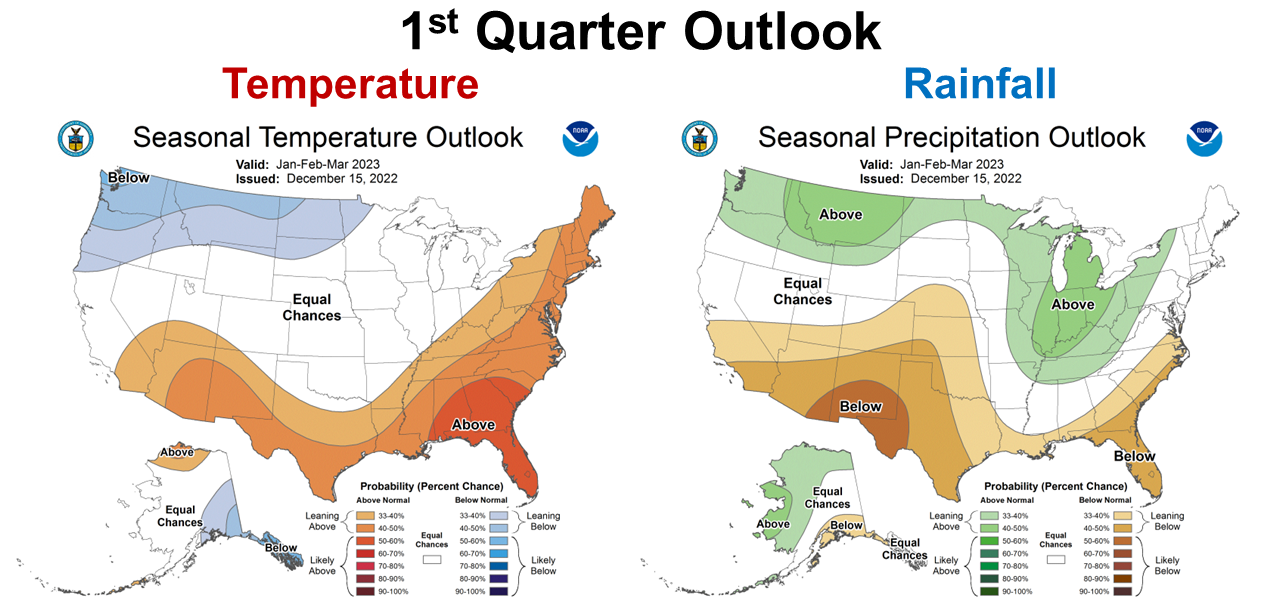 The longer term, three-month outlook map that was generated on December 15, shows even greater chances of above average temperatures and below average rainfall. This is primarily based on the La Niña ENSO phase.
–
 The CPC is expecting drought conditions to improve over the next three months, but not completely for most of the Panhandle. They are expecting Drought Removal for the western counties in the Panhandle.
–
La Niña Advisory
The experts believe that the current La Niña will break up this spring. There is a growing possibility we could have an El Niño this coming fall and winter.
During December, below-average sea surface temperatures (SSTs) weakened over the equatorial Pacific Ocean. However, the atmospheric circulation anomalies over the tropical Pacific Ocean did not notably weaken. Overall, the coupled ocean-atmosphere system continued to reflect La Niña. The most recent IRI plume predicts that La Niña will transition to ENSO-neutral during the Northern Hemisphere winter 2022-23. At this time, the forecaster consensus favors a transition to ENSO-neutral in the February-April 2023 season. By Northern Hemisphere spring (March-May 2023), the chance for ENSO-neutral is 82%. Climate predication Center
–
The latest ENSO outlook from NOAA’s Climate Prediction Center was released this week. They are now predicting that the current lengthy La Niña is likely to end by early spring and move through a neutral period in late spring and early summer before transitioning to El Niño later in summer and into fall. While ENSO predictions this time of year are less reliable than predictions in summer or fall, it is not unexpected. Something to keep in mind if this transition occurs as predicted–years with a rapid swing from La Niña to El Niño are often years in which a summer drought develops because the warm and dry winter conditions associated with La Niña leave limited reserves of soil moisture for the next growing season. So this is something I will be watching for this coming growing season. Pam Knox, Director of the UGA Weather Network and Agricultural Climatologist
–
What does this mean for farmers and ranchers in the Panhandle?
The general trend of a warm and dry winter continued through the end of 2022. We started 2023 in a serious deficit. The experts believe the this same general trend will continue through the 1st quarter and then transition to Neutral this spring. There is hope for the future, but it will take a while to restore lost soil moisture. The early spring crops, such as melons, vegetables, and corn will likely require irrigation to have a successful start. The later planted crops, such as peanuts and cotton should have more normal rainfall at planting time, but it is hard to predict at this point. It does appear the irrigated ground will continue to have a production advantage at planting time. Hopefully by the time the crop and forage season is in full swing the climate will be back to neutral and more normal. Once again I remind you, when it comes to planting crops and forages on dryland or rain-fed fields, “If it is dry as a bone, postpone!” There is hope for 2023 that conditions will improve. 2023 will likely start off dry but improve over time. There is a possibility of a cooler and wetter fall and winter next year, if the Pacific Ocean warms enough for an El Niño.

demayo@ufl.edu - 850-482-9620
Follow me on Twitter
@UFCowman
- Making the Most of High Cattle Prices – Grow More of Your Own Feed - July 18, 2025
- Friday Feature:1960 Corn Farmer - July 18, 2025
- June 2025 Weather Summary and Three-Month Outlook - July 11, 2025