
Inventory
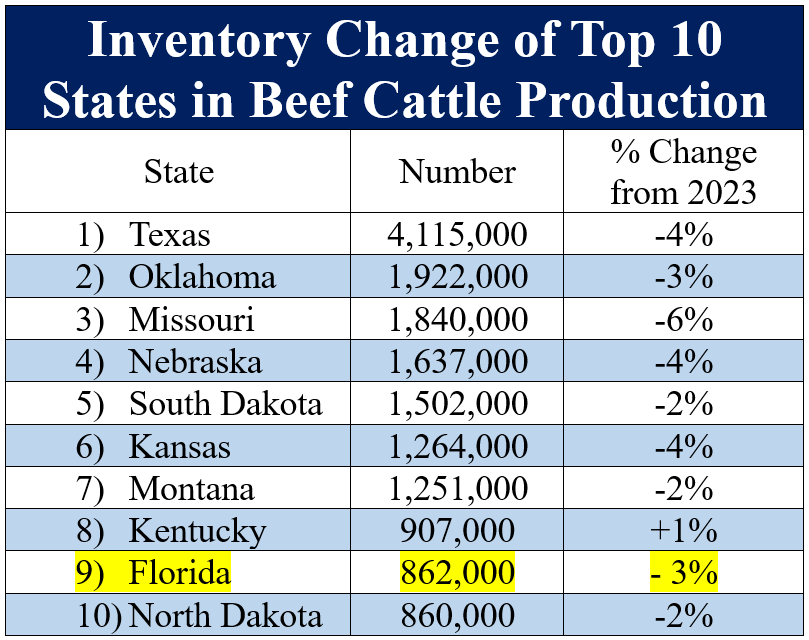
Florida still ranks number 9 in beef cattle production with 862,000 head, a decline of 3 percent since 2023. The top ten states in beef cattle production all declined between 2 and 6 percent with the exception of Kentucky, which increased production by 1 percent. The national beef cow herd has declined by almost 11 percent since the last peak in 2019 and by 2 percent since 2023. It is the smallest beef cow herd since 1961. The number of heifers intended for beef cow replacement declined by 1 percent, and the number of heifers expected to calve in 2024 declined by 2 percent. Other heifers (heifers intended to be sold as feeder heifers) also declined by 2 percent. The 2023 calf crop totaled 33.5 million head; 2 percent lower than 2022. Cattle on feed increased by 2 percent. The declining number of female cattle in the beef herd and the increase in cattle on feed creates an open ended question: Is the beef cow herd still declining or will we see stabilization in the last half of 2024?
 –
–
 –
–
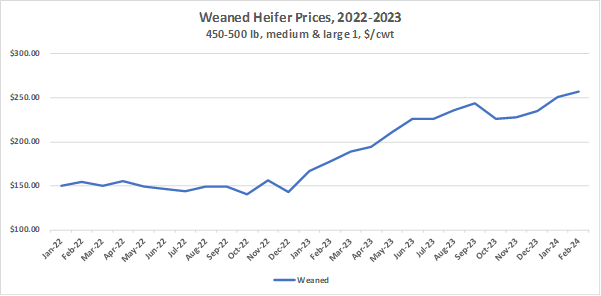
Steer Prices
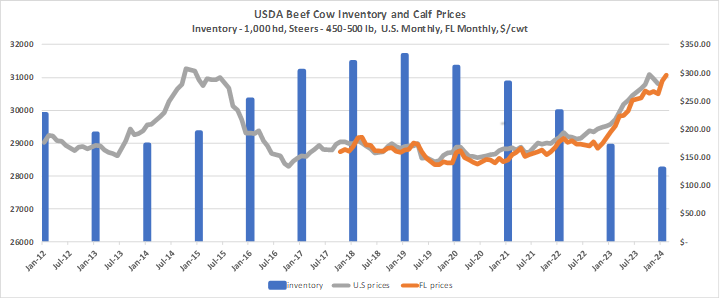
We have been comparing 2023 and 2024 to 2014 and 2015 in terms of prices. But let’s take a closer look. Prices for 450-500-pound steers in Florida peaked in 2015 when the beef cow herd was already well into expansion and rebuilding. We can see that the inventory levels in 2014 and 2015 look much different than the inventory level going into 2024 from 2023. The beef cow herd has declined even more than expected, meaning expansion has not started. What does this mean in terms of prices? If we are already seeing similar prices that we saw in 2015 when prices peaked and expansion had started, we can only assume that prices for feeder cattle will continue to rise and we may not see a peak until 2025. The January 2024 Cattle Inventory Report revealed that the beef cow herd has declined and could still be declining due to circumstances such as high interest and rental rates and pasture conditions. Forage production and the beef cow herd must first stabilize before we start thinking about rebuilding.
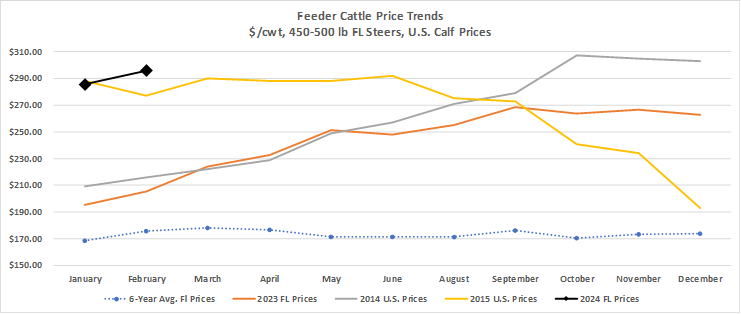
Average prices for 450-500-pound steers in Florida are 46 percent higher than they were in January of 2023 and 69.6 percent higher than the 6-year historical average. So far in February, prices are trending higher than the peak prices seen in 2015. Due to seasonality, prices tend to be higher in the spring since the majority of spring-born calves are sold in the fall. However, with prices expected to remain favorable for the next couple of years, we may not see this seasonality trend be quite as strong in 2024. Prices may still level-off in the fall for a period with the increase in number of calves being sold, but prices could still be higher in the fall than what we are seeing now (see 2023 line on graph below).
 –
–
Heifers
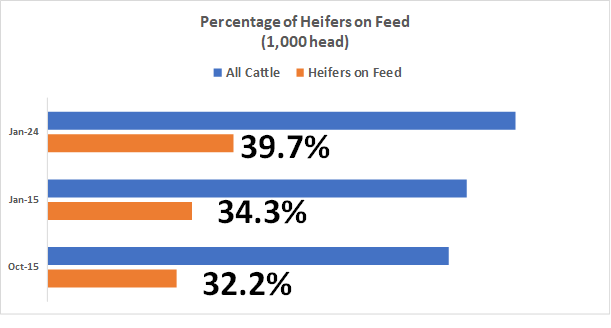
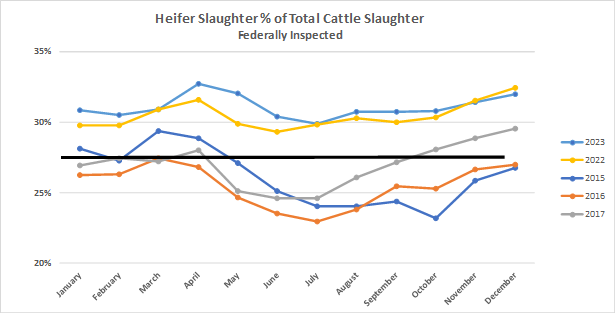
The number of heifers intended for replacement in Florida totals 115,000 head, a decline of 4 percent since 2023. The number of feeder heifers has increased by 25 percent since 2023, meaning the majority of heifers born in the fall of 2023 are being sold into the feedlot rather than being retained. As of the last quarterly Cattle On Feed Report in January 2024, almost 40 percent of all cattle being fed are heifers. For reference, during the last expansion, this number ranged from 32-34 percent. On average, 31 percent of all cattle slaughter in 2023 were heifers. During the last expansion period, this average ranged from 25- 27 percent.
The decline in replacement heifers, increase in heifers on feed, and increase in heifer slaughter indicate that the majority of Florida producers and producers nationwide have not started rebuilding through heifer retention. Average prices for 450-500-pound weaned heifers in Florida are 50 percent higher than January 2023 and are trending higher. As of February 2, 2024, weaned heifers are selling for an average of $256.71/cwt.
 –
–
 –
–
 –
–
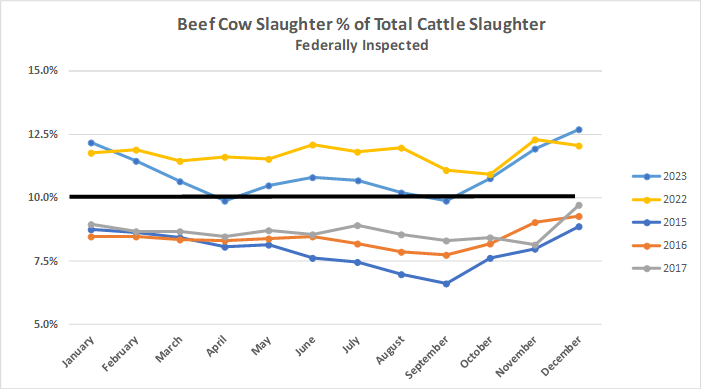
Cull Cows
Total female slaughter averaged at 51.7 percent in 2023. Beef cow slaughter, also known as the culling rate, was 11 percent on average in 2023. This is a slight decline from the 2022 culling rate (11.7 percent) as a result of fewer cows in production from several years of liquidation, not because of retention and rebuilding. During the last expansion, the beef cow culling rate was roughly 8 percent. As of January 2024, prices for average dressed boner cattle (BCS 5-7) in Florida were 30.8 percent higher year-over-year. With the value of female cattle rising as producers begin looking to rebuild, improving the body condition score of cull cattle before selling could be a potential way to take advantage of higher prices by selling those cows as healthy, seasoned replacement cows rather than culls.
With more female cattle being sent to packing plants, beef supply increased for a short period. However, a reduction of female cattle in production will result in a decline in long-term beef production. To estimate future feeder supplies outside of the feedlot, data from the January 2024 Inventory Report is used in the following calculation: ((other heifers + steers >500lbs + calves < 500lbs) – all cattle on feed)). The current supply of feeder cattle is estimated to be 24.2 million head, down 4.2 percent from last year. Per historical data, this is the lowest supply of feeder cattle in 53 years. As a result, it is projected that beef production will decline by roughly 5 percent in 2024.
 –
–
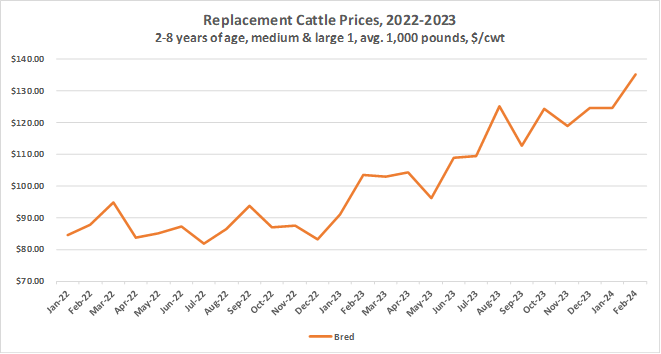
Replacement Cattle
Supply of female cattle in production, both cows and heifers, is currently limited. Several years of liquidation have caused prices of replacement cattle to rise. Prices for young, bred replacement females are 30.7 percent higher year-over-year and 54 percent higher than 2022, as of February 2, 2024. Prices for cow-calf pairs are roughly 21 percent higher than 2023 (prices will vary based on cow weight, gestational stage, and calf weight). Expansion has not begun, so it can be assumed that prices for replacement cattle will only climb higher over the next couple of years.
 –
–
Hay Stocks
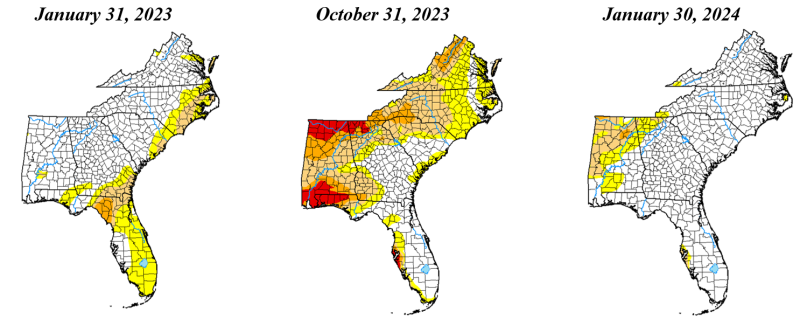
The January 2024 USDA Crop Production Report shows that, as of December 1, 2023, total hay stocks (hay on farm) increased by 6.9 percent in the United States since 2022. Total hay production (excluding alfalfa) in the U.S. has increased by 9.5 percent since 2022, but is still 1.5 percent lower than in 2021. This is to be expected because of how the prolonged drought impacted the country. The current drought monitor indicates that only 10.8 percent of the country is experiencing severe/extreme drought conditions, with the remaining 89 percent experiencing no drought or moderately dry conditions. This is a significant improvement compared to when 21.4 percent of the country experienced severe/extreme drought conditions in 2023, and 36.4 percent in 2022.
More specifically, in the 11 Southeastern states (excluding OK and TX), there is a different story. Hay production increased by roughly 4 percent, but hay stocks decreased by 1.1 percent. This indicates that hay was being fed sooner as a result of drought and limited forage for cattle. In Florida, hay production (including alfalfa) increased to record levels at 806 tons in 2023, 7.4 percent higher year over year. Florida was one of five states in this 11-state region to have an increase in hay stocks (4.4 percent), as of December 1, 2023. States such as AL, MS, and LA saw decreases in hay stocks ranging from 8-15 percent as well as decreases in production.
All in all, even though hay production in Florida is favorable compared to last year, the overall standing of hay production and hay stocks in the Southeast will play a significant role in how fast herd expansion will occur in the Southeast region.
 –
–
Input Costs by Category
Production Costs
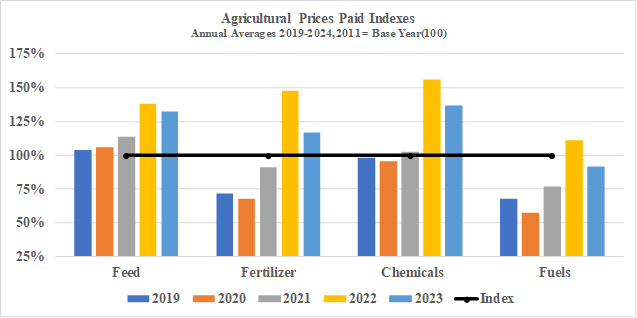
The graph below shows the percentage change in production costs according to the prices paid by farmers index. The base year is 2011 (2011=100%). The prices paid index is simply a measurement of price change over time. For example, the average price index for feed in 2022 was 138.3, meaning feed prices have increased by 38.3 percent since 2011. The average price index for feed in 2023 was 132.5, meaning feed prices decreased by 4 percent since 2022 ((current year index – previous year index) / previous year index). Feed prices are still 27.4 percent higher than in 2019, but it is projected that prices will continue declining.
The cost of fertilizer, chemicals, and fuel have all followed the same trend of being less than 2022 but more than five years ago in 2019. The cost of nitrogen has decreased by 36.9 percent since 2022, and diesel by 15.7 percent.
 –
–
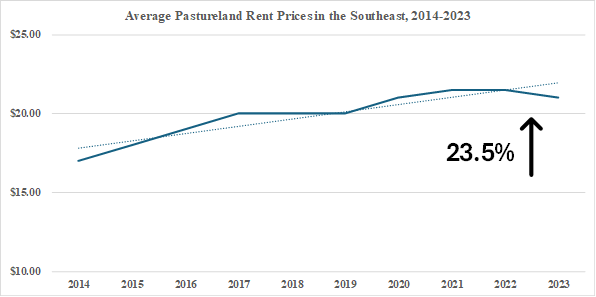
Rental Rates
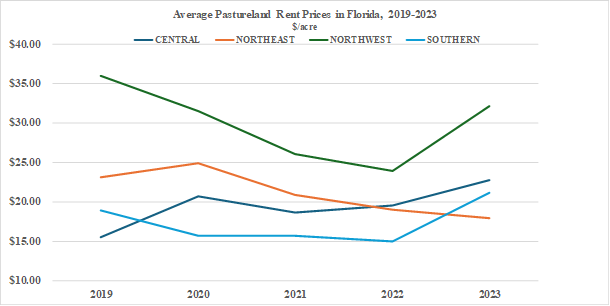
Average rental rates for pastureland in Florida have increased since 2022 with the exception of the Northeast region (this could be a result of missing data from counties). The graph below presents the average rental rates per acre in each region from 2019-2023. The predicted decline in production costs in the next few years will potentially help to offset the increase in rental rates. Pastureland rental rates in the Southeast region have followed the same trend, increasing by 23.5 percent since 2014.
 –
–
 –
–
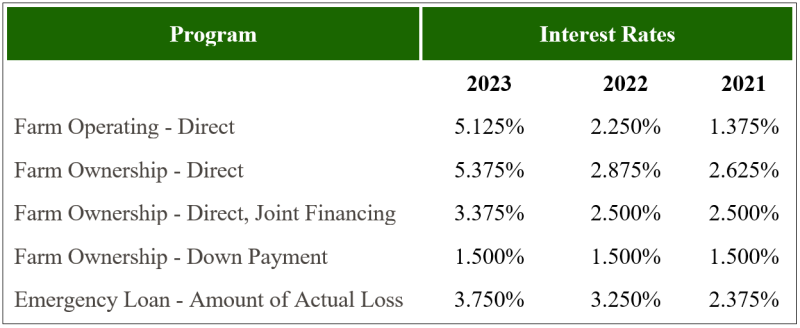
Interest Rates
The table below shows the increase in interest rates for farm operating and ownership loans since 2021, according to the USDA-Farm Service Agency Loan Programs. Interest rates for farm operating loans have more than doubled since 2022 and have more than tripled since 2021. Ownership loans have increased by 87 percent since 2022, and have doubled since 2021.
 –
–
*All data is sourced from the USDA- NASS, FSA, & AMS
For questions, contact Hannah at h.baker@ufl.edu
See this update and other helpful resources online at https://rcrec-ona.ifas.ufl.edu/about/directory/staff/hannah-baker/
(863) 374-7051
- The Value of Reproductive Efficiency when Rebuilding Your Cattle Herd - June 20, 2025
- May 2025 Florida Cattle Market Update – Livestock Slaughter & Beef Production - June 6, 2025
- April 2025 Florida Cattle Market Update - May 2, 2025