
Every five years, USDA’s National Agricultural Statistic Service (NASS) surveys farms for the Census of Agriculture. The most recent survey was conducted after the conclusion of the 2022 season, in early 2023. Farmers from across the U.S. completed detailed questionnaires that provide the best statistical information available about the U.S. Agricultural Industry. State and county data from the 2022 US Census of Agriculture was released in February 2024.
–
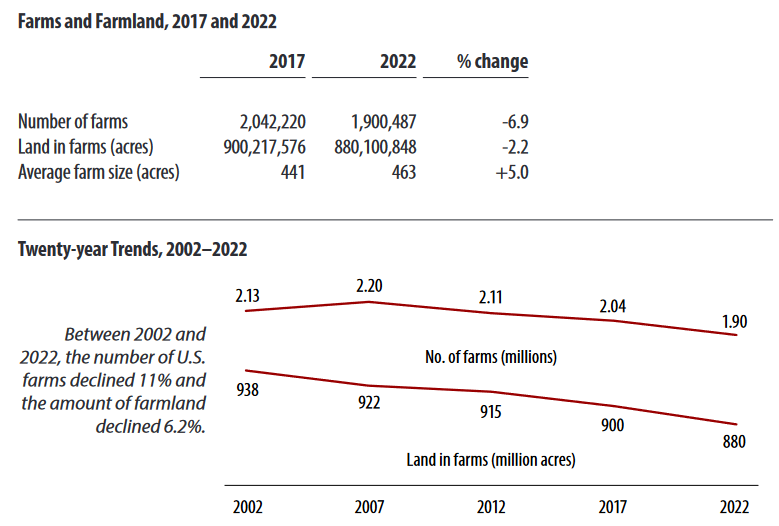
Source: 2022 Census of Agriculture
U.S. Farm Facts
When you compare the data from 2022 (top chart) with the last Census of Agriculture in 2017, there was a 6% decline in the total number of farms in the U.S., from just over 2 million farms in 2017 down to 1.9 million in 2022. U.S. total farm acreage declined 2.2%, with a loss of over 20 million acres in five years. Interestingly the average farm size rose 5%, from 441 acres to 463 acres, which is an indication of farm consolidation.
The bottom graph above compares the number of farms and farm acres over the past 20 years, from the last four census of agriculture reports. The number of farms has declined 11%, and the farm acreage has declined 6.2%. From this data we can see that consolidation played a role in reducing the number of farms by 230,000, but there was also a loss of 58 million acres of farmland in the U.S.
–
U.S. Farmers
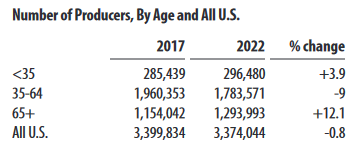 The Census of Agriculture also provides data on the numbers of producers (decision makers) or farmers on U.S. farms. There were 25 thousand fewer producers (farmers/ranchers) in 2022, which was a little less than 1% fewer than 2017. The U.S. population on January 1, 2023 was 334 million, so about 1% of the U.S. population were producers (farmers or ranchers).
Interestingly, there were 3.9% more producers under 35 years old, but the big jump was the number of farmers over 65, which increased over 12%. However, there were 9% fewer farmers in the 35-64 age range. While it is encouraging to see the boost of young farmers, it is concerning that so many farms are being managed by people 65 years old or older. The average age of all U.S. farm producers in 2022 was 58.1 years, up 0.6 years from 2017, continuing a long-term trend of aging in the U.S. producer population. U.S. farmers are not only older but also very experienced, having farmed for an average of 23.4 years.
–
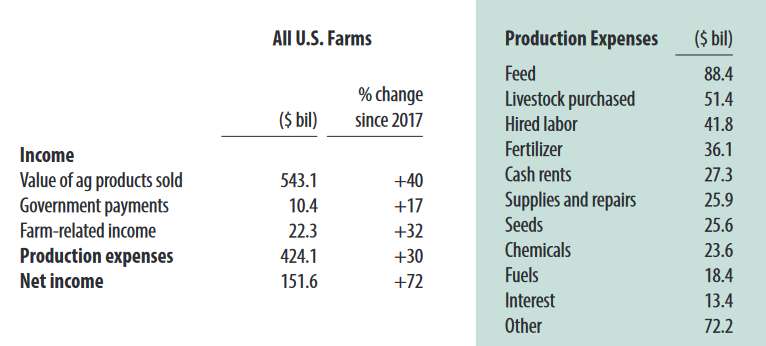
At the end of 2022, Post-COVID19 inflation was starting to really ramp up. The chart above shares income and expenses from U.S. farms in 2022. The 1.9 million U.S. farms sold $543 billion of ag products in 2022, with expenses of 424 billion dollars, so there was a net income of almost $152 billion. There was a 40% increase in income from the sale of ag products, with a 30% increase in farm expenses. The government payments were provided by 2018 Farm Bill programs, and the farm related income was from services farmers provided such as custom work, services, or agritourism.
–
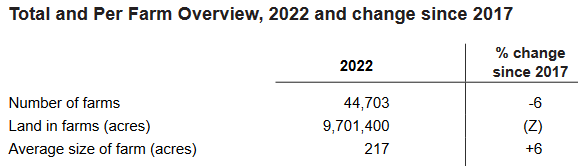
Florida Farm Facts
In 2022, there were 44,703 farms in Florida, which was down 6% from the 2017 Census of Agriculture. Farmland reduced by only 0.3% or 30,331 acres, as compared to 2017. Average farm size actually increased 6%, from 204 acres in 2017, to 217 in 2022. Consolidation of farms was not as dramatic in Florida as it was nationwide, but it was still a factor in the state.
–
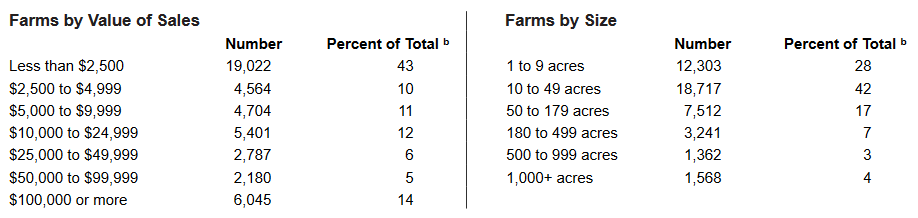
USDA Considers a farm a business with $1,000 or more in annual sales. The chart above shows the breakdown of farms in terms of sales and acres. 70% of of Florida farms in 2022 were less than 50 acres. 42% were between 10 and 49 acres. Similarly, 43% of Florida farms had sales of less than $2,500. There were also 6,045 farms with sales over $100,000, and 2,930 farms that farmed more than 500 acres in Florida in 2022.
–
$10.2 Billion in Farm Sales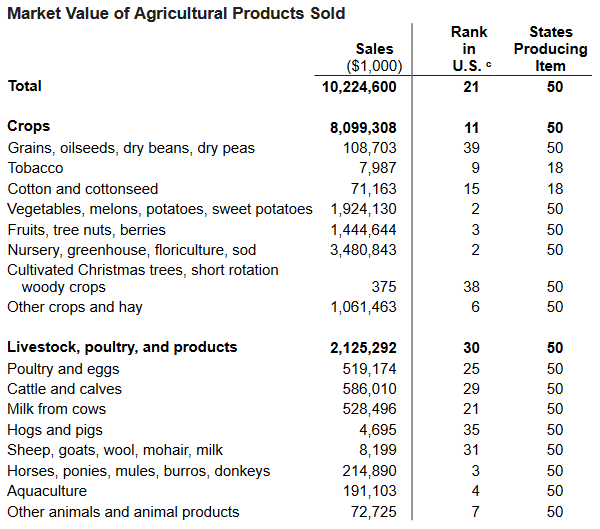
In total, Florida produced $10.2 billion in agricultural product sales in 2022, which ranked 21st nationally. When you break down Florida’s farm sales by category, you can also see how the state ranked in the U.S. From the crop category, Florida was #2 in the U.S. for vegetables and melons and ornamental plant sales, and #3 for fruits and berries. In the Livestock category, Florida was ranked 3rd for equine sales, and 4th for aquaculture. Florida was ranked 29th for cattle sales, but that does make sense because many of the operations in this state sell weaned calves that graze wheat and native pastures in the Midwest and are also finished and harvested in other states.
These were just a few highlights from Florida, but there is a lot more available from the statewide Summary: 2022 Florida Census of Ag
–
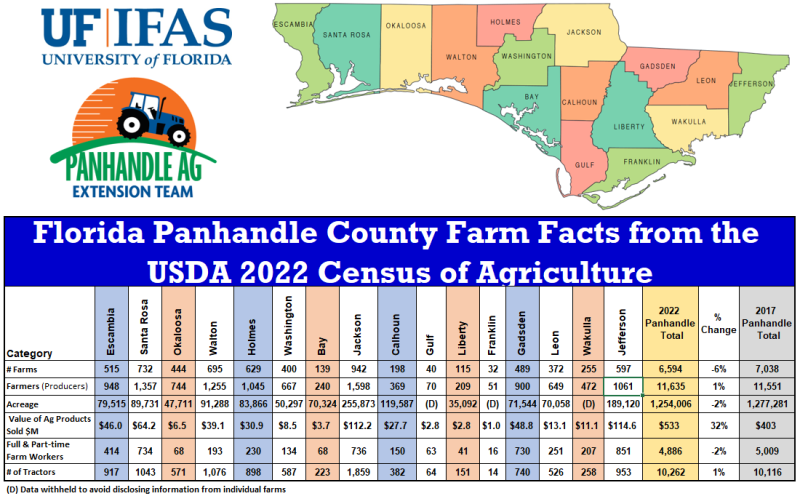
Panhandle Farm Facts
Agriculture is a huge part of the economy in the Florida Panhandle, based on the figures of the Census of Agriculture, farms contributed $533 million in farm gate sales. The number of Panhandle farms declined 6% to 6,594 farms, but the farm acreage actually increased slightly up 3% to 1.3 million acres. The number of farmers (producers that are decision makers) also rose slightly to 11,365. While there were more farmers in 2022, the number of full and part-time farm workers declined 2% to 4,886 in the Panhandle. One of the nuggets of data I always enjoy sharing is that there are over 10,000 tractors in the Panhandle, with an increase of 1% over the past five years. The top three agricultural counties in the Panhandle in 2022 were: 1. Jackson – 942 farms, 255,873 acres, & 1,598 farmers; 2. Jefferson – 597 farms, 189,120 acres, & 1061 farmers; 3. Santa Rosa – 732 farms, 89,371 acres, & 1,357 farmers.
–
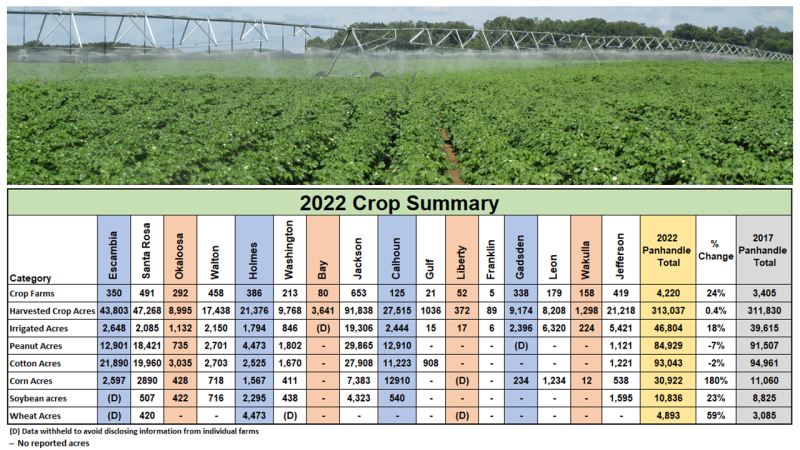
The Census of Agriculture also provides specific data on a range of specific types of farming. The chart above provides some highlights for the primary row crops grown in the Panhandle. Overall, there were 4,220 farms that had some level of row crop production in 2022, which was an increase of 24%, as compared to 2017. Crop acreage also increased slightly to 313,037 acres, but irrigated acres increased 18% to 46,804 which was 15% of the total crop acreage reported in 2022. The big change was the corn acreage, which increased 180%, as compared to 2017, while peanut and cotton acreage declined -7% and -2% respectively. Wheat acreage jumped up 59%, and soybean acres increased 23%. The Census of Ag reports on many other types of crops that are reported in Table 24. Selected Crops Harvested
–
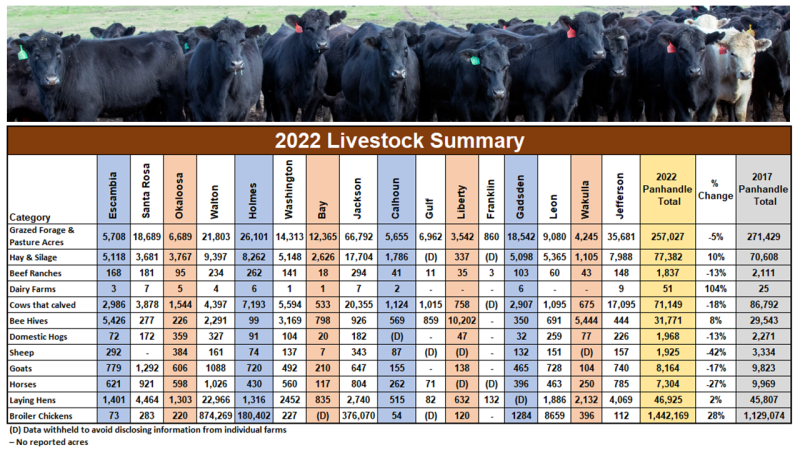
The Census of Agriculture also provides data on a range of specific types livestock production. The chart above provides some highlights for the livestock that are raised in the Panhandle. There was a total of 257,027 acres of grazed forage and pasture acres in the Panhandle in 2022, which was -5% lower than in 2017. There were 1,837 beef cattle ranches and 51 dairies reported from the Panhandle in 2022 with a total of 71,149 cows, which was down -18% from 2017. Just understand that there are not 51 commercial dairies in the Panhandle, but 51 farms that reported more than $1,000 in annual sales of milk. Beekeeping for honey production has gained in popularity with 8% growth in the Panhandle, as compared to 2017. There were 307 farms that reported honey production and 212 farms that reported honey sales (Not shown in the table above). There were 550 farms (not shown in table) that owned 7,304 horses in 2022, which was -27% lower than in 2017. Poultry production increased with 2% more laying hens and 28% more broilers than 2017. Primarily the only large scale commercial poultry production was in Walton and Holmes Counties. The Census of Ag reports other types of livestock that are reported in Tables 11-23 of the Florida Census of Ag Data Report.
–
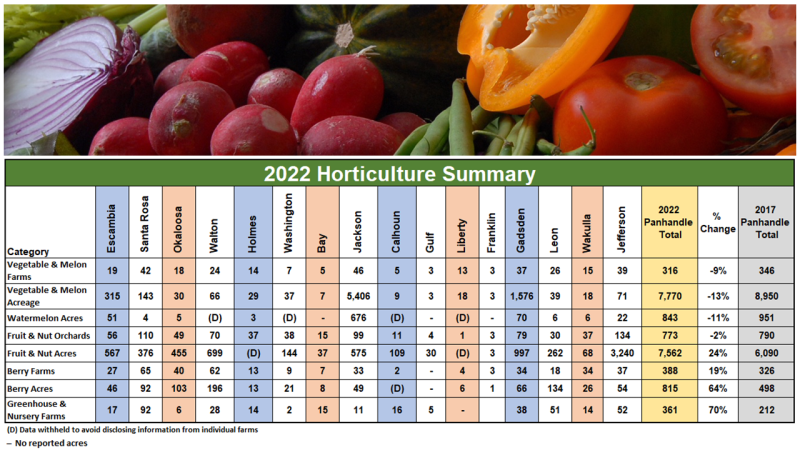
There was quite a bit of fluctuation in the horticulture industry in the Panhandle over the past five years. The big change were the number of farms with greenhouses and nurseries that saw a 70% growth, from 212 in 2017 to 361 in 2022. The number of berry farms rose 19%, but berry acreage rose 64% from 498 in 2017 to 815 acres in 2022. Traditional vegetable farms and acres saw a significant decrease over the past five years. Watermelons, that once were a major horticulture crop in the Panhandle, have dropped to only 843 reported acres in 2022. That is a 38% drop of from the 1,351 acres a decade ago, and 11% since the 951 acres reported five years ago.
–
The Census of Agriculture provides county level data in several forms that provide information available for individual counties:
Florida County Profiles – Provides highlights for each county in a nice 2-page handout that can be printed and used for a number of educational events.
Florida County Data – Provides 57 tables of detailed data for each county in Florida that was used to compile the highlights featured in this article.
NASS Quick Stats – Provides an online search for all NASS from the Census and annual survey data for each state or county.

demayo@ufl.edu - 850-482-9620
Follow me on Twitter
@UFCowman
- Friday Feature:Prosperity on the Modern Farm in 1950 - January 30, 2026
- Ranch Record Keeping for Annual Analysis & Innovation - January 23, 2026
- Friday Feature: 2026 Farm Dog of the Year - January 23, 2026