
September 2024
The summer and fall months are when a majority of producers are selling spring-born calves or yearlings from last fall. Due to the increase in supply of calves, prices typically decline during these months as demand from feedlot buyers is more easily met than in the spring. In Florida, we started seeing this decline in prices a little earlier (April), which is partly due to the market responding to the outbreak of HPAI H5N1in dairies. Prices then continued to follow the seasonality trend of declining in the summer and fall.
The first graph shows the average monthly price index for 450-500 lb steers in Florida from 2018-2022. This graph is simply a visual to show how we know the current dip in prices is normal for this time of year. The price index (blue line) shows the relationship between each month’s average price and the annual average price. When the price index is above 100%, that means prices in that month, on average, are higher than the annual average, (spring). When the price index is below 100%, that means average prices in that month are lower than the annual average, (fall).
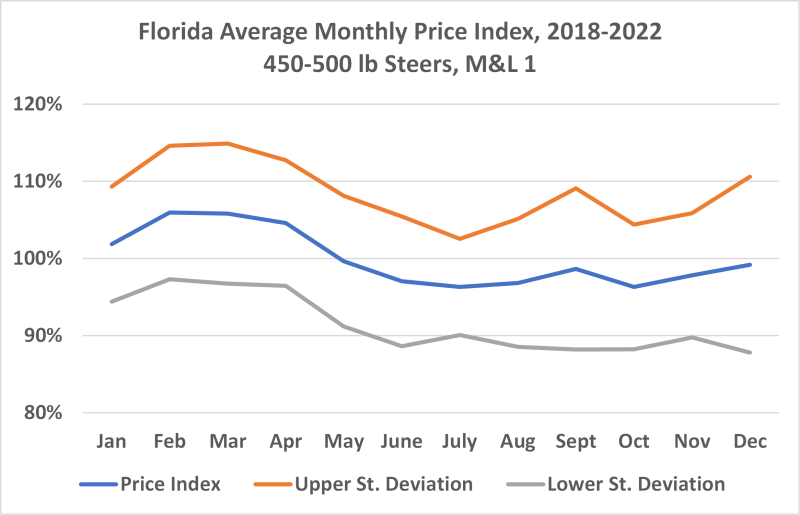
The orange and gray lines in the first graph are used to show the approximate range of prices during that month. For example, during 2018-2022, average October prices were lower than the annual average. But there was variability where prices ranged between 88% and 104% of the annual average for October. In $/cwt terms, the 5-year average price for 450-500 lb steer calves in the month of October was $154/cwt. The range of prices was $135/cwt-$160/cwt, meaning prices in a typical year would be between this range 68% (roughly two thirds) of the time. (68% statistically represents adding or subtracting one standard deviation from the average; standard deviation represents the amount of variation around the average).
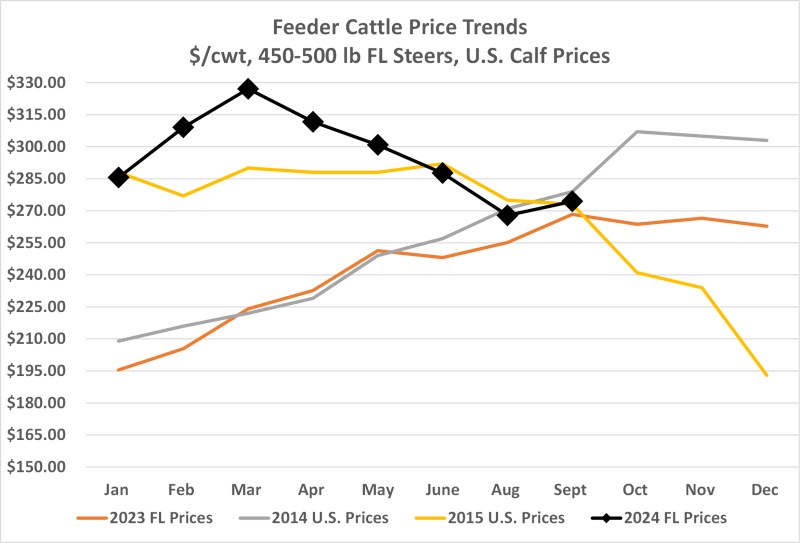
Now, the first graph only represents 2018-2022, not 2023 when prices were transitioning from a low point to a high point. The second graph shows how this transition period did not follow the typical seasonality trend (orange line). Prices continued rising into 2024, but then began falling as previously mentioned and much like we saw in 2015.
However, the difference to notice between 2024 and 2015 is inventory levels and the rate of expansion in Figure 3 below.
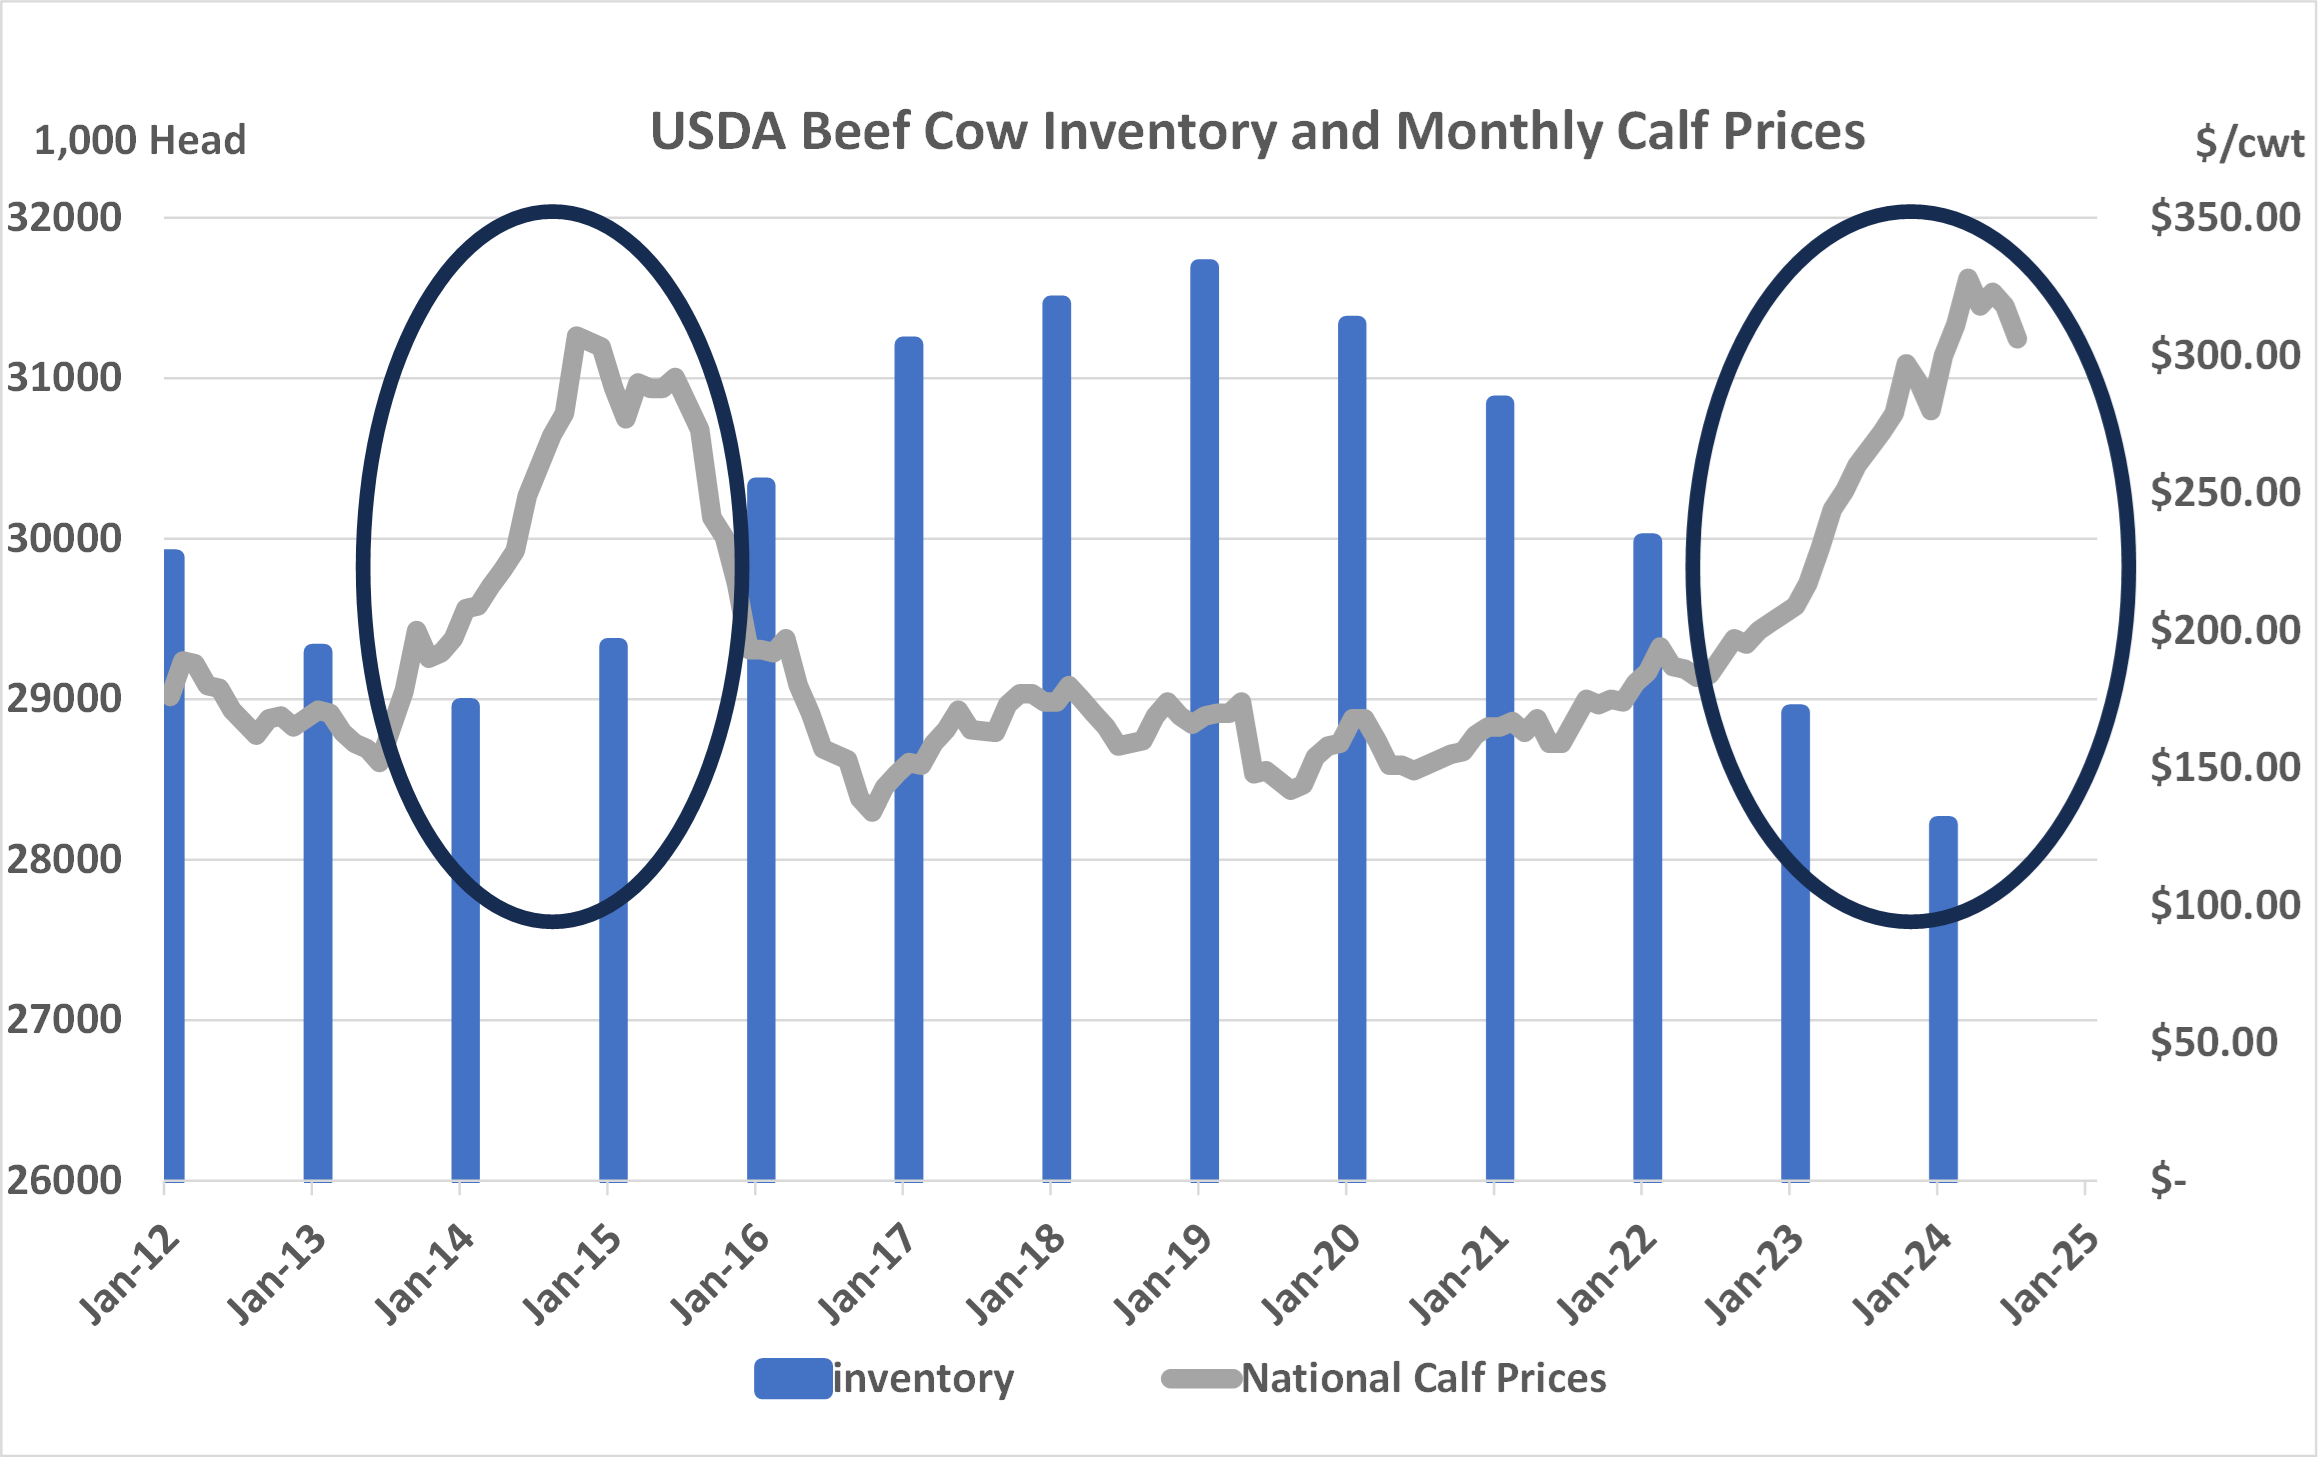
In 2015, expansion had already started when prices were at the levels we are seeing today. There was no incentive for prices to climb back up after the typical dip in the fall. In the current market, we have not started expanding and have already hit record prices that we saw back in 2015. This indicates that while we are experiencing some seasonality this year, it is not expected that we are headed for a continuously lower level of cattle prices in the near future.
For questions, contact Hannah at h.baker@ufl.edu. See this update and other helpful resources online at https://rcrec-ona.ifas.ufl.edu/about/directory/staff/hannah-baker/
(863) 374-7051
- The Economic Influence of Intentional Management of Your Cow Herd - December 19, 2025
- December 2025 Florida Cattle Market Update - December 19, 2025
- October 2025 Florida Cattle Market Update - November 7, 2025