
The purpose of this report is to provide “across-the-board” information about the Florida Beef Cattle Industry to tell the whole story of what is going on as we head into 2025. Throughout the year, monthly reports will be published highlighting certain sections of the industry based on what is happening at that time of year. The annual report tells the whole story of how inventory levels, prices, cattle on feed, and other segments are all intertwined and how they affect Florida ranchers.
–
INVENTORY
National
On January 31st, 2025, the USDA released the annual Cattle Inventory Report. In line with expectations, all cattle and calves (beef + dairy) in the U.S. totaled at 86.7 million head, 0.6 percent below 2024’s January inventory. All cows and heifers that calved totaled at 37.2 million head, down 0.4 percent. Cattle inventory has declined by 8.5 percent (~8 million head) since the last cyclical peak in 2019 and is the smallest inventory of cattle in the U.S. since 1951.
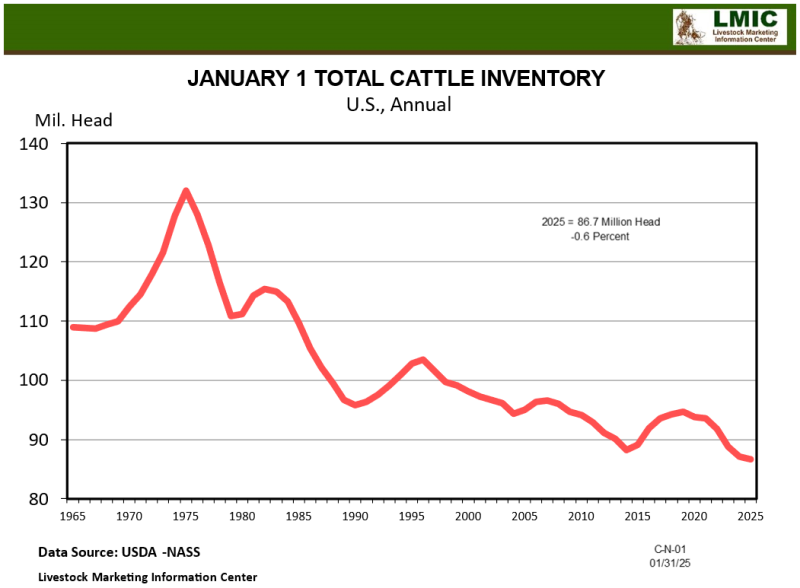
The national beef cow herd totaled at 27.9 million head, down 0.5 percent from 2024, and 3.8 percent from the low seen in 2014. The beef cow herd has declined by 3.8 million head since the last peak in 2019 and is the smallest beef cow herd since 1961. The dairy cow herd remained unchanged from 2024 with 9.3 million head.
 –
–
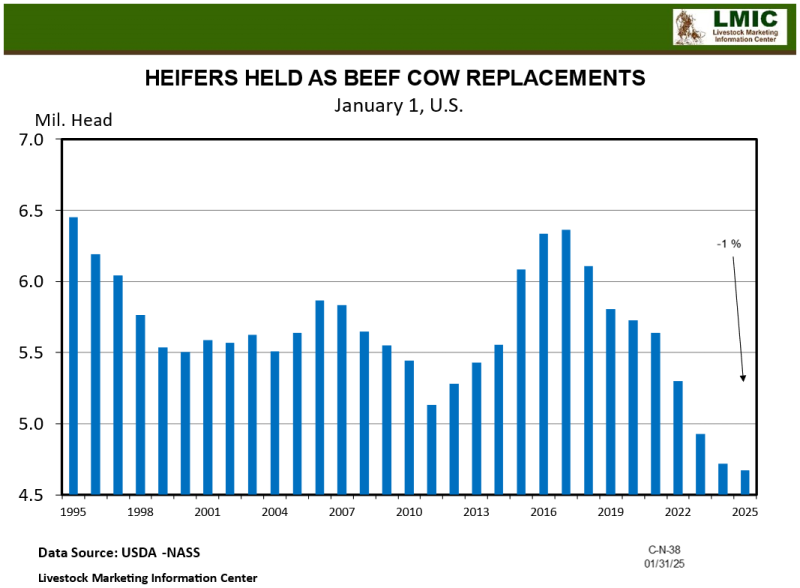
The number of heifers intended for beef cow replacement declined by 1 percent to 4.7 million head, and the number of heifers expected to calve in 2025 declined by 2 percent. The calf crop in 2024 totaled at 33.5 million head, decreasing by roughly 33,000 head from 2023’s calf crop. The calculated beef calf crop is estimated at 25.1 million head, down 293,000 head since the previous cyclical low in 2014.
 –
–
Florida
All cattle and calves in Florida totaled at 1.56 million head, unchanged from last year. This is the smallest inventory in Florida since 1951 and has declined by 120,000 head since the cyclical peak in 2019.
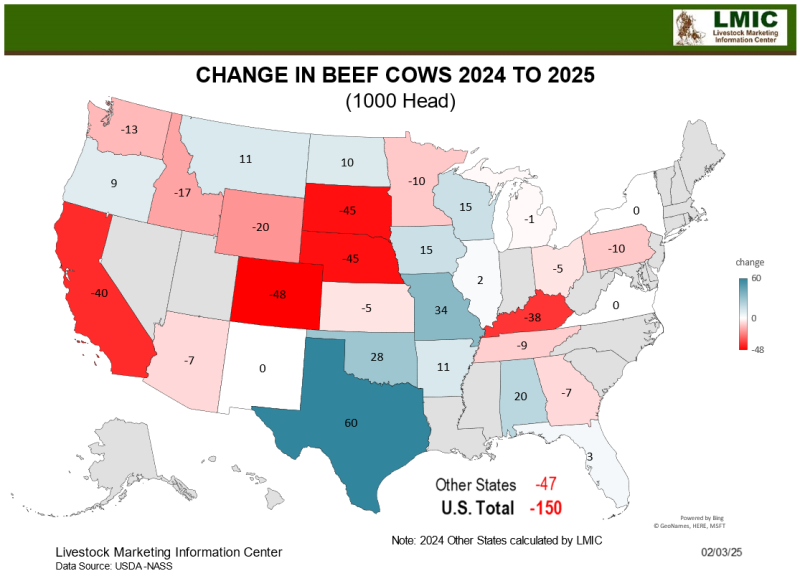
Beef cow numbers in Florida increased by 0.3 percent (~3,000 head) since 2024 totaling at 865,000 head. However, North Dakota also increased their cattle numbers by roughly 10,000 head, resulting in both Kentucky and Florida “dropping in the ranks” to 9th and 10th in beef cattle production.
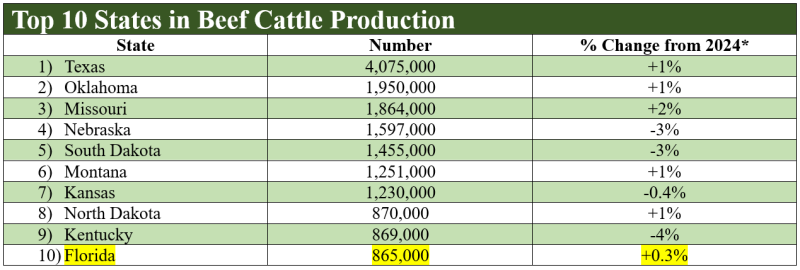
*Revisions/updates were made to the 2024 USDA Inventory Report after the publication of the 2024 Annual Cattle Market Report showing there were more, or fewer cattle than initially reported in some states. The percentage changes above are based on the updated inventory numbers.
–
The number of Florida dairy cows has declined by 3 percent to 95,000 head. While the nation’s beef cow herd experienced a low in 2014 and peaked in 2019, Florida’s beef cow herd saw its low in 2016 at 905,000 head and peaked in 2021 at 919,000 head. The Florida beef cow herd has declined by 54,000 head since the last peak and is down 4.4 percent from the last low.
The number of heifers intended for beef cow replacements in Florida was unchanged from 2024 at 115,000 head, unlike last year, when we saw a 4 percent decline. Florida’s calf crop increased by 1 percent to 770,000 head. While we don’t see that Florida is strongly headed for expansion, we do see that liquidation may have slowed and stabilization may be on producers’ minds. Continued high prices are certainly an incentive to raise and sell more calves.
–
Prices
Average prices for 450-495-pound steers in Florida are $47/cwt higher (16.5% higher) than they were in January of 2024. Prices are trending higher than the peak prices seen in 2015. It would make sense to compare today’s prices to 2014-2015. However, when adjusting for inflation, market prices are still below 2014-2015 levels. This could mean prices for feeder cattle have not yet peaked, which makes sense since we have not seen signs of expansion. When producers begin retaining heifers and expansion does begin, that is when we will see prices begin to reach their peak.
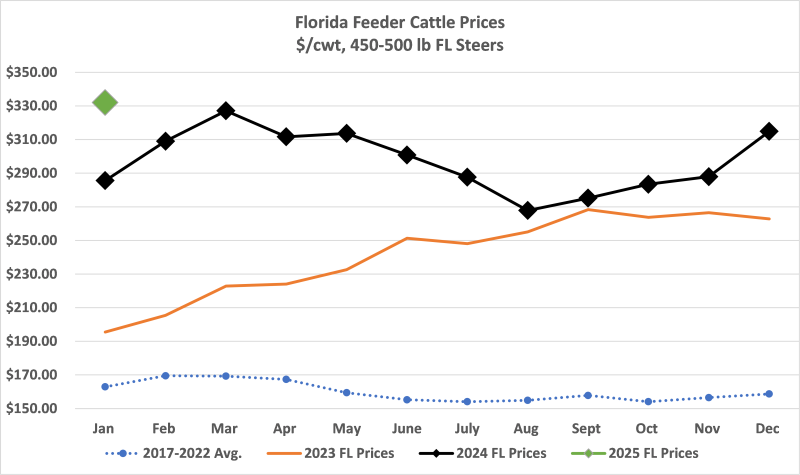
Data Source: Florida Weekly Livestock Auction Summary
–
Prices for weaned heifers in Florida (450-495 lbs) are $43/cwt higher (17% higher) than they were in January 2024 and have almost doubled since January 2022. The same story is true for replacement cattle and cull cows. Prices for replacement cattle and cull cows have increased by roughly 52 percent and 21 percent year over year. The value of female cattle will continue rising until we start expanding as more producers start retaining rather than selling heifers, which will decrease the supply of calves being sold. Since the number of heifers intended for beef cow replacement remained unchanged from last year in Florida, it will be interesting to see if 2025 will be a year where producers are starting to hold more heifers back, or if high prices will incentivize them to keep selling. Forage availability, input costs, and consumer demand will all be factors that affect this decision.
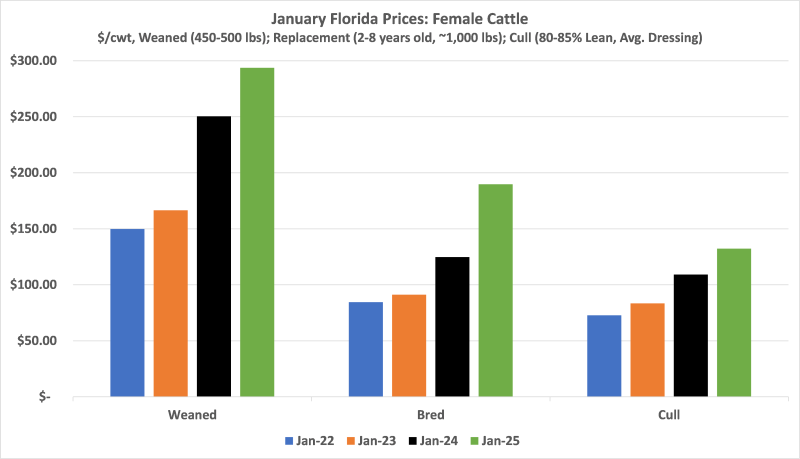
Data Source: Florida Weekly Livestock Auction Summary *Prices for female cattle are based on the last week of each month
–
Cattle on Feed, Feeder Cattle Supplies, & Cattle Slaughter
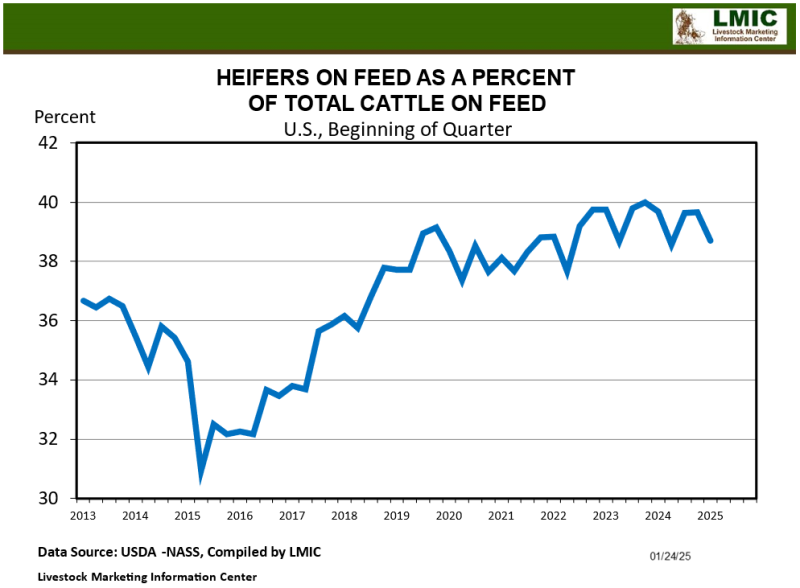
As of January 1, the number of cattle on feed was 14.2 million head, down 0.9 percent year over year. A total of 22.2 million head were placed in feedlots in 2024, compared to the 22.6 million placed in 2023. Even though cattle on feed looked steady from month to month, it was not because more cattle were being placed. It was because cattle were being held longer in an effort to sell heavier cattle to improve profits in addition to a high percentage of cattle being heifers. As of January 1, 38.7 percent of all cattle on feed were heifers. For reference, during the last expansion, this number ranged from 32-34 percent. While this number has decreased from the 40 percent we saw last January, it is not enough to insinuate heavy expansion efforts.
 –
–
The average carcass dressed weights in 2024 hit record levels of 956 pounds for steers in November, and 868 pounds for heifers in December. Increased weights helped to offset the overall decline in cattle slaughter, which improved beef production forecasts throughout 2024. Beef production in 2024 totaled at 26.9 billion pounds, slightly above production last year and 800 million pounds more than the original January 2024 forecast.
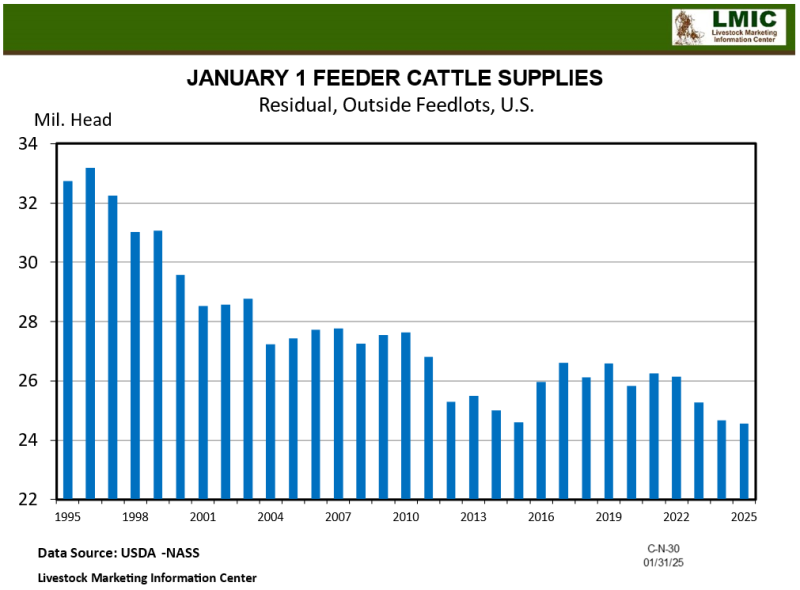
However, time will tell how long longer feeding periods can offset the inevitability of tighter feeder cattle supplies. The current calculated level of feeder cattle supplies is 24.5 million head, down 0.8 percent year over year. The 2025 beef production forecast is currently 25.7 billion pounds, almost a 4 percent decline.
 –
–
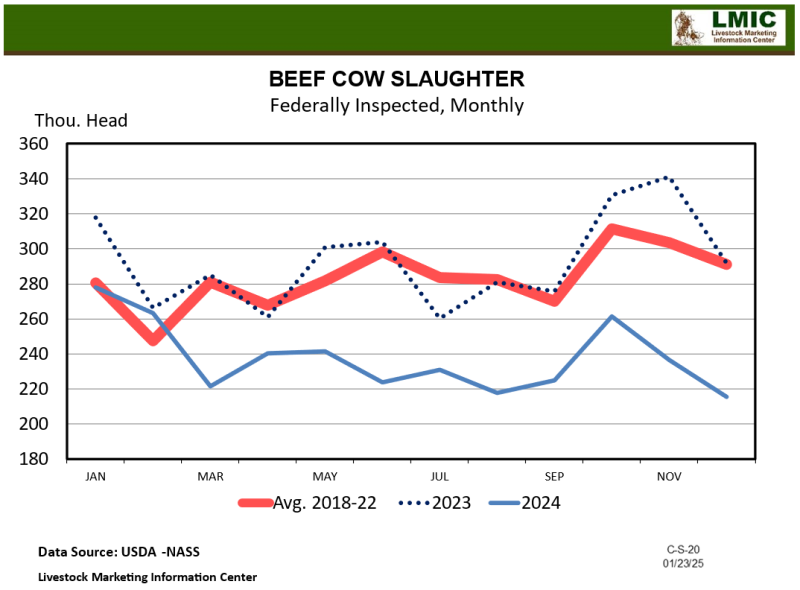
Cattle slaughter in 2024 totaled at 31.2 million head, down 3 percent from 2023. Beef cow slaughter declined by 18 percent, which at first glance looks like we have drastically slowed our culling rate. However, when looking at beef cow slaughter relative to supplies, the culling rate in 2024 dropped to 10.2 percent, but is still higher than the 9 percent culling rate seen during the last expansion. While it seems that culling in Florida has slowed due to the 3,000 head increase in beef cows, culling nationwide will have to slow even more in 2025 before seeing signs of stabilization followed by growth.
 –
–
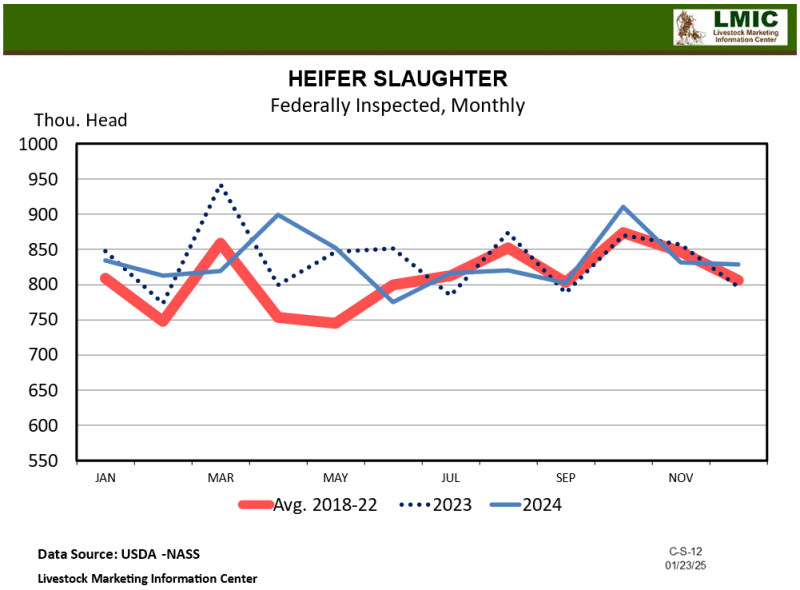
Additionally, heifer slaughter accounted for 32 percent of all cattle slaughter in 2024. During the last expansion, this percentage was in the mid-twenties.
 –
–
Input Prices
The graph below shows percentage changes in production costs according to the prices paid by farmers index. The base year is 2011 (2011=100%). The prices paid index is a measurement of price change over time. For example, the average annual price index for feed in 2024 was 116.4, meaning feed prices have increased by 16.4 percent since 2011. Since January 2024, overall prices for feed, fuel, and fertilizer have all declined with chemical prices increasing slightly. However, inputs are still much higher than prices seen pre-pandemic.
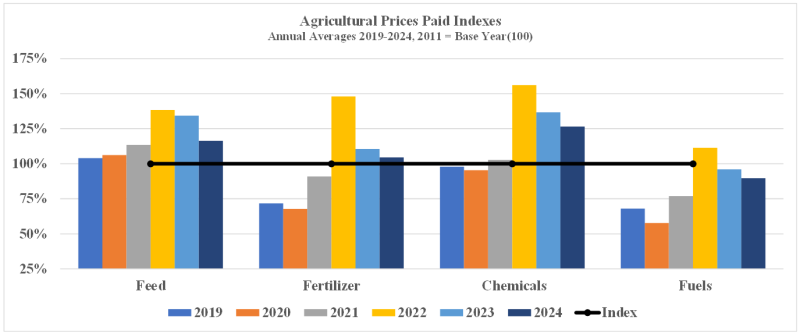
Source: USDA Agricultural Prices Report
–
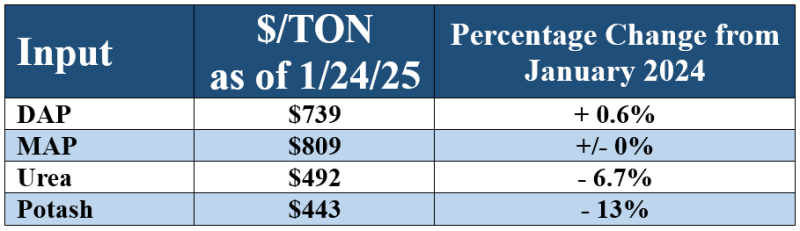
Even with cattle prices being at record-levels, high input prices are affecting profit margins. It is important to keep accurate records, manage input costs, and manage and market cattle efficiently to maximize profitability. National fertilizer prices from DTN Progressive Farmer are listed below. Because of the recent implementation of 25% tariffs on Canadian and Mexican imports (currently paused for 30 days for negotiations), fertilizer prices could be affected, since the U.S. imports 80-90% of its potash from Canada.
 –
–
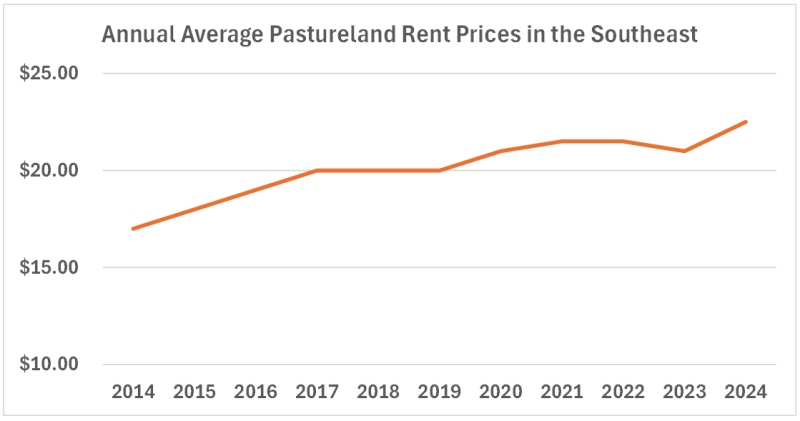
Cash rent prices for pastureland in the Southeast have increased by 7 percent year-over year. This input also affects the management of cattle as leases become more expensive along with more land being sold for development, especially in Florida.
 –
–
Questions, contact Hannah at h.baker@ufl.edu
See this update and other helpful resources online at https://rcrec-ona.ifas.ufl.edu/about/directory/staff/hannah-baker/
(863) 374-7051
- The Economic Influence of Intentional Management of Your Cow Herd - December 19, 2025
- December 2025 Florida Cattle Market Update - December 19, 2025
- October 2025 Florida Cattle Market Update - November 7, 2025