
Expected Progeny Differences (EPDs) have been a major tool for genetic selection of breeding cattle for many years. One of the issues, though, is that EPDs are only useful within a single specific breed. Because each breed manages and presents its own data somewhat differently, numeric values are not comparable from one database to another. Consequently, EPD values cannot be compared across breeds without the assistance of the adjustment factors detailed below.
–
Across-Breed EPD Adjustment Factors
In March, The Beef Improvement Federation (BIF) released the 2025 Across-Breed EPD Table that was updated for 2025, by Larry Kuehn, geneticist, at USDA’s Meat Animal Research Center (MARC). These EPD Adjustments provide some very interesting information that can be very helpful for commercial cattle ranchers. Whether you rely on multiple breeds for a crossbreeding system, or simply want to compare bulls from different breeds, Table 1 below provides current EPD adjustments for comparison between breeds for eight key traits, with Angus serving as the base for comparison.
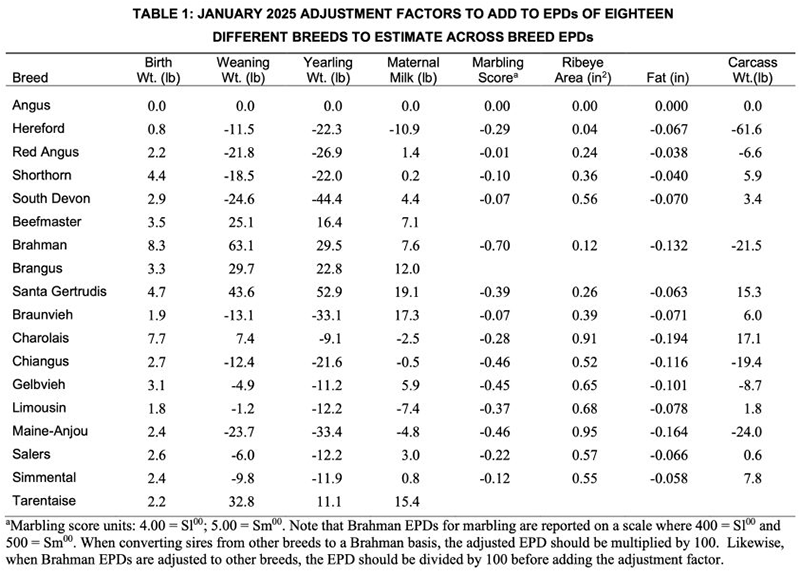
Across-Breed EPD table, developed by the Meat Animal Research Center (MARC). Source: 2025 Across-Breed EPD Table and Improvements
–
There are several ways you can use the information, but the simplest would be to compare two bulls from different breeds. To compare a bull from a different breed with an Angus, the math is pretty simple. You would either add or subtract the adjustment factors in Table 1 to the EPDs of the other breed. For instance, if you were comparing EPDs for a Simmental with an Angus, to make the EPDs comparable you would need to add 2.4 lbs to the Birth Weight EPD of the Simmental for comparison to an Angus. To provide a better idea of how you might use this information, I developed an Across-Breed Comparison chart below with EPD data from the top indexing bulls from each breed at the 2025 Florida Bull Test Sale, that took place back in January. This is not a comparison of breeds, but individual bulls that were sold in the same sale.
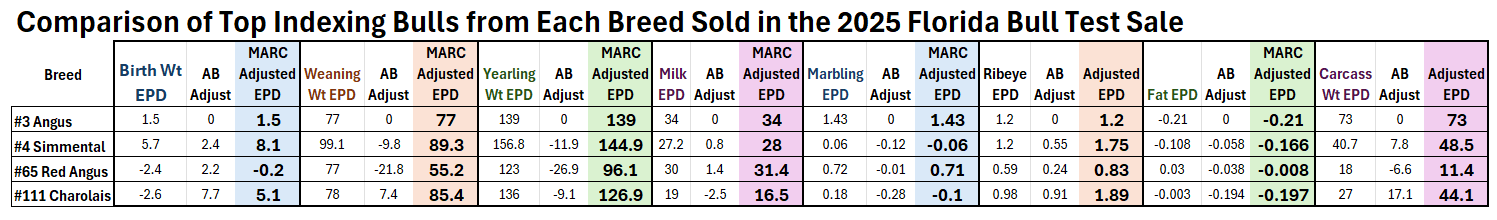
Comparison of the top indexing bulls from four different breeds sold in the 2025 Florida Bull Test Sale using the MARC Across-Breed EPD adjustment factors. Source: 2025 Florida Bull Test Catalog.
–
It is interesting to use the MARC Across-Breed EPD adjustments to compare actual bulls from a multi-breed sale. That table shows the breed reported EPD for each bull, the adjustment factor provided in the MARC report and the adjusted EPD for comparison. Even though the Angus breed has the lowest average birth weights in the MARC table, #65 Red Angus had the lowest Birth Weight EPD in this group of four bulls. Based on this data, #65 would be expected to have the lightest calves at birth of the bulls in this group. The Charolais breed had the highest adjustment for weaning weight EPDs of the group, but the #4 Simmental bull would be expected to have the highest weaning weights from these four individuals. When you compare the Ribeye Area EPDs of these bulls however, #111 Charolais would be expected to sire calves with the largest ribeyes. With the MARC EPD adjustment table, ranchers can compare traits fairly between 18 different breeds. This table would not have been helpful for comparison between SimAngus or Red Brangus, because t an adjustment factor for those breeds was not provided.
–
Breed Means
The other comparisons provide from the MARC report is breed comparisons provided in Table 2 below. These numbers represent differences when bulls from two different breeds are mated to cows of an unrelated breed.
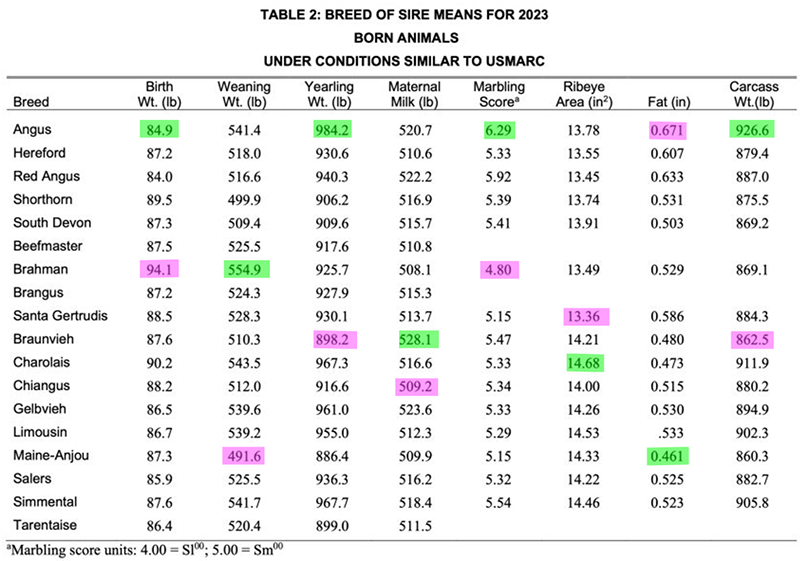
Breed of sire means (one half of full breed effect; breed of sire means predict differences when bulls from two different breeds are mated to cows of a third, unrelated breed) for animals born in 2023 under conditions similar to USMARC are presented in Table 2. Source: 2025 Across-Breed EPD Table and Improvements
–
In Table 2 above, I highlighted the best of the 18 breeds in bright green, and magenta for the lowest performance for a given trait. This data is helpful for deciding which breed or breeds are best suited to meet your genetic goals. If your primary goal is to sell the heaviest calves possible at weaning, then the Brahman breed had the highest mean. If your goal was to improve the marbling score of your calves, the Angus breed was superior. If you wanted to boost the milk production of your replacement females, then the Braunvieh breed provided superior performance, however, that breed also had the lightest yearling weight performance. Just remember that there is considerably more genetic variation within each breed that between breeds, so you still must look at the individual data for the animals you are considering purchasing.
The MARC Across-Breed EPD tables are very useful for comparing performance data for bulls from 18 different breeds. Use these charts as a guide but do your homework on the specific bulls offered at a sale or direct from a farm. As in the example above from this year’s Florida Bull Test Sale, you can’t base decisions on breed characteristics alone but must do individual animal comparisons.

demayo@ufl.edu - 850-482-9620
Follow me on Twitter
@UFCowman
- 2025 Weather Summary and 2026 1st Quarter Outlook - January 16, 2026
- 2025 Average Farmland Rental Rates, Lease Agreements, and Worker Wages Summary - January 16, 2026
- Friday Feature:1954 How to Dial Your Phone - January 16, 2026