
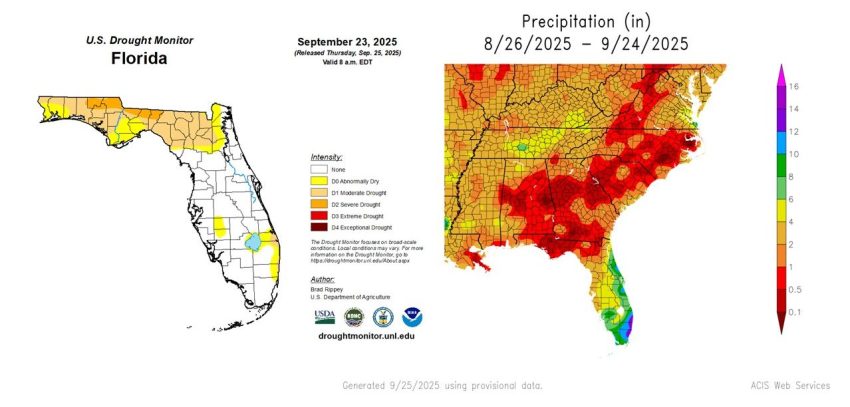
It is seriously dry in the Central Panhandle. The graphics above show that it has essentially not rained a drop in the past month (or longer in many locations) and consequently the area is now in D2 Severe Drought according to the Drought Monitor. These incredibly adverse growing conditions are greatly impacting all dryland (non-irrigated) peanut fields in the area. In the most severely impacted areas, conversations about harvest timing have focused on crop survivability, not maturity. Unfortunate truths like “dead vines don’t hold pods” and “fields that have entered permanent wilt (completely wilted first thing in the morning) are soon to be dead and are unlikely to recover even if they receive a rain” are having to be balanced against practical facts like “the ground is so hard I can’t dig“. All-in-all it’s a poor situation, especially for later planted fields. Things are noticeably better in irrigated fields. In relation crop maturity and accumulated aGDDs, irrigated fields are still progressing fairly well, albeit slower than earlier in the season as days are shortening and nighttime temps have been cooler (by Florida late summer standards).
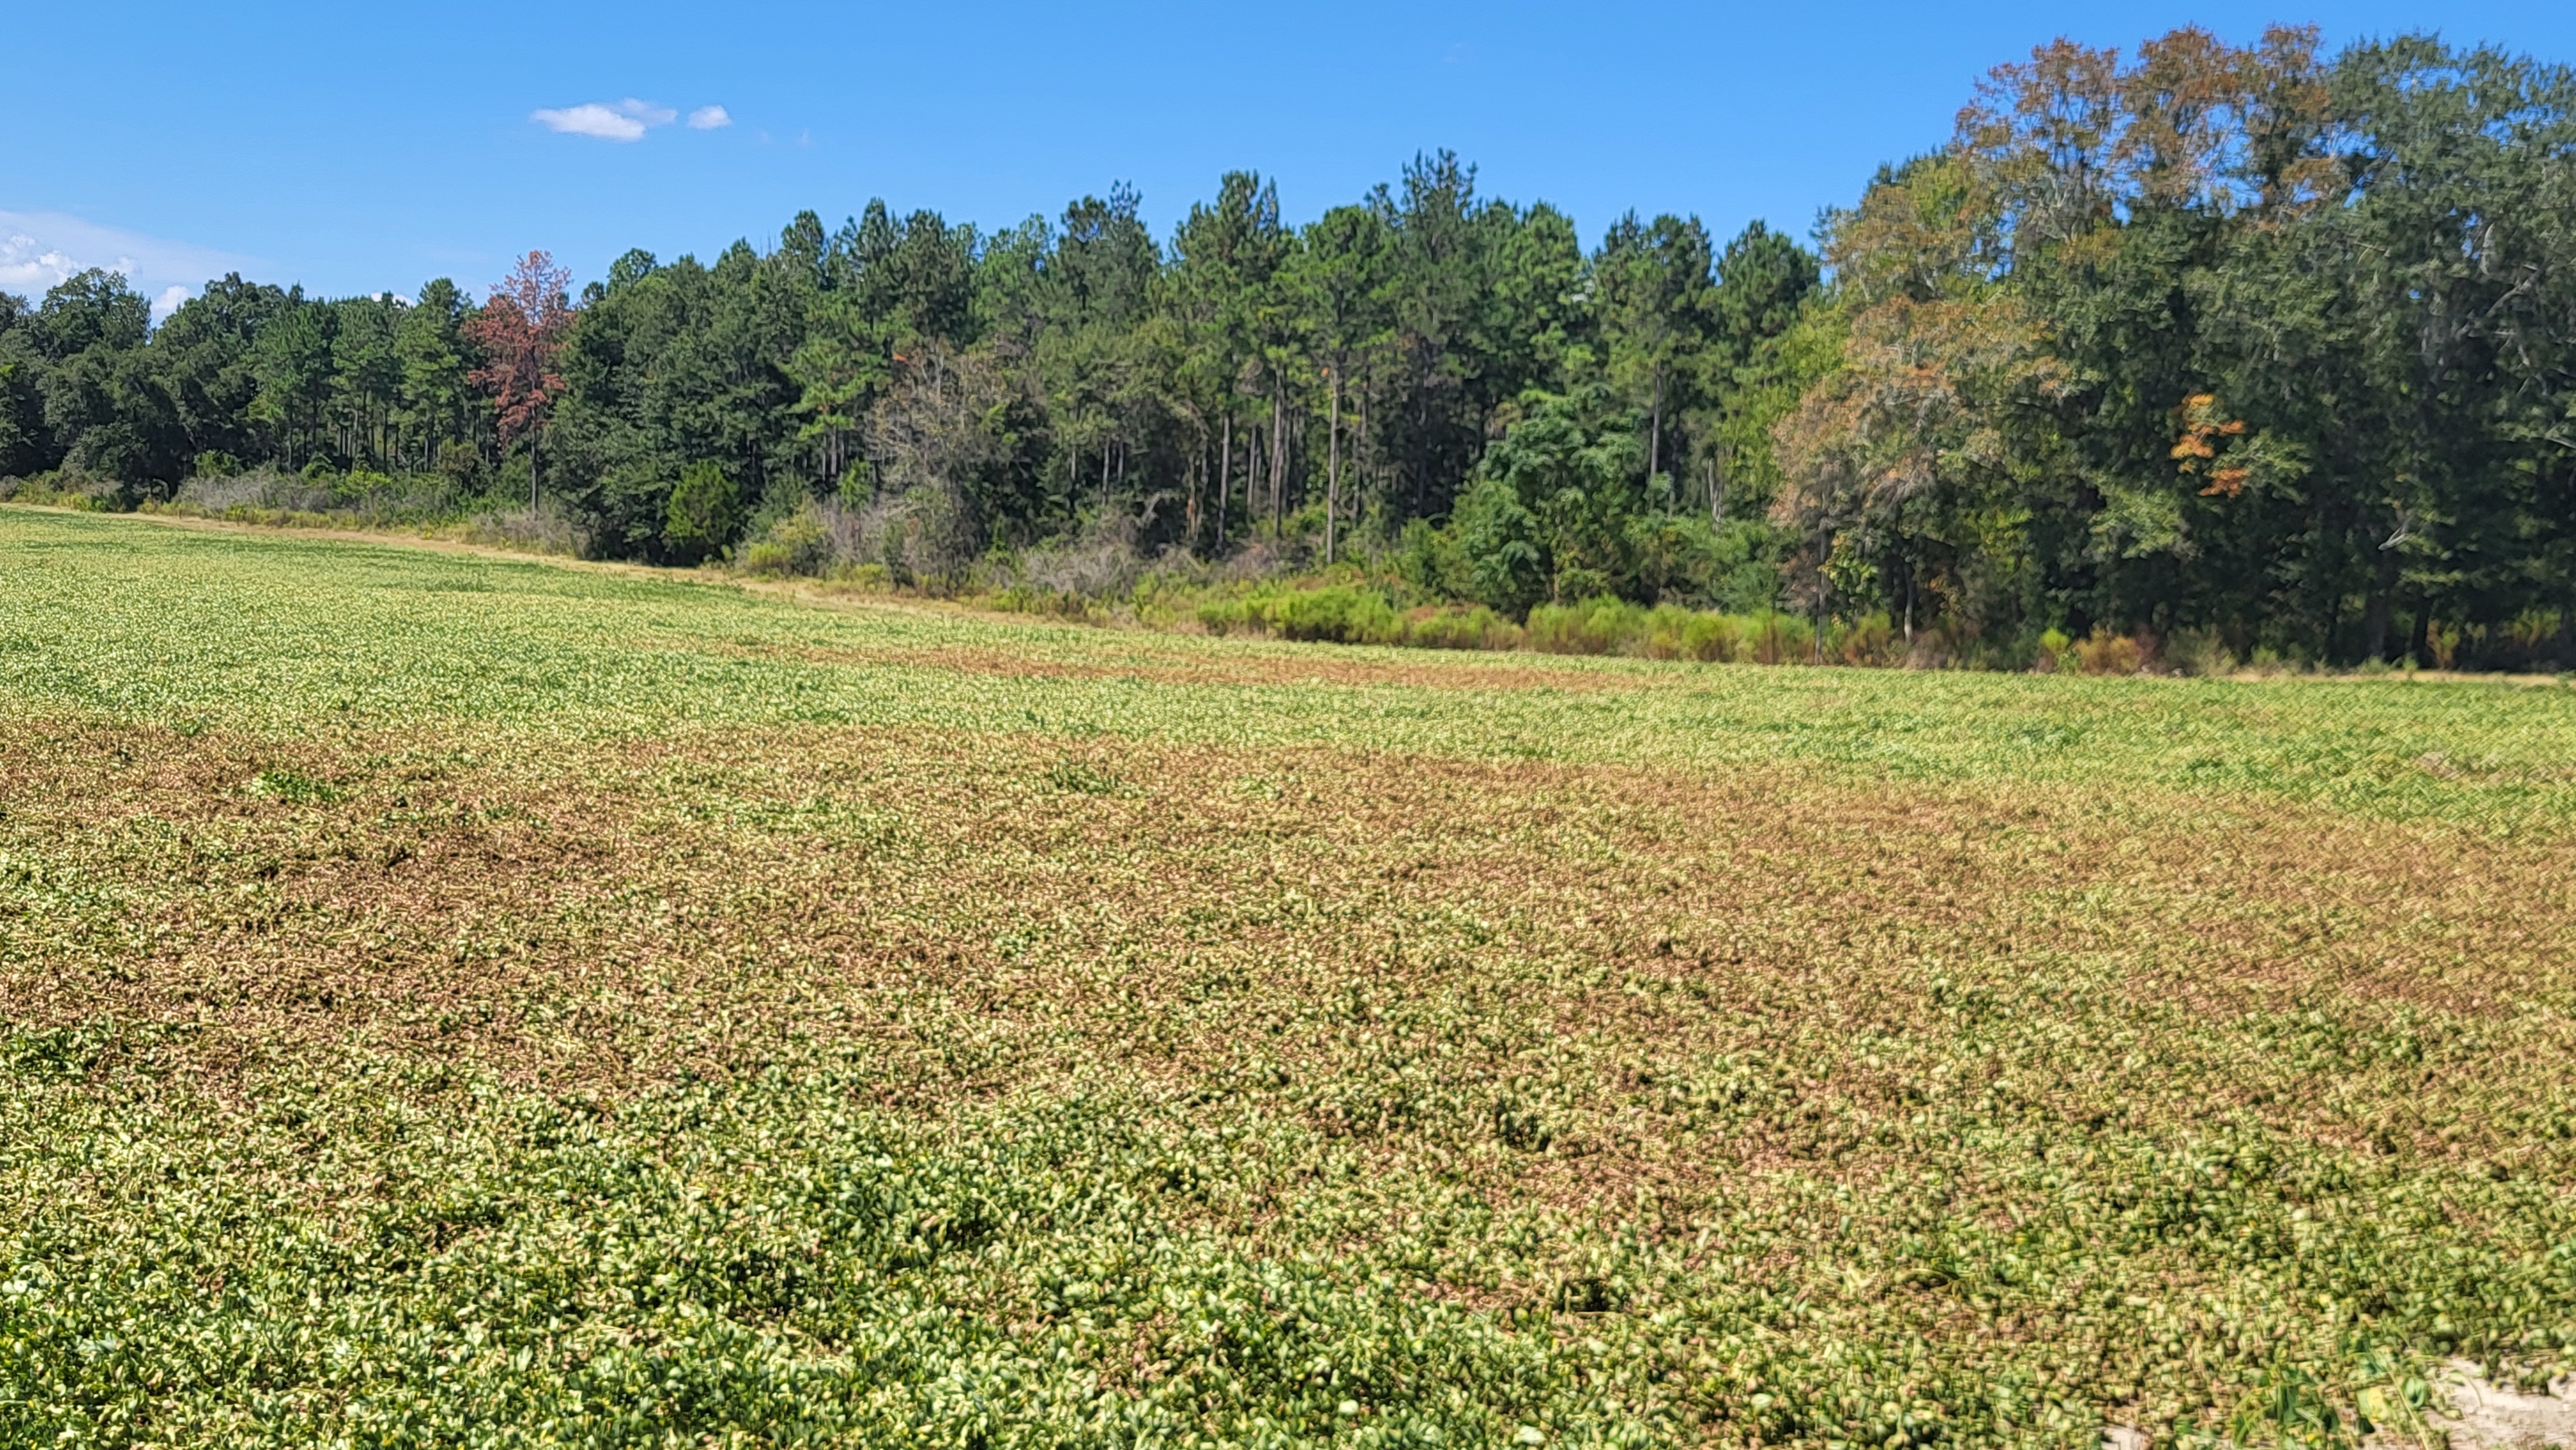
A severely wilted peanut field in Washington County. All vines are lying flat on the ground with the silver underside of the leaves showing. The brown areas are where the vines have completely died, and necrosis is setting in. Photo Credit: Mark Mauldin, UF/IFAS
The aGDD Tracker below shows the number of adjusted Growing Degree Days (aGDDs) accumulated by 72 fictional fields (8 locations x 9 planting dates) as of 9/25/25. Real temperature and rainfall data from each location is used as well as common soil types for the areas (Jay – sandy loam, Marianna – loamy sand, Marianna Irrigated – sand, Monticello – loamy sand, Live Oak and Bronson – sand). Medium maturity peanuts reach physiological maturity after the accumulation of approximately 2,500 Growing Degree Days and the aGDD Tracker quantifies their progress. Use the Tracker to approximate how your fields are progressing by following the field that are the most similar to yours in terms of planting date, location and irrigation status. If the aGDD value shown for your field is black (under 2,300), it’s probably not time to dig. If it’s yellow (between 2,300 and 2,500), you’re getting close; it’s time to pull samples and pod-blast to fine tune your harvest timing. Orange (2,500+) means it’s likely time to harvest, but pod-blasting is always the best way to know for sure.
For more precise tracking of your fields, go to PeanutFARM.org and set up your fields in the system. You will be able to enter field specific rainfall/irrigation data and soil type. Temperature data will come from the closest FAWN weather station. If you are interested in setting up your own peanut fields on PeanutFARM.org, don’t hesitate to contact me for assistance.
aGDD Tracker for the Florida Peanut Producing Region – 9/25/25 edition
The aGDD Tracker is compiled from data generated by PeanutFARM.org. The dark blue bars, in the cells behind the aGDD values, indicate progress towards 2500 aGDDs. The bar extends to the right as aGDDs are accumulated. The entire cell will be dark blue when a field has accumulated 2500 aGDDs. It is recommended that fields be sampled, and exact days-to-harvest be determined via pod-blasting once a field reaches 2300 aGDDs.
When looking at this addition of the aGDD Tracker the disparity between irrigated and non-irrigated fields is immediately noticeable. Irrigated fields trudge on, remaining ahead of the calendar (** see note below on irrigated fields) while non-irrigated fields fall farther behind the “on schedule” mark of 2500 aGDDs at 140 calendar days. In the two weeks since the previous aGDD Tracker was published the non-irrigated fields in the Central and Eastern Panhandle have accumulated an average of 11 aGDDs per calendar day – a snail’s pace at best. Additionally, fields at or near permanent wilt are essentially not accumulating any aGDDs because the plants are not functioning. In the far Western Panhandle, they have received a small amount of rain and have correspondingly accumulated a few more aGDDs. At that rate of accumulation (11 aGDDs per calendar day) the non-irrigated fields on the Tracker are projecting anywhere from 7 days to 35 days behind schedule, with the later planting dates being the farthest behind.
I doubt there will be any peanuts intentionally left in the ground 175 days. It doesn’t matter if the peanuts have reached optimum maturity or not, when the vines succumb to drought or disease the peanuts must be harvested. In regard to optimally timing harvest, making the most of the mess the weather has given us this year will be complicated. Honestly, under these kinds of drought conditions, the aGDD Tracker is less useful than it normally is and a profile board can only show you how far along the crop is, not predict days until harvest, because a day at or near permanent wilt counts for virtually nothing in terms of maturing a crop.
Please don’t hesitate to reach out to myself or your County’s Agricultural Extension Agent for help figuring out how to best navigate this challenging harvest season.
–
** The aGDD values shown for the irrigated fields represent peanuts that have never experienced a single moment of drought stress and have had zero pest/disease pressure. The aGDD values are the absolute maximum physically possible within the parameters of the temperature data provided by the FAWN Stations – real life probably doesn’t work like that.
- 2026 Florida Bull Test Sale – Performance Data Evaluation Simplified - January 9, 2026
- Panhandle Corn & Soybean Update Friday – February 6 - January 9, 2026
- Peanut Maturity Update – 10/9/25 - October 10, 2025