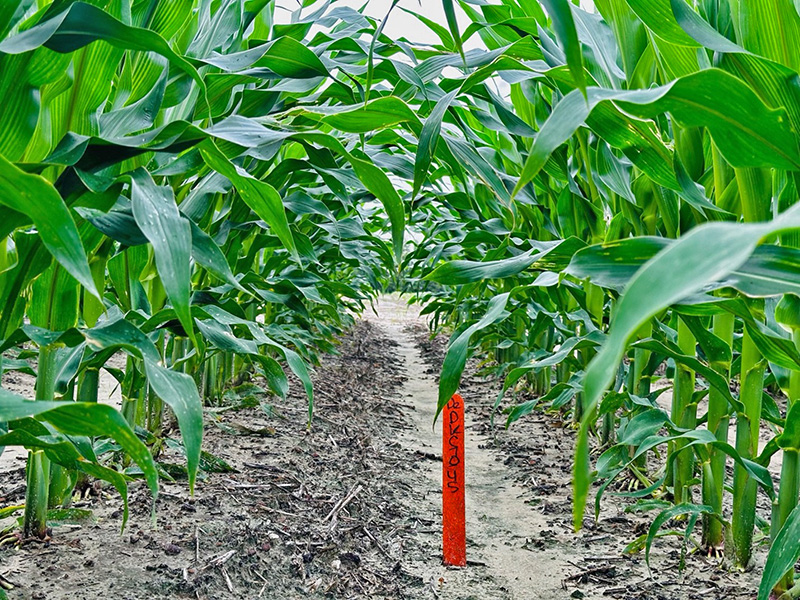
Figure 1. Dekalb DKC 7045 corn on May 18th, 2024, at NFREC-Quincy corn variety trial. Credit: Sudeep Sidhu, UF/IFAS
Gabrielle Alves Comitre, Graduate Research Assistant, Sudeep Singh Sidhu, Assistant Professor-Agronomy, UF/IFAS North Florida Research and Education Center, Quincy, FL.
 We are excited to share the results from our 2025 Corn Variety Trials! Farmers, extension agents, industry professionals can now explore how each corn variety performed across our three trial locations in North Florida.
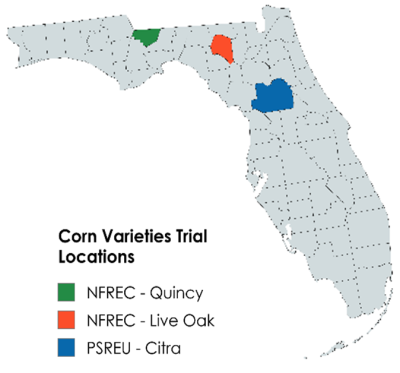
In 2025, we evaluated 26 corn varieties from multiple seed companies under irrigation at three sites: the North Florida Research and Education Center (NFREC) in Live Oak, NFREC in Quincy, and the Plant Science Research and Education Unit (PSREU) in Citra (Figure 1).
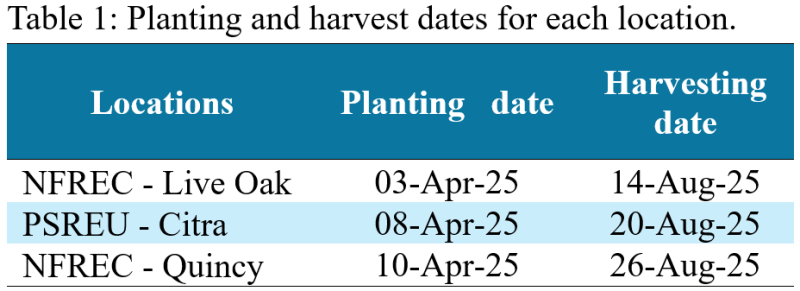
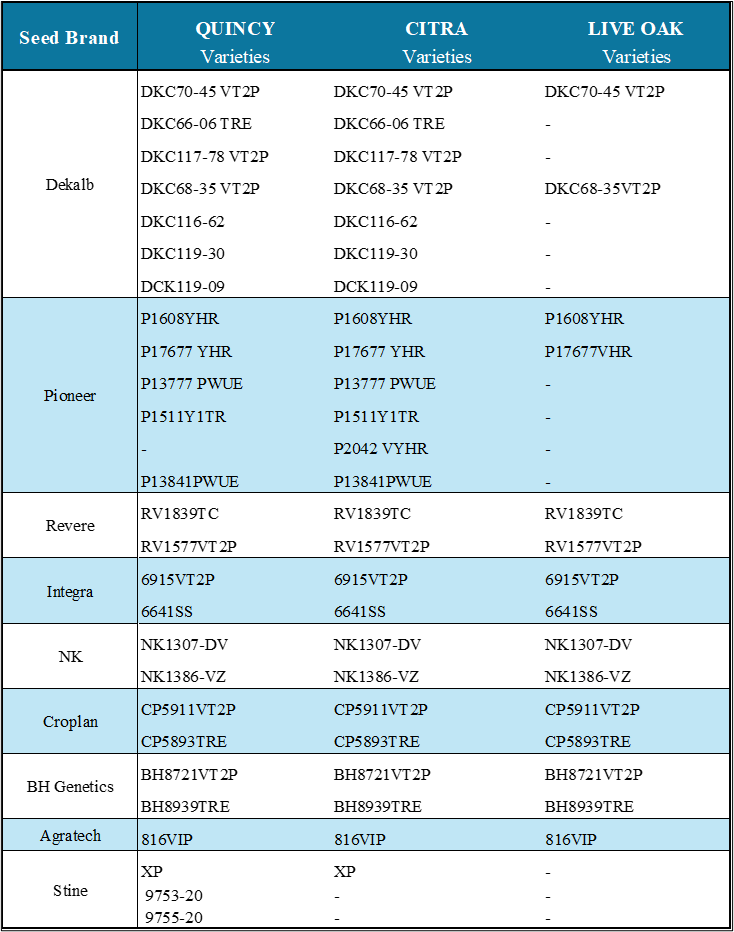
This year’s weather was much more favorable for corn production. With a milder hurricane season compared to last year, we were able to achieve higher yields across our trial locations. Table 1 provides the planting and harvest dates for each location. In Live Oak, corn was planted in long-plots; four rows wide and 30-inch row spacing. In Quincy and Citra, corn was planted in small plot trials, with four rows on a 36-inch row spacing in plots 20 feet long. All locations were managed for a target plant population of 32,000 plants per acre. The list of corn varieties planted in each location is described in Table 2.
–
Table 2: List of corn varieties planted in each location in 2025
–
Quincy
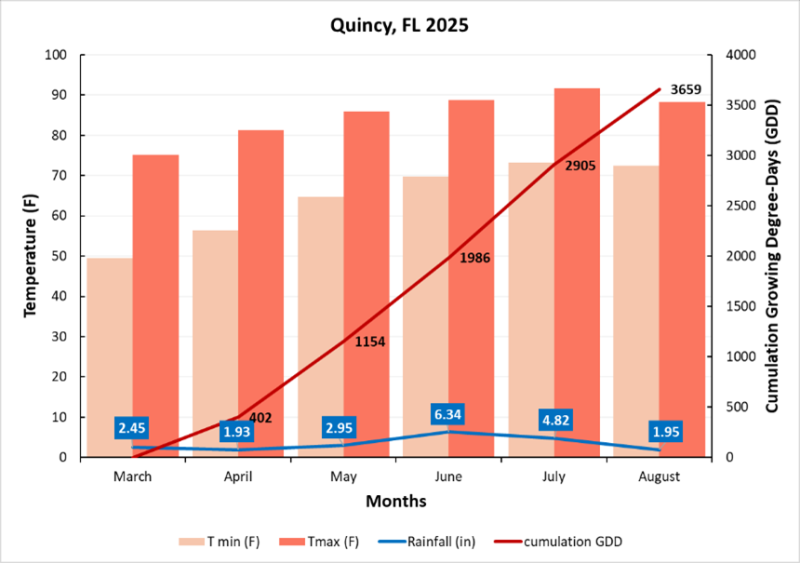
Figure 2 shows the monthly minimum and maximum temperatures, rainfall, and cumulative growing degree days (GDD). Minimum temperatures reached 50°F in March, while the highest temperatures occurred in July at 92°F. Rainfall was distributed throughout the growing season, with April being the driest month; supplemental irrigation from a center pivot supplied the additional water needed. Total rainfall was 20.44 inches, and irrigation contributed another 23.56 inches. All corn hybrids reached physiological maturity (black layer) during the last week of July, at approximately 2900 GDD.
–
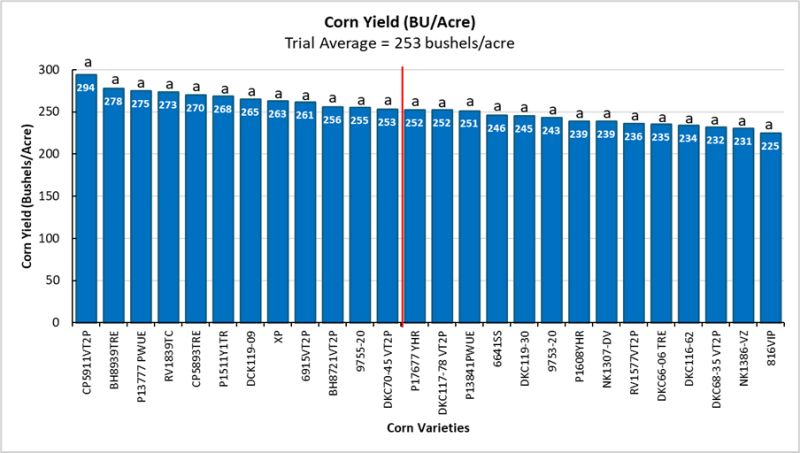
The total fertilizer used in Quincy was 239 lbs/ac N, 50 lbs/ac P, 75 lbs/ac K. Yield was collected at harvest using a plot combine. The two center rows of each plot were harvested, and grain weight and moisture were recorded. Final yield values were adjusted to 15.5% moisture. Figure 3 shows the yield for each corn variety for Quincy. The trial average yield was 253 bushel per acre.
–
–
Live Oak
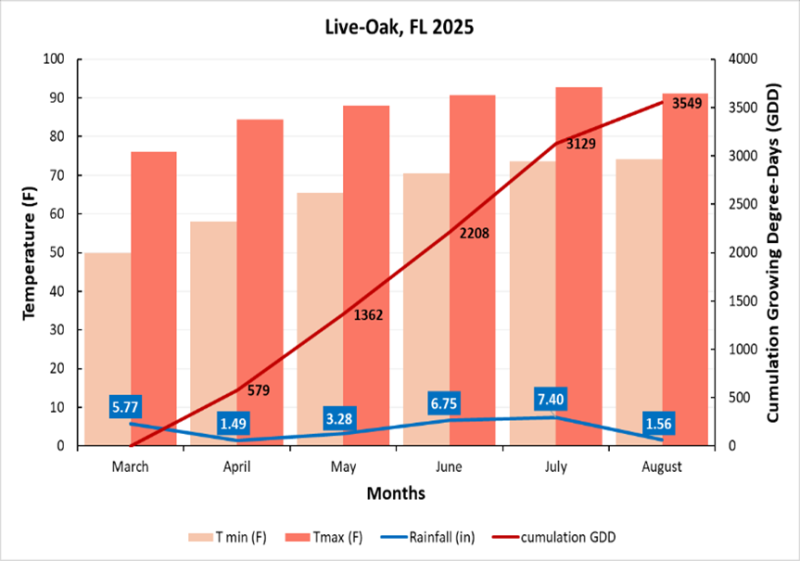
Figure 4 shows the monthly minimum and maximum temperatures, rainfall, and cumulative growing degree days (GDD). Minimum temperatures reached 50°F in March, while the highest temperatures occurred in July at 93°F. Rainfall was distributed throughout the growing season, with April being the driest month; supplemental irrigation from a center pivot supplied the additional water needed. Total rainfall was 26.25 inches, and irrigation contributed another 19.56 inches. All corn hybrids reached physiological maturity (black layer) during the last week of July, at approximately 2,900 GDD.
–
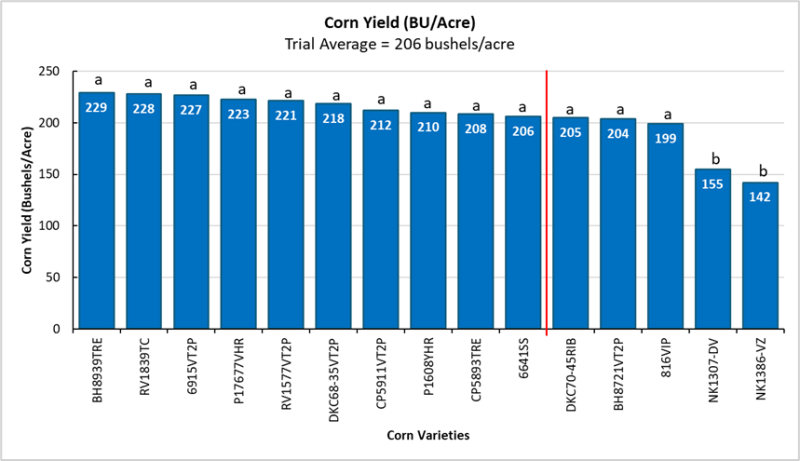
The total fertilizer used in Live Oak was 253.3 lbs/ac N (applied at planting, V5, V8, V12 R1 and R3 stages), 82 lbs/ac P, 178 lbs/ac K, 29 lbs/ac S. Yield was collected at harvest using a plot combine. The two center rows of each plot were harvested, and grain weight and moisture were recorded. Final yield values were adjusted to 15.5% moisture. Figure 5 shows the yield for each corn variety for Live Oak. The trial average yield was 206 bushel per acre.
–
Citra
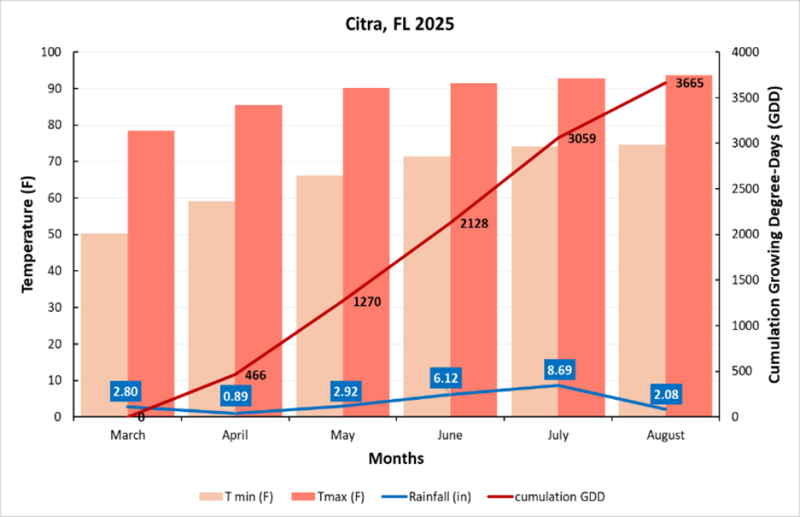
Figure 6 shows the monthly minimum and maximum temperatures, rainfall, and cumulative growing degree days (GDD). Minimum temperatures reached 50°F in March, while the highest temperatures occurred in August at 94°F. Rainfall was distributed throughout the growing season, with April being the driest month; supplemental irrigation from a center pivot supplied the additional water needed. Total rainfall was 23.5 inches, and irrigation contributed another 23.56 inches. All corn hybrids reached physiological maturity (black layer) during the last week of July, at approximately 3000 GDD.
–
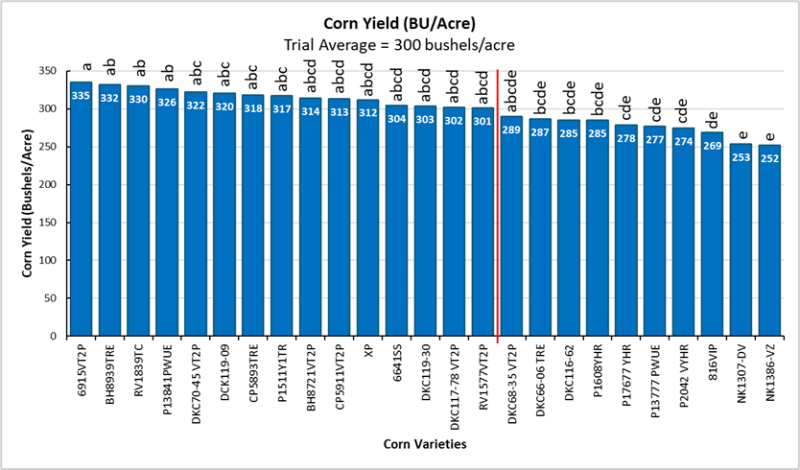
The total fertilizer used in Citra was 227 lbs/ac N, 216 lbs/ac K, 2 lbs/ac S. Yield was collected at harvest using a plot combine. The two center rows of each plot were harvested, and grain weight and moisture were recorded. Final yield values were adjusted to 15.5% moisture. Figure 7 shows the yield for each corn variety for Citra. The trial average yield was 300 bushel per acre.
- 2025 UF/IFAS Irrigated Corn Variety Trials Summary - November 21, 2025
- 2025 Cotton and Corn Variety Trials Underway in North Florida - May 30, 2025
- 2024 UF/IFAS Cotton Variety Test Summary - February 28, 2025

