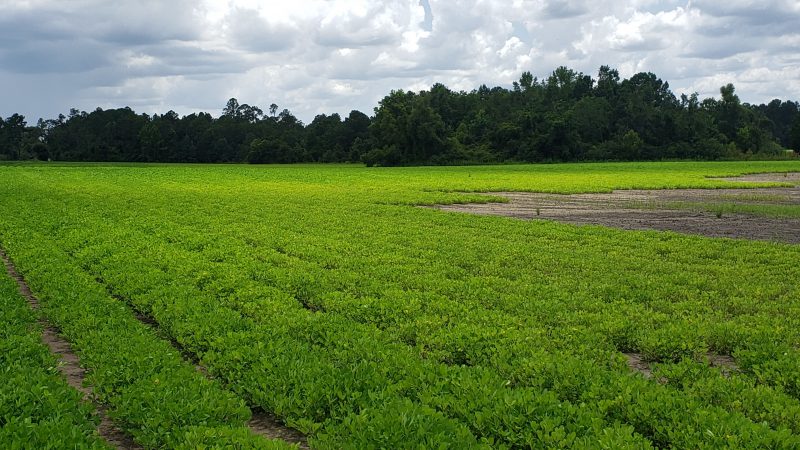
This field of Washington County peanuts is yellowed due to persistently saturated soils. Most fields in the county are showing this symptom, at least in the low areas. Photo Credit: Mark Mauldin, UF/IFAS
Mark Mauldin, Ag & Natural Resources Agent Washington County, Ethan Carter, Regional Crop IPM Agent, Dr. Barry Tillman Peanut Breeder UF/IFAS NFREC, and Camila Ichazo
I led off the last Peanut Update & aGDD Tracker with some comments to the effect that it was wet, but that wasn’t a big concern unless it stayed wet enough to keep sprayers out of fields for an extended period. I can’t speak definitively for the entire peanut producing region, but most of the fields in my county are even wetter now than when I made that statement – I guess I jinxed us all. Whether it’s been from Tropical Storm Elsa or just unrelenting daily showers, it’s wet.

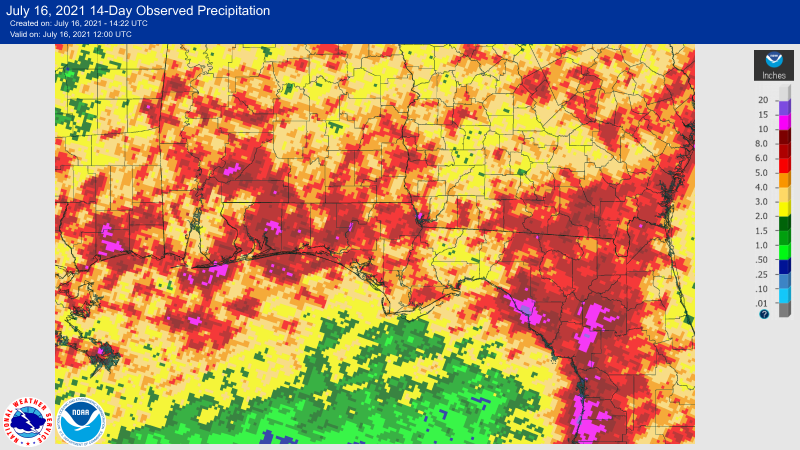
Over the last two weeks there has been considerable rainfall accumulation throughout the peanut producing region of Florida.
https://water.weather.gov/precip/
A quick review of plant pathology 101 and the disease triangle

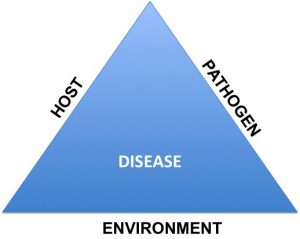
Figure 1. Disease triangle indicating interaction of the pathogen, host, and the environment leading to a plant disease
Credit: Mathews Paret
The disease triangle (Figure 1) illustrates that before disease becomes problematic three factors must be in place. 1) A pathogen(s) must be present. 2) A susceptible host must be present. 3) The environment must be conducive for disease proliferation.
Unfortunately, the current situation fits the disease triangle perfectly.
- We are far enough into the season that all the standard fungal pathogens are present at some level.
- Unprotected (because it’s too wet to spray) peanuts certainly qualify as a susceptible host.
- Warm and wet conditions are ideal for fugal growth. Much of the crop has closed the canopy, restricting airflow, further exacerbating the situation.
–
The following is my summary of comments provided by UF/IFAS Plant Pathologist Dr. Nick Dufault and UGA Plant Pathologist, Dr. Bob Kemerait regarding the current weather/disease scenario in peanuts.
-
Aggressive protective measures should be taken whenever possible, peanut disease will become increasingly problematic.
-
No matter what we do, we will probably see disease increases across the region. This doesn’t mean your spray didn’t work, but we may have to consider adjusting the program to enhance our management based on scouting.
-
Consider using multiple modes of action per application and/or try to use modes of action not previously used this season.
-
If applying azoxystrobin, pyraclostrobin, or tebuconazole, adding sulfur may be beneficial.
-
In some situations, reducing the spray interval (such as 10 days between applications) will enhance a disease management program.
-
When possible, ground applications of fungicide are more effective than aerial applications. Aerial applications can be helpful for leafspot, but they struggle with white mold and other soil borne diseases.
-
Due to reduced coverage (compared to ground applications), for aerial applications try to use products that will enter the leaves and re-disperse, products other than chlorothalonil, mancozeb, and copper which are strictly protectants.
-
Be on the lookout for rust (even if it typically is not an issue in your fields).
–
aGDD Tracker for the Florida Peanut Producing Region – 7/16/21 edition
The aGDD Tracker is compiled from data generated by PeanutFARM.org. The dark blue bars in the cells with the aGDD values indicates progress towards 2500 aGDDs. The extends to the right as aGDDs are accumulated. The entire cell will be dark blue when a field has accumulated 2500 aGDDs. It is recommended that fields be sampled and exact days-to-harvest be determined via pod-blasting once a field reaches 2300 aGDDs.
–
With heat and moisture in abundance we see all locations and planting dates accumulating aGDDs rapidly. As expected, the later planting dates average more aGDDs per calendar day since planting than do the earlier planting dates (3/17 plants average 14.3 aGDDs/calendar day and 6/16 plantings average 20.4 aGDDs/calendar day). This discrepancy is due to cooler temperatures earlier in the season and perhaps some drought stress in the rain fed fields back in May. Over the last 15 days (since the data was generated for the previous Tracker) the earliest and latest planted fields have both averaged almost exactly 20 aGDDs accumulated each calendar day. At this rate of accumulation, in two weeks, when the next Tracker is published, it should be time to start pod-blasting and boarding samples from the earliest planted irrigated fields.
Use the Tracker to approximate how your fields are progressing by following the fields on the Tracker that are the most similar to yours in terms of planting date, location and irrigation status. For more precise tracking of your fields got to PeanutFARM.org and set up your fields in the system. You will be able to enter field specific rainfall/irrigation data and soil type. Temperature data will come from the closest FAWN weather station.
–
- 2026 Florida Bull Test Sale – Performance Data Evaluation Simplified - January 9, 2026
- Panhandle Corn & Soybean Update Friday – February 6 - January 9, 2026
- Peanut Maturity Update – 10/9/25 - October 10, 2025

