
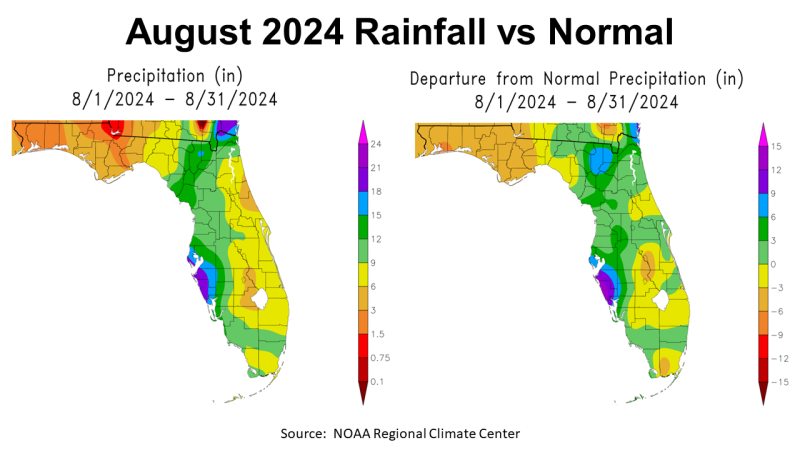
Rainfall
August was really hot and dry for much of the Panhandle, as Hurricane Debby sucked all of the moisture out of the Gulf and dumped it on Southeast Georgia and South Carolina. Looking at the maps above, the divide between the areas that got drenched or bypassed by Debby is very evident. In the map above to the left you see the estimated rainfall for August 2024 in North Florida ranged from 0.75″ to 1.5″ in red, 1.5″ to 3.5″ orange, 3′ to 6″ gold, 6″ to 9″ yellow, 9″ to 12″ light green, and 12″ to 15″ dark green. It was interesting too that more rain fell in the Tampa Bay area than where the storm made landfall. In the map to the right you see how the rainfall in August 2024 compared to historic average. Most of the Panhandle was in the gold range of -3″ to -6″ below average, or in yellow that was 0″ to -3″ below average.
–
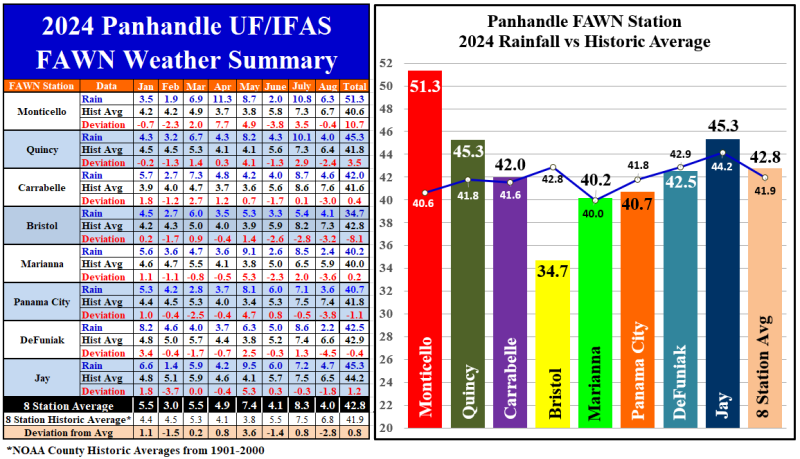
The data from the eight Florida Automated Weather Network (FAWN) Stations provided a more precise comparison of the variation in rainfall from August 2024. The wettest location was once again in Monticello, where 6.3″ was recorded, but was -0.4″ below historic average for August. Only 2.2″ was recorded in DeFuniak Springs, which was -4.5″ below normal for the month. The average of all eight stations was 4.7″, that was -1.8″ below average.
Through eight months of 2024, the station in Monticello has recorded a whopping 51.3″, which was 10.7″ above historic average for the year so far. Contrast that with only 34.7″ in Bristol, which was -8.1″ below normal. The average of all eight FAWN stations through eight months was 42.8″, which was 0.8″ above average to this point.
–
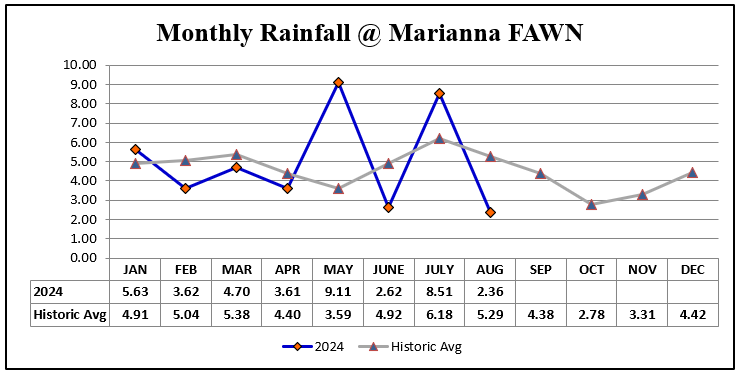
Averages don’t tell the whole story though. According to NOAA’s historic average for Jackson County, the FAWN Station is 0.2″ above average through 8 months in 2024. Based on the actual historic rainfall data at the Marianna FAWN Station from 1952-2024, the site is 0.46″ above average. In the chart above however, you can see how a near average rainfall year is misleading, because there was higher than average rainfall in May and July that were completely dried up in both June and August. When the rain comes many time matters more than the total for the year.
–
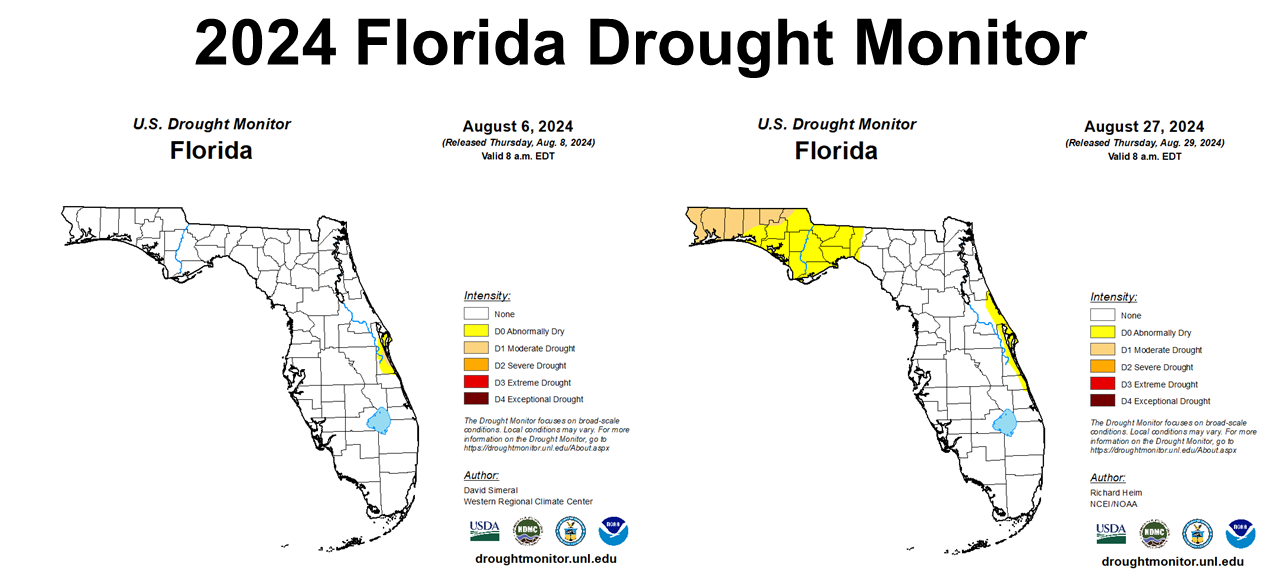
At the beginning of August, there were only a few counties on the east coast of Florida that were in the Abnormally Dry category of the Drought monitor. Crops and pastures in the Panhandle were doing quite well. By the end of the month, the entire Panhandle was either Abnormally Dry D0 (yellow) or in Moderate Drought D1 (tan). This is not surprising as we had Flash Drought (the combination of high temperatures over 95° plus limited rainfall) in the back half of the month. Again, it is not the total rainfall for the year that is most important, butconsistent rainfall through the year. Clearly from the map above, the Panhandle was very dry and included in the drought monitor at the end of August.
–
Temperature
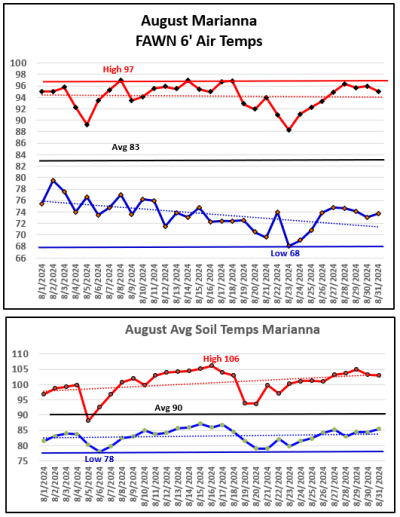 As mentioned earlier, August 2024 was a another hot month. The charts to the right show the air and soil temperatures measured at the Marianna FAWN Station in August. While there were no triple digit high days, there were 15 days with highs above 95°. The high for the month was 97° at the six foot height on August 8 & 14. The low for the month was 68° on August 23rd, which was the first morning low in the 60s since June 22nd. That false fall did not last long as the lows returned to the 70s through the end of the month. The average air temperature was 83°, which was the highest average month for they year thus far.
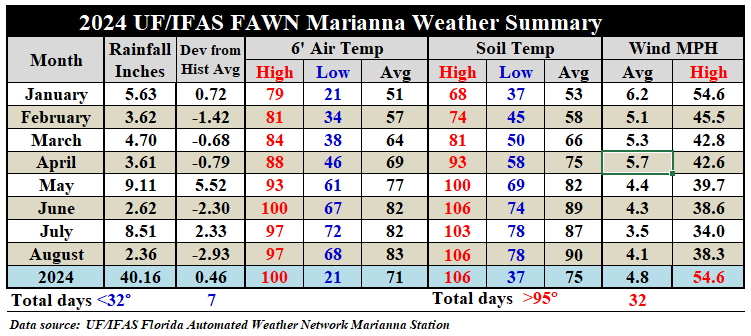
Soils were scorching hot too, reaching a peak of 106° at the -4″ depth on August 16th. The low soil temperature in August was 78° on August 6th. The average soil temperature was 90° for the month, which also the highest monthly average of the year. When you look at the chart below, you can see how the monthly air and soil temperatures have steadily climbed. It has clearly been a hot summer, with a total of 32 days above 95° in Marianna thus far.
 –
–
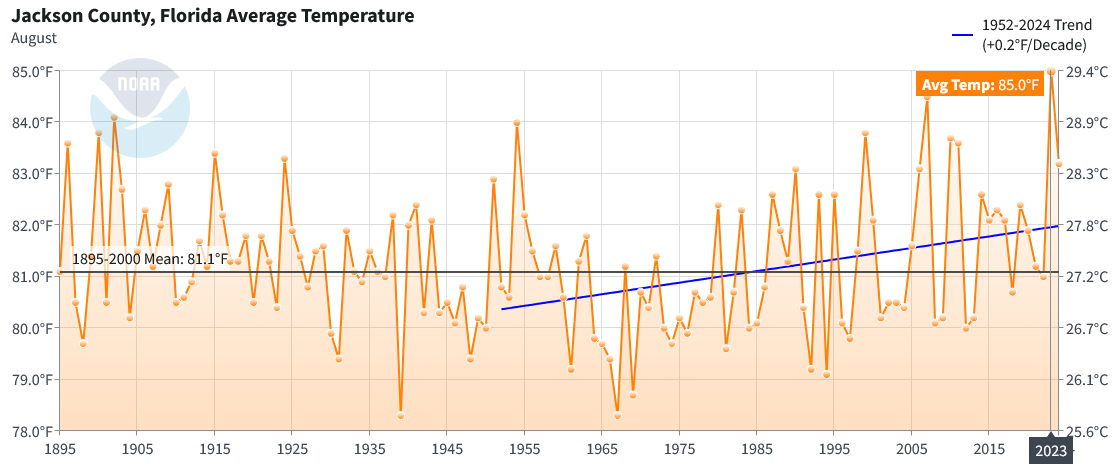
As hot as was in August 2024, it was not as bad as last year. According to NOAA, Jackson County had a record average air temperature of 85°in August 2023.. Even so the 83.2° average in 2024, was well above historic average of 81.1°. The blue trend line shows the time-frame of weather data collection at the Marianna Research Station. The general trend that August has been 0.2° warmer each decade, but there was considerable variation on an annual basis.
–
Harvest Season Outlook
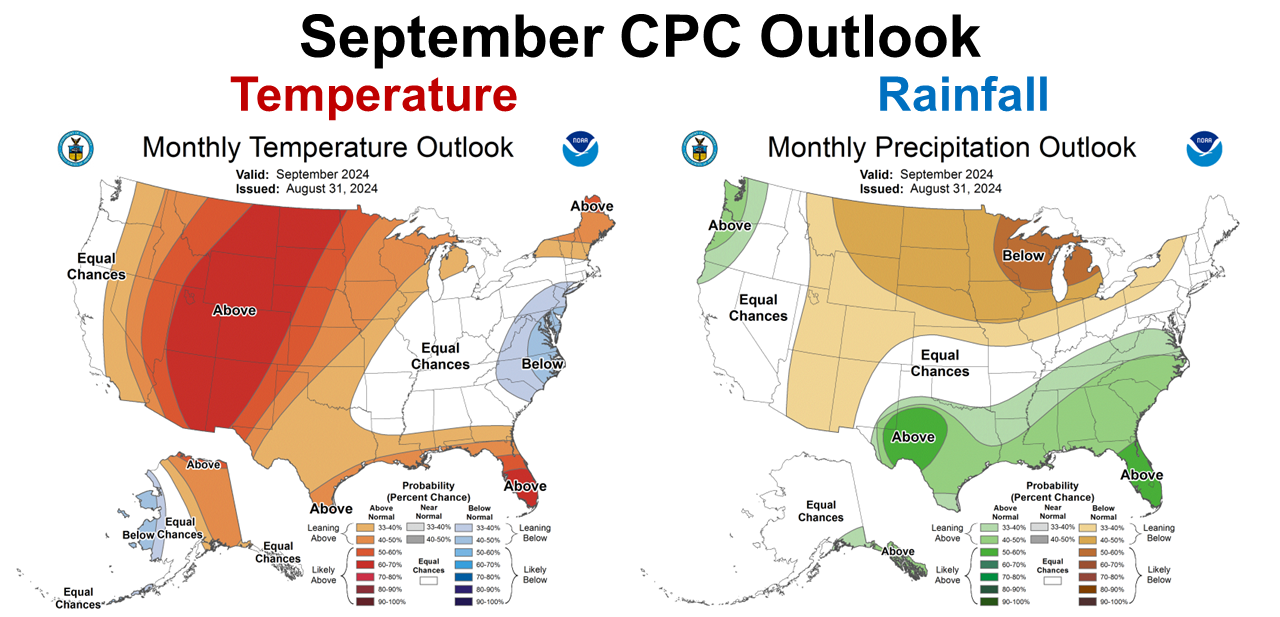
The Climate Predication Center (CPC) is expecting that all across the Southeastern and Gulf states will stay hotter than normal but will also have above average rainfall in September. The CPC had a similar forecast of above average rainfall for both June and August that were not correct. They were right in May and July. Let’s hope that they are right again in September.
–
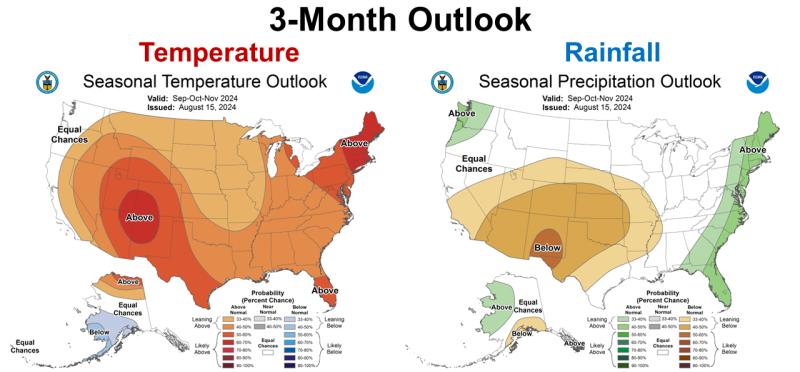
The CPC’s three-month, September through November outlook is similar with slightly less certainty for above average rainfall for the total three-month period of September through November.
– La Niña Watch
The CPC anounced yesterday that we remained in the Neutral ENSO phase through August, but anticipates transition to a week La Niña in the coming months. In the NOAA chart above, you can see the greatest probability (75%+) of La Niña is expected in the October through February time period.
ENSO-neutral continued during August 2024, with near-average sea surface temperatures (SSTs) observed across most of the equatorial Pacific Ocean. The weekly Niño indices did not change substantially during the month…The IRI plume predicts a weak and a short duration La Niña, as indicated by the Niño-3.4 index values less than -0.5°C. This month, the team relies more on the latest North American Multi-Model Ensemble (NMME) guidance, which predicts La Niña to emerge in the next couple of months and continue through the Northern Hemisphere winter. The continuation of negative subsurface temperatures and enhanced low-level easterly wind anomalies supports the formation of a weak La Niña. A weaker La Niña implies that it would be less likely to result in conventional winter impacts, though predictable signals could still influence the forecast guidance. In summary, La Niña is favored to emerge in September-November (71% chance) and is expected to persist through January-March 2025. Climate Prediction Center September ENSO Diagnostic Discussion
–
What does this mean for Panhandle farmers and ranchers?
It is really hard to predict the climate for the upcoming fall and winter climate. A weak La Niña will limit the effect ENSO phase has on our climate during the cool season. The CPC has only been right 50% on their monthly outlook predictions for rainfall the last four months in the Panhandle, but they nailed the higher than average temperatures. September is off to a nice start for the western counties, due to the outer bands of Hurricane Francine, but we all know how quickly soils can dry out again. October and November tend to be drier months, so I think the hot and dry growing season will continue unless a tropical system interrupts that trend. This could be good for hay and crop harvest, but may make planting cool-season forages and cover crops more challenging. I would definitely target low lying fields or ones with good water holding capacity for planting cool-season crops. Other than Monticello and Quincy, the rest of the Panhandle has been pretty dry to close out the growing season, so I am expecting this trend to continue in the coming months, but I like pleasant surprises.

demayo@ufl.edu - 850-482-9620
Follow me on Twitter
@UFCowman
- November 2025 Weather Summary & Winter Outlook - December 5, 2025
- Friday Feature: The History of Beekeeping - December 5, 2025
- Friday Feature:Malone Pecan Festival Tractorcade - November 21, 2025