by Doug Mayo | Mar 9, 2018
Talk about a tale of two months. It seemed like we went from winter to spring in just one month. In the Panhandle, January 2018 was a pretty normal winter month, temperature wise, but was much drier than normal. February 2018 set records for the warmest February...
by Doug Mayo | Mar 2, 2018
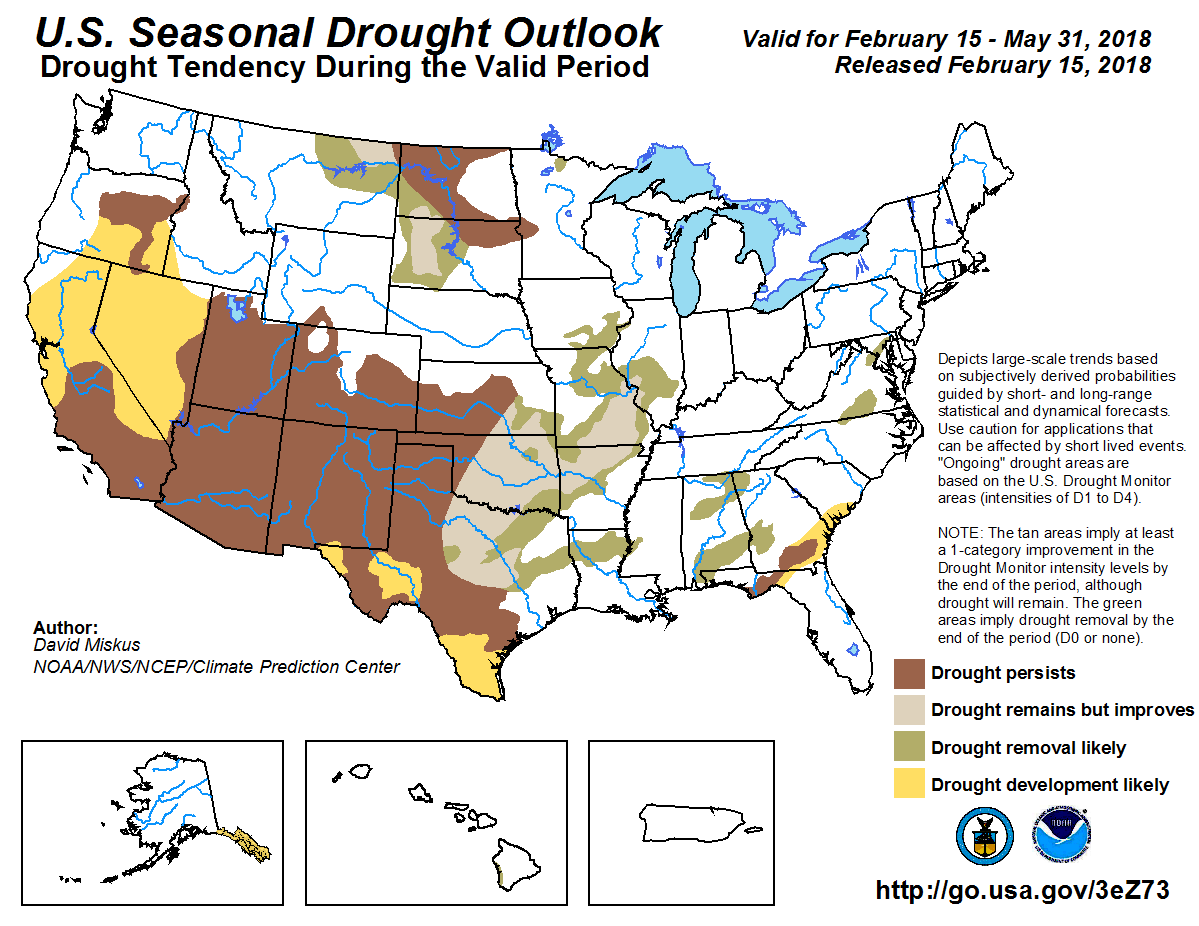
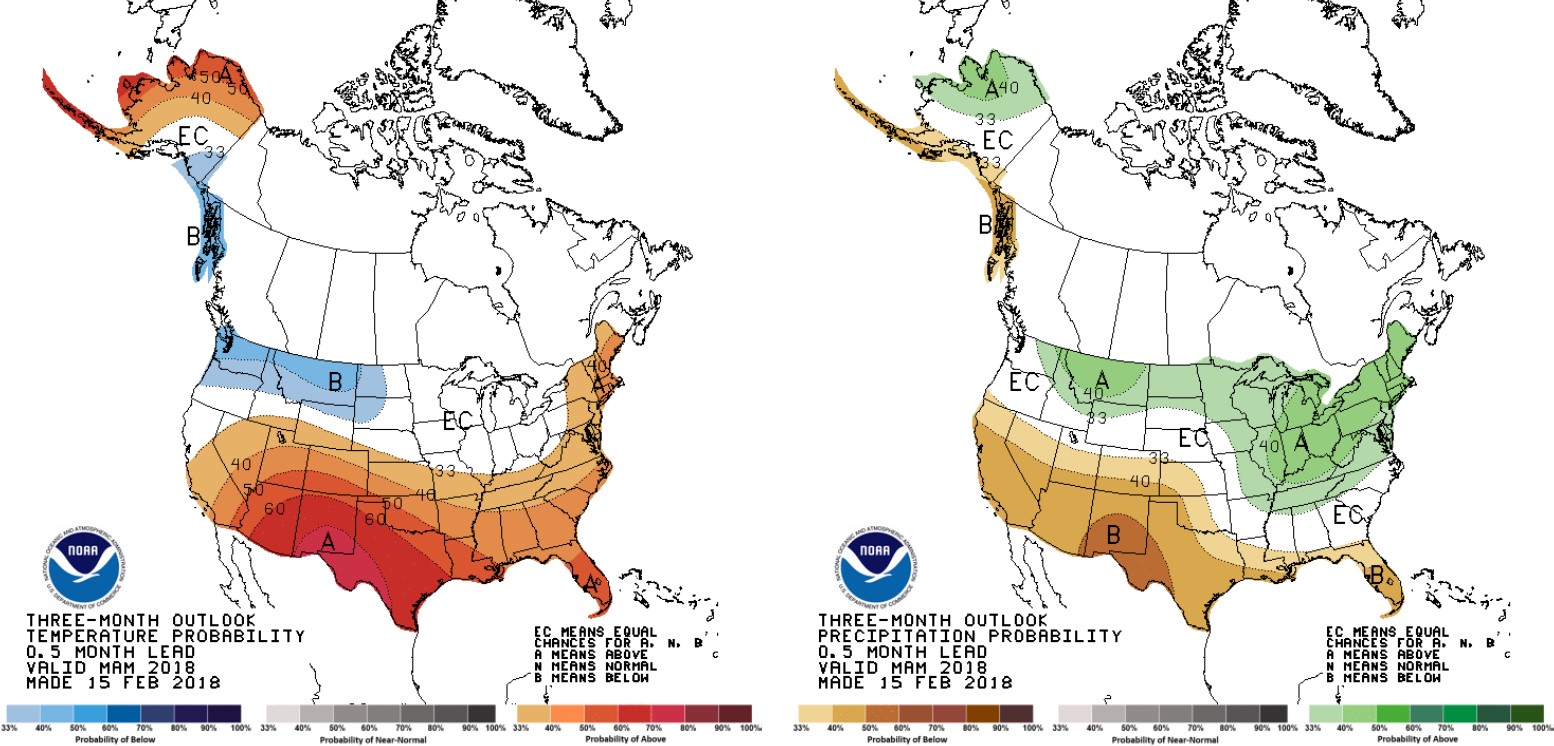
Clyde W. Fraisse, Ph.D., Associate Professor & Extension Specialist, Agricultural & Biological Engineering, University of Florida – IFAS – http://agroclimate.org/ March 1, 2018, La Niña conditions are present in the tropical Pacific Ocean and...
by Chris Prevatt | Jan 19, 2018
Weather had a dramatic impact on range, pasture, and hay production in the Southern Region in 2017. The dramatic extremes of excessive rainfall received in Texas and Florida from hurricanes, to abnormally dry and moderate drought conditions across the Southern U.S....
by Doug Mayo | Jan 5, 2018
2017 Annual Weather Summary There was considerable variation in the annual rainfall across the Panhandle in 2017. The graphic above shows National Weather Service’s estimated annual rainfall for the Florida Panhandle Counties. Areas in purple received more than...
by Doug Mayo | Oct 20, 2017
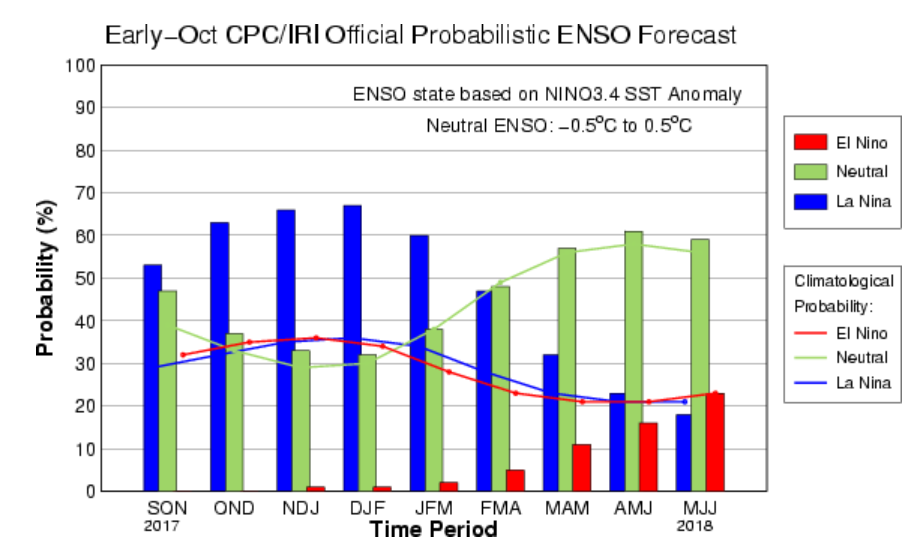
Clyde Fraisse, AgroClimate Project Director While ENSO-Neutral conditions are still present in the Pacific Ocean, a La Niña Watch was issued by the NOAA Climate Prediction Center (CPC) on October 9, 2017. The chances for a La Nina to develop this Fall are...
by Doug Mayo | Oct 13, 2017
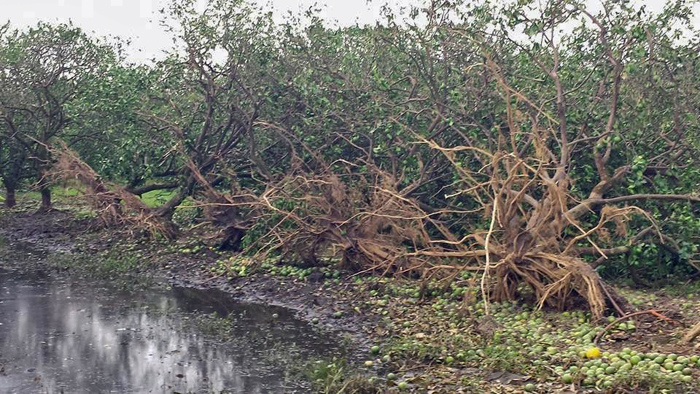
Source: Florida Department of Agriculture and Consumer Services Florida Commissioner of Agriculture Adam H. Putnam announced on October 4, 2017 that the preliminary agricultural damages caused by Hurricane Irma in Florida total more than $2.5 billion. In an initial...
