by Doug Mayo | Jan 6, 2017
December brought quite a change from the previous months of drought. The National Weather Service estimates for rainfall ranged from isolated locations with over 15″ (purple), large regions with over 10″ (hot pink), to less than 4″ along the coast...
by Jennifer Bearden | Dec 2, 2016
Herbicide failures are common during extended dry periods. This is frustrating for the pesticide applicator due to wasted time and chemicals. There are logical reasons why certain herbicides fail during droughts. There are two main reasons why herbicides fail in...

by Doug Mayo | Dec 2, 2016
November was a very dry month across the Florida Panhandle. For a good portion of the region the limited rain that fell came on November 30, the very last day of the month from a single cold front. For the month, the vast majority of the region received less than...
by Mark Mauldin | Nov 4, 2016
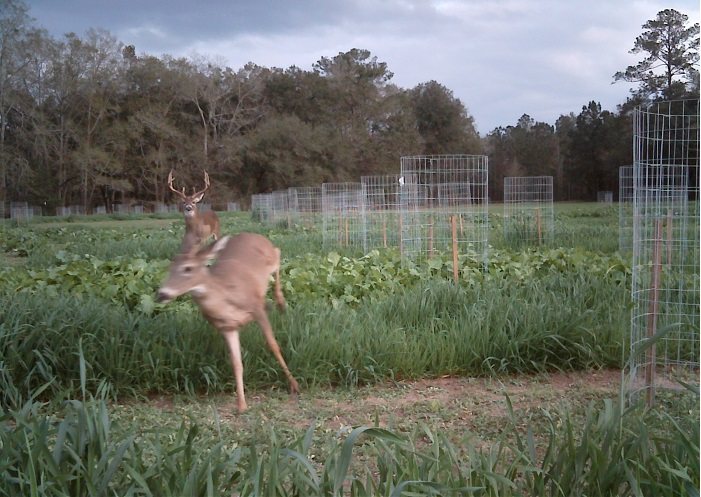
It should be too late in the year for an article about cool season food plots; they should already be up and growing, at the very least planted. It’s November, archery season has begun, the fall food plot ship should have already sailed. However, due to the incredibly...
by Doug Mayo | Nov 4, 2016
October Summary October is historically one of the driest months of the year in the Florida Panhandle. Much of the western portion of the Panhandle, however, was “O-for-October,” with little to no rainfall this year. Northern Jefferson County did receive...
by Doug Mayo | Oct 7, 2016
September rainfall was greatly influenced by Hurricane Hermine. The eastern Panhandle Counties had significantly more rainfall in the month of September. September totals ranged from over 10″ (pink) in portions of Franklin, Leon, and Jefferson County to a low...
