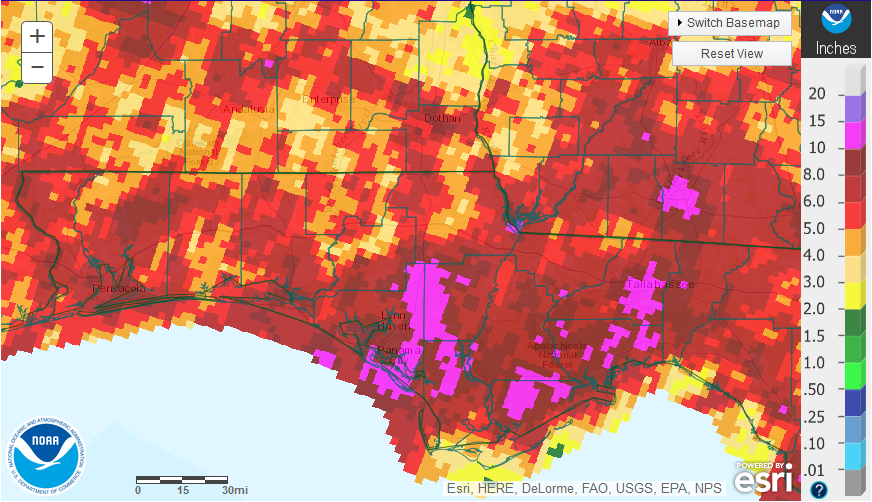
by Doug Mayo | Oct 7, 2016
September rainfall was greatly influenced by Hurricane Hermine. The eastern Panhandle Counties had significantly more rainfall in the month of September. September totals ranged from over 10″ (pink) in portions of Franklin, Leon, and Jefferson County to a low...
by Doug Mayo | Sep 2, 2016
For much of the Panhandle August was an improvement over July with more adequate rainfall scattered across the region. Portions of the coastal counties received over 10″ (hot pink), while there were a number of inland pockets that received less than 4″...
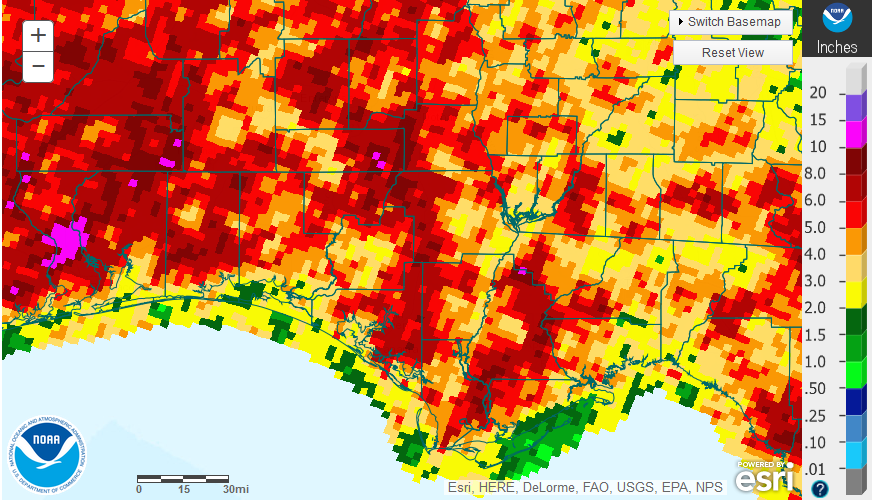
by Doug Mayo | Aug 5, 2016
Typically, July in the Florida Panhandle is the wettest month of the year with 6-7″ of rainfall. In the graphic above, areas that are hot pink or dark red did receive over 6″ in July, but this was not the case for many central and eastern counties. The...
by Doug Mayo | Jul 15, 2016
June 2016 was fairly typical for the Florida Panhandle with much warmer temperatures and scattered afternoon thunderstorms with highly variable rainfall. In the graphic above you can see the hot pink areas that received more than 10″ and dark red regions that...
by Nicholas Dufault | Jun 10, 2016
Nicholas Dufault and Rebecca Barocco, UF-IFAS Dept. of Plant Pathology Back in 2013, the Suwannee Valley as well as other parts of the southeastern U.S. were hit with 10 to 25 inches of rainfall in the month of June, which was partly related to Tropical Storm Andrea....
by Doug Mayo | Jun 10, 2016
May Rainfall May was a more typical rainfall month for the Panhandle with El Niño disappearing. In the graphic above you can see that only small portions of northern Escambia and Santa Rosa Counties received more than 8″ for the month, while the areas in green...
