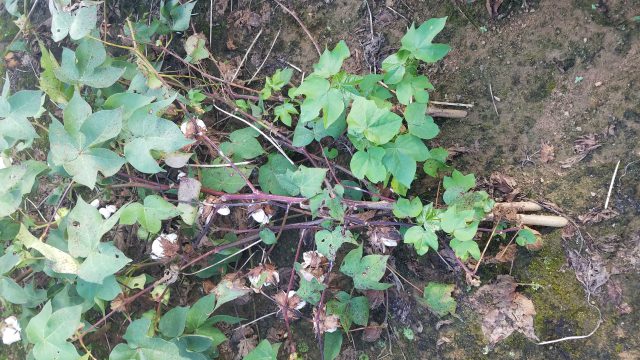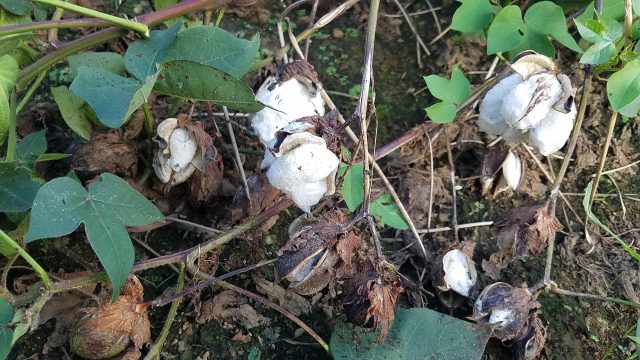
Cotton laid down in the field by Tropical Storm Gordon.
For most row crop growers in Florida, Tropical Storm Gordon had minimal impact. However, in the westernmost part of the state, much of the cotton suffered significant damage. Though the winds were not extremely strong, the combination of saturated soils and winds wreaked havoc on what had looked like a stellar cotton crop.
The western Panhandle had been blessed with ample rains throughout the summer. Prior to T.S. Gordon making landfall on September 3, many farmers were excited about the prospective yields for their 2018 cotton crop. In northern Escambia County, farmers reported rainfall ranging from 7-11 inches. Though the area did not receive a long period of high winds, the combination of waterlogged soils and wind caused a great deal of lodging in cotton that was nearing full maturity almost ready to be defoliated. Canopies heavy with loaded bolls and wet leaves laid down on damp soil and have not since righted their position. The bolls touching wet ground have rotted off the plant. The plants are matted throughout the field. Many farmers have shared their concerns with the difficulty of defoliating a field that has cotton laying across the row middles.

Though the winds from T.S. Gordon died down within 24 hours, the rains continued. It has continued to rain regularly since September 3rd. Not only is the cotton worse for wear, but peanut harvest has been steadily delayed by the rains. Greg Phillips, manager of Birdsong Peanuts-McCullough, said “Peanut harvest in the area has been greatly slowed by the rain.” He estimates that around 7% of the entire crop has been harvested, whereas if the weather conditions had been favorable, 15% of the year’s crop would been harvested by this time. He does report good grades so far, but he is concerned that further delays might cause a decline in both yield and grades.
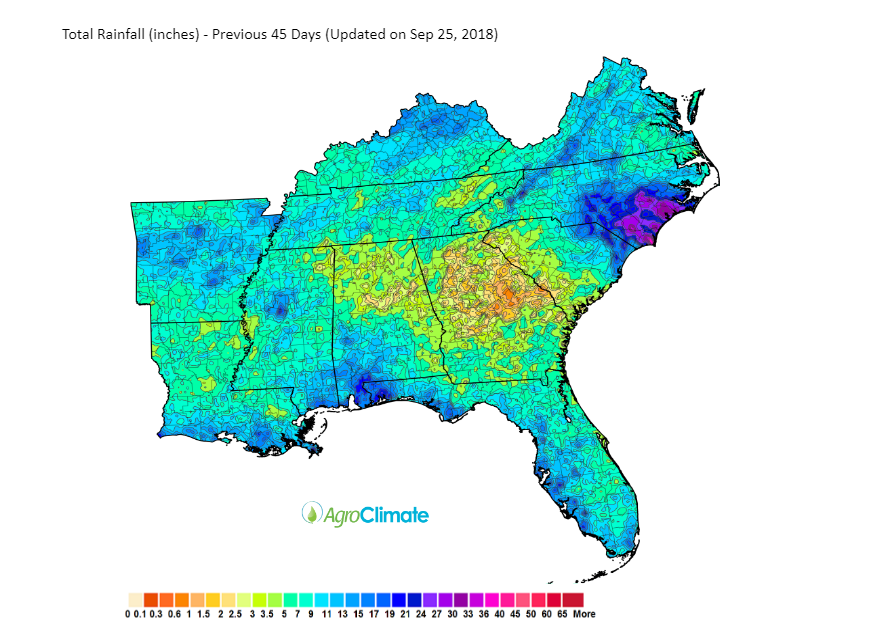
The Agroclimate image below shows the total rainfall in inches from August 13th to September 25th. It is evident that the western Panhandle and Lower Alabama have received ample amounts of rain, but the story that it doesn’t tell is that all of this rainfall is coming at a time of year when conditions are generally starting to dry out for harvesting.

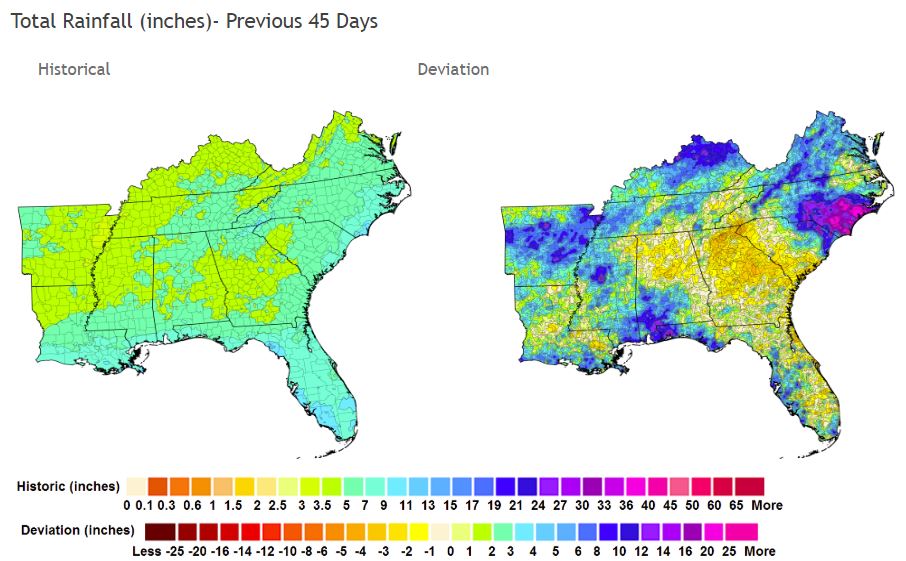
The image below from Agroclimate provides a good comparison of rainfall totals from the past 45 days to September 25. The map of the southeast on the left shows the historical average rainfall for this time of year The more colorful map of the southeast on the right shows the deviation from “normal” rainfall amounts. In the case of late summer 2018, T.S. Gordon brought in much higher than average rainfall in the areas shaded in blue and purple.

It will take some time to know the full extent of the impact from T.S. Gordon. Crop damage appears significant, but the full effects will not be known until after the completion of the 2018 crop harvest.
