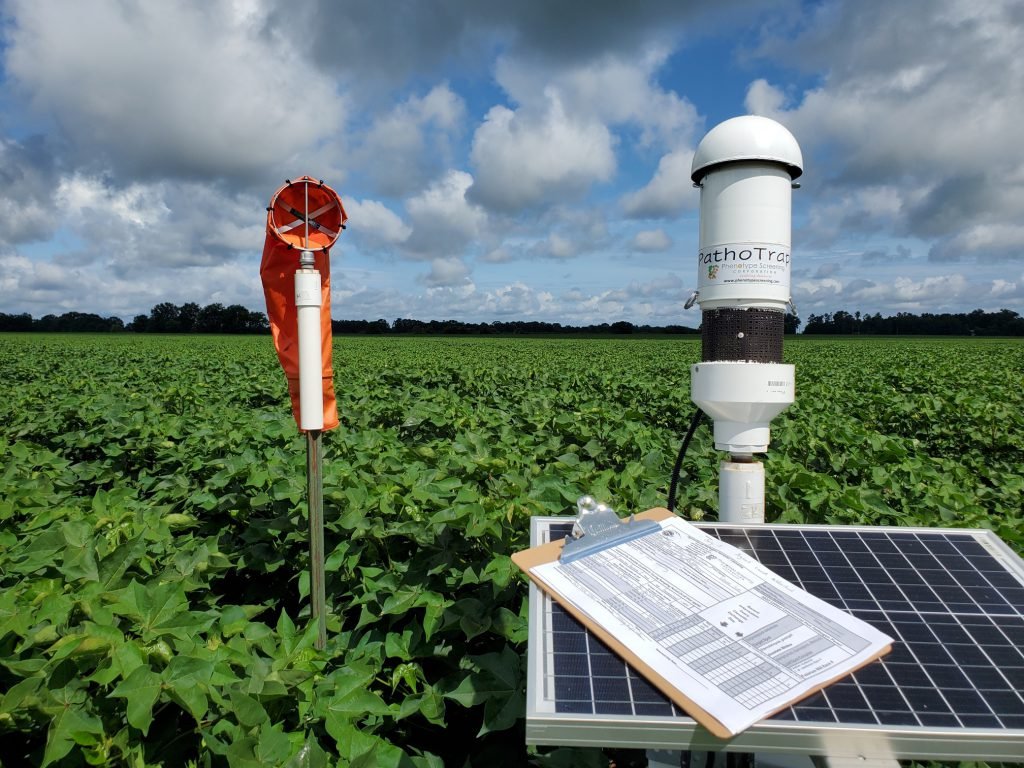
Active and passive air samplers, solar panel, and information sheet in the field
On a beautiful August morning, I spent some time in a dryland cotton field at the corner of Highway 197 and Highway 89 in Santa Rosa County, and felt very welcomed by the local farmers via the multitude of honks and waves. I’m guessing some of you might be wondering what I was doing in Lewie Joe Smith’s field? Why are there windsocks in his cotton field?
The cotton field oddities are part of a large research project. I’m not the only one in the Panhandle involved in the project; Ethan Carter in Jackson County, and Dr. Small and Kelly O’Brien at the NFREC Quincy are all participating, as well as other people throughout the Southeast. Collectively we are working on the “National Predictive Modeling Tool Initiative (NPMTI).” There are several various objectives in this initiative, but Ethan and I are working specifically in commercial fields.
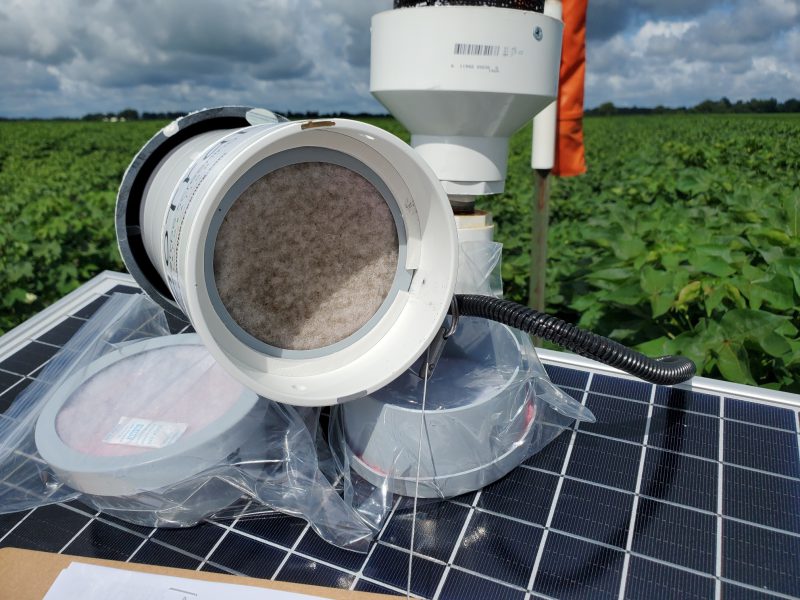
In commercial fields, like Lewie Joe’s, we will collect airborne spores to validate models and demonstrate the utility of pathogen sampling in a commercial grower situation. We are collecting spores through both tall passive air sampler (there is a cassette in the windsock) and in an active air sampler that is run by solar power and is pulling air in through a cassette at all times. We installed air samplers at two opposing locations (1 downwind and 1 upwind) in two commercial cotton fields in each of 6 collaborator states. Sampler cassettes will be changed out weekly. All cassettes from all sites will be processed for quantification of Target Spot (Corynespora cassiicola). All samples from six sites (UF, UGA, Auburn, LSU, MSU, Clemson) will be processed for Areolate Mildew (Ramulariopsis gossypii). Hourly weather data and GIS data on field site, soil type, nearby crop usage will be provided by our data aggregator.
For Lewie Joe’s field, I have to gather the following information to provide to the researchers:
- Planting date
- Variety
- Row spacing
- First bloom date
- Fungicide application(s) by grower (product/rate/date)
- Defoliation date
- Harvest date
- Yield data (from yield monitor or field ticket)

Cassettes still in the bags, and the cassette installed in the active air sampler.
=
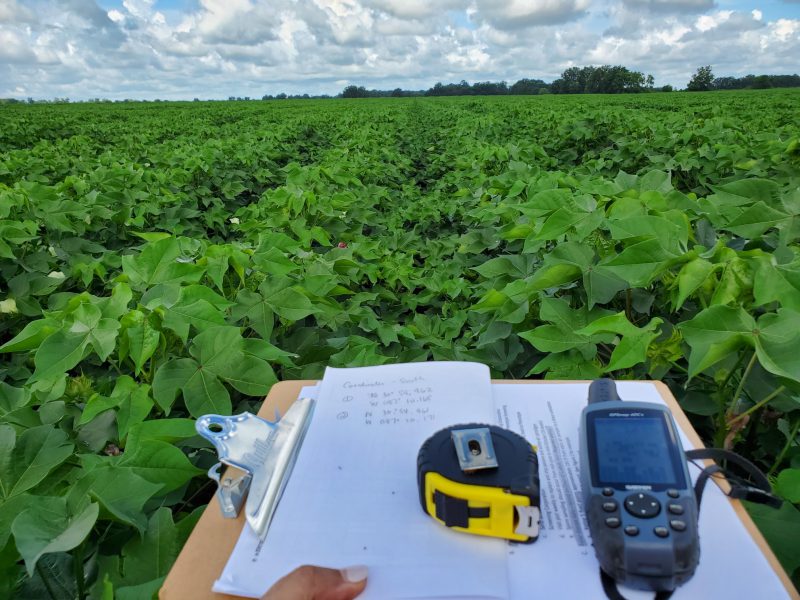
Many of you saw me by the air samplers, changing out cassettes, but that’s not all there is to the project. I also get to tromp down a row and look at plants that have been GPS marked and evaluate them throughout the season. Weekly I will evaluate the plants and measure the following:
- Rating 5 fixed points 150 ft from each air sampler in a linear orientation with the row (30 ft apart)
- Points to be marked by GPS and flagged
- Target spot incidence and severity (all locations)
- Leaf spot complex incidence and severity (all locations)
- Areolate/Ramularia mildew incidence and severity

Using GPS, information sheet, and a tape measure to find specific areas in the field.
=
I know some of you are reading this and wondering, when might I be able to honk at Libbie in this field? Guess what, every Tuesday morning I’m going to strive to be in the field around 10:00 AM. I need to visit weekly to collect disease symptoms, limited crop phenology, and to replace passive air sampler throughout the growing season. I have to ship off the cassettes and data weekly, so I hope to get more honks and waves. Feel free to pull over and chat. I would always welcome another hand to hold a cassette. I would also like to thank Lewie Joe, one of Florida’s representatives for Cotton Incorporated, for letting me use his field for this project.
