Don Shurley, UGA Professor Emeritus of Cotton Economics
–
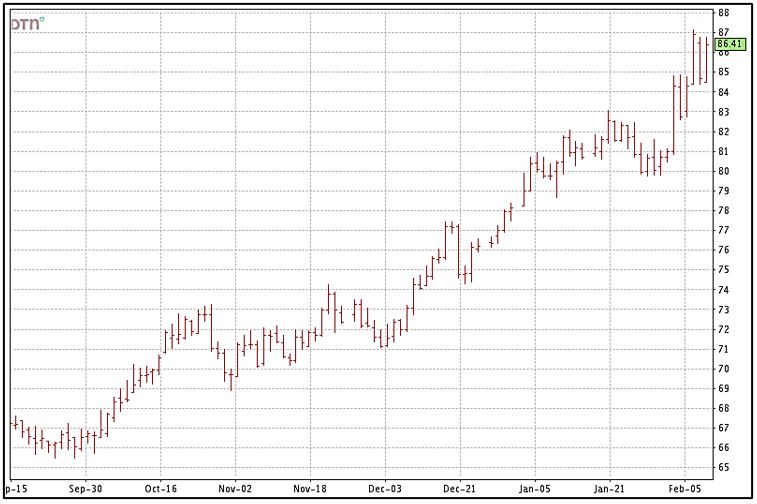
Cotton prices have been highly variable (wild) over the past week or more with triple digit moves up and down for 6 consecutive days Feb 4-11. Typically, this can be a sign of market surprises (good or bad) and/or nervousness. Prices continued up today with old crop March futures breaking 87 cents and new crop December just under 84 cents.
–
On Tuesday, USDA released its monthly US and World supply/demand projections for February.
- It was expected the size of the 2020 US crop might be revised down slightly. It was not and remains at 14.95 million bales.
- As hoped and expected, US exports for the 2020 crop marketing year were raised from 15.25 to 15.5 million bales. It is possible and likely this could be raised more in future reports.
- US ending stocks were trimmed 300,000 bales.
- World production was raised a net 1.27 million bales. China’s production for 2020 was raised 1.5 million bales.
- But offsetting this, World demand/Use was raised 1.48 million bales from the January estimate. Increases were made for India, China, Turkey, Pakistan, and Bangladesh.
- Imports for China, even with the higher production, were increased ½ million bales.
- It’s worth noting that China’s ending stocks are now raised 1 million bales from the January estimate.
On Wednesday, the National Cotton Council released results of their 2021 planting intentions survey. Individual state numbers were released on Thursday. The survey suggests that the US will plant 11.47 million acres this year—down 5.2%. It has been expected that acres will likely be down this year so this should come as no surprise. The move to 80 cents could impact that. Looking at individual state numbers, my first reaction was that some of the decreases seemed small given all the high corn and soybean price talk recently. But then we have to remember that cotton acreage was down in 2020 already.
There is little doubt that corn, soybeans, grain sorghum, and peanuts may take acres from cotton in some situations. I know here in Georgia, for example, with our strong basis on corn, corn acres are very likely to increase. I am told that peanut prices are also up and attractive. But rotation may be an issue in some cases.
–
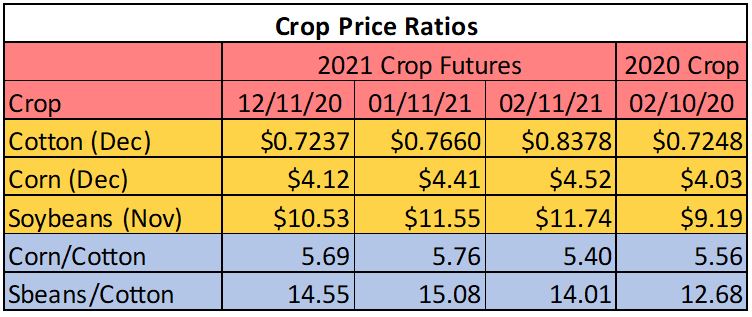
Both corn and soybeans have lost ground to cotton over the past month based on comparative prices (price ratios have declined). The current price ratios are better than last year this time for soybeans but lower for corn.
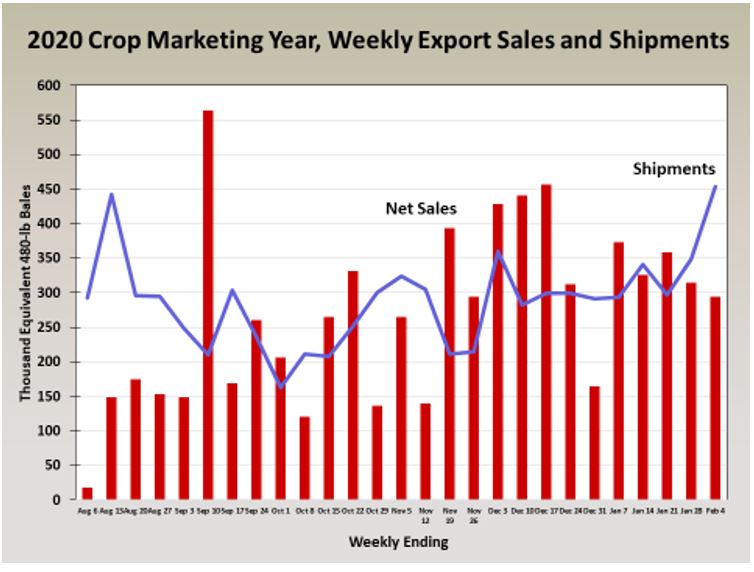
This week’s export report showed shipments the highest yet for the year. But sales were down for the second week in a row.
–
The USDA Outlook Forum will be held next week February 18-19. This will be the first look at US and World forecasts for the 2021 crop. Key factors will include the demand/Use outlook for the 2021 crop year.
–