

Dr. Steve Brown, Auburn University
Dr. Steve Brown, Auburn Cotton Agronomist
–
The high cost of seed (and technology) compel a hard look at reduced seeding rates. The broad compensatory nature of cotton – the ability to make comparable yields across a range of plant populations – affords that opportunity.
In 2019, scientists from Texas A&M reviewed all the formally published cotton seeding rate trials dating back to 2000. Of 15 global experiments, 12 were in the U.S. and included sites from Georgia, Mississippi, Tennessee and Texas. Keep in mind that an experiment involves multiple years and/or locations. Analysis of the data indicated that yield reductions were not observed until plant populations declined below 15,000 plants/A. For a standard 36-in row spacing, that’s about 1 plant/ft. Note, that is 1 plant not 1 seed/ft. Obviously, that’s way below what any producer should plant. More on that later.
In recent Alabama trials, we’ve observed emergence ranging from the upper 70s to the lower 90s in terms of percent stand versus seed planted. Stated differently, from 100 seed planted, we expect something like 75 to 92 plants to emerge to a stand. In 2020, we conducted seeding rate trials at Brewton and Headland. Targeted rates ranged from 1.0 to 3.0 seed/ft. Of particular focus was the lower end of the spectrum. We sought to plant 1 seed every 4, 5, 6, 7, 8, 10 and 12 inches; or stated on a per foot base, 3.0, 2.4, 2.0, 1.7, 1.5, 1.2 and 1.0 seed/ft. Varieties were DP 2055 B3XF and PHY 400 W3FE. At Brewton, we achieved the 4 higher populations by adjusting drive sprockets on the planter, and the 3 lower rates were attained by hand thinning. At Headland, rates were established using a John Deere 7100 planter with Precision eSet on per acre basis.
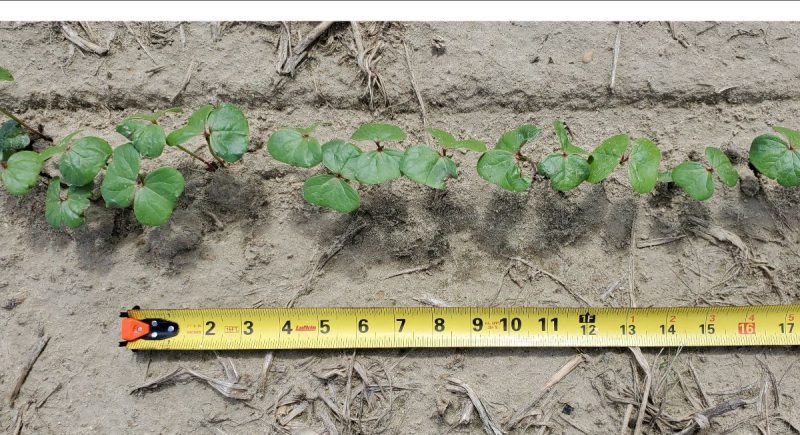
Evaluating cotton seed germination rate to adjust the seeding rate. Credit Steve Brown, Auburn
–
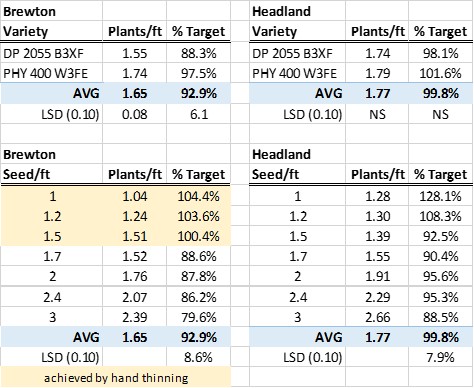
Efforts were not made to pre-check planter accuracy; that is, to determine actual versus targeted seeding rates. At Brewton, stand counts were higher with PHY 400 W3FE as compared to DP 2055 B3XF. Achieved stands vs. targeted stands declined with increasing seeding rates at both locations. Interestingly, at Headland, targeted populations were exceeded at the lowest three populations, indicating the planter delivered more than the intended seed per ft at these rates. The Lowest seeding rate was obtained using the Precision eSet technology that appeared to be about 1.5 seed/ft or 1 seed every 8 inches.
–
Yields were affected by late season rains and wind at Brewton, compounded further by the large plant canopy. Yields were significantly greater with PHY 400 W3FE than the other variety, and there were a few yield differences among seeding rates. In Headland, there were no yield differences between the two varieties or among populations, remembering that the lowest three rates were essentially the same (1.5 seed/ft).
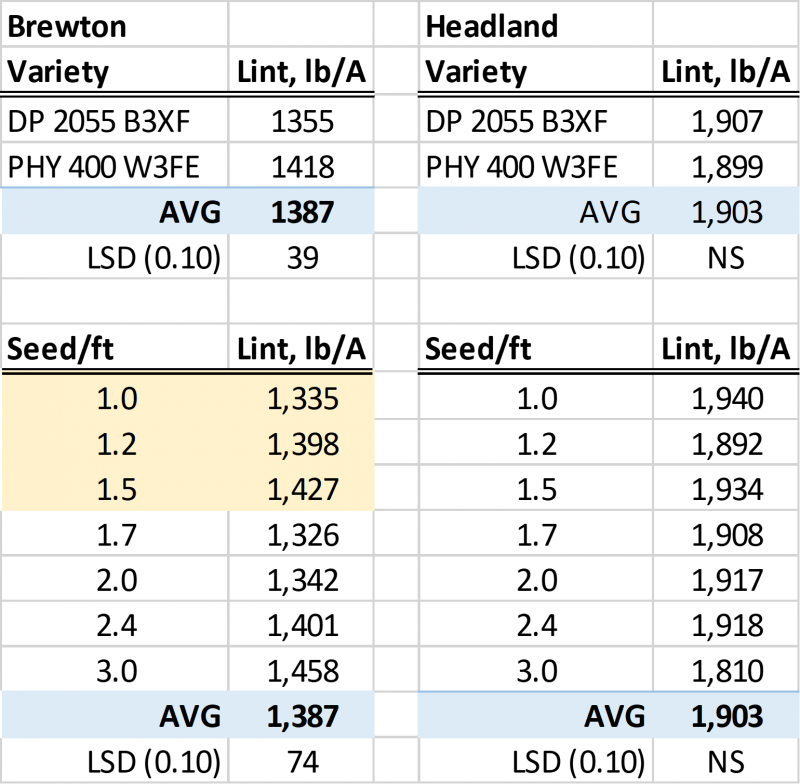
Credit: Steve Brown, Auburn
–
A reasonable application of these results is NOT to aim at planting 1.5 seed/ft, but rather to provide confidence to explore slight reductions of your present rate, assuming you’re not already on the lower end of the population spectrum. For example, if you’re in South Alabama and planting 2.75 seed/ft, you may be able to dial it back to 2.4 or 2.3 seed/ft. If you’re in the north and using 3.5,consider 3.0 seed/ft. Even in the best of conditions in the southerly areas, I would not go below 2.0 seed/ft. And common sense helps. If conditions are great and seed vigor is strong, you can afford to aggressively dial it back. If conditions are challenging, be cautious.
Below are charts that show per acre seeding rates based on seed/ft and row spacings and potential plant stands with an assumed 80 percent establishment rate.
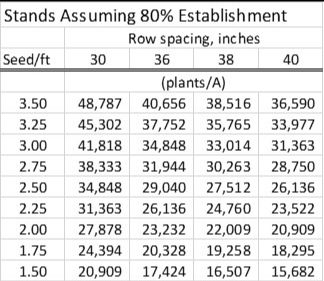
Per acre seeding rates based on seed/ft and row spacings and potential plant stands with an assumed 80 percent establishment rate. Credit: Steve Brown, Auburn
- Cotton Marketing News:Acreage Numbers are a Surprise – What Now? - July 11, 2025
- Gulf Coast Cattlemen’s Conference – August 8 - July 11, 2025
- Cotton Marketing News:USDA June Numbers—Neutral, Not Good but Not Bad - June 20, 2025