
If you are a weather enthusiast, and follow the series of regular weather summary updates through this blog, you know there was some concern from the winter and 1st quarter 2021 outlooks in the Southeastern U.S. Fortunately, the Climate Predication Center (CPC) winter forecast was not completely accurate. So what happened?

Long range climate forecasts are somewhat like playing poker. You see the hand you are dealt and bet on the odds of winning. If you have ever played poker and watched two players who obviously both had good hands, the pot builds as both players are fairly certain the odds are in their favor. This is similar to long-range climate forecasting. The odds were pretty good (full house) that we would have a warm/dry winter in the Southeast, based on the La Niña affect from cooler pacific ocean waters, which historically pushes the Jet Stream north over the fall and winter months. However, the Polar Vortex (four of a kind) trumped the La Niña. As you can see from the graphics above, the polar vortex, that was particularly strong in late January and February, forced the Jet Stream south for several weeks. So we had a mix of weather patterns this winter that were pretty difficult to predict. The Polar Vortex did cause a short cold and wet period, but not for the entire winter. This unexpected precipitation was not uniform across the Panhandle either, and did not provide enough of a shift in precipitation to erase the overall drier pattern.
–
Rainfall
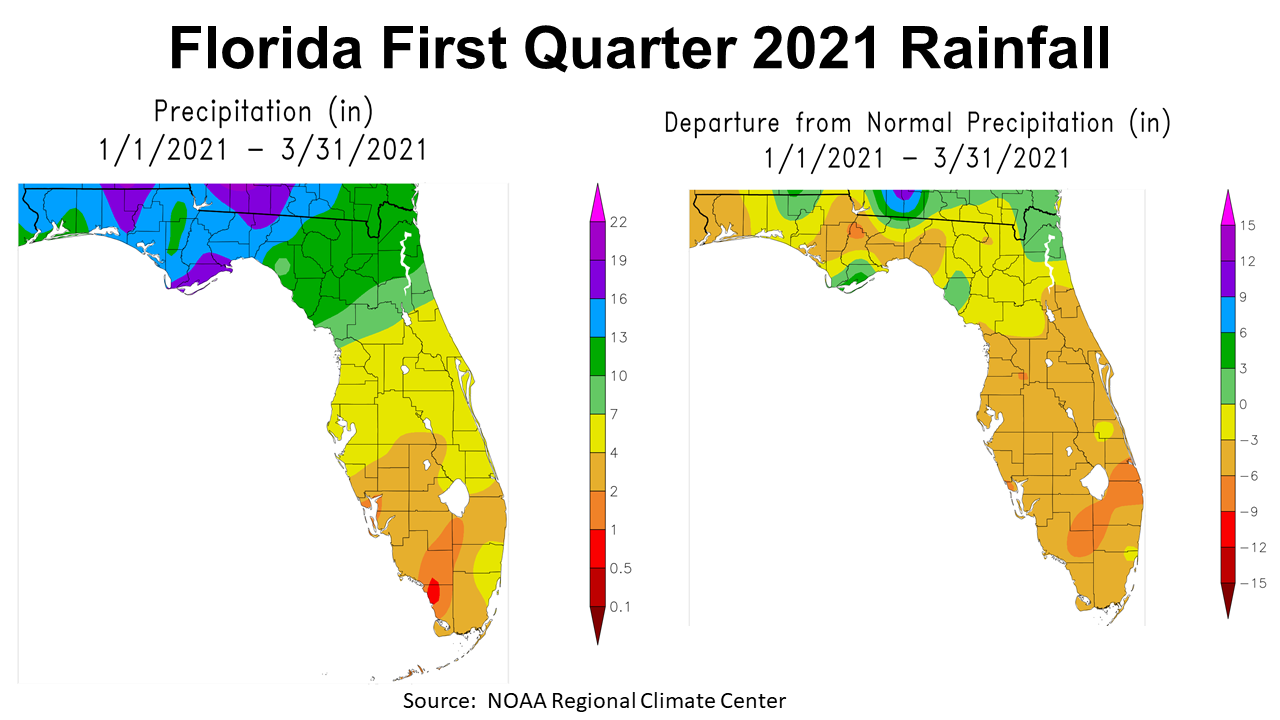
In terms of the actual rainfall, January – March 2021 was below average for much of the Panhandle for the entire first quarter of 2021. The map to the left above shows that there were parts of Jefferson, Leon, Holmes and Walton Counties that received more than 19″ during the first three months of 2021 (purple). Much of the Panhandle had more than 13″ (blue), with a few areas ranging from 10-13″ (green). However, when you compare these totals to normal, as the Departure from Normal map to the right shows, you see that very little of the Panhandle was above average (green), with most of the Panhandle either 0-3 ” below average (yellow), or 3-6″ below average (tan).
–
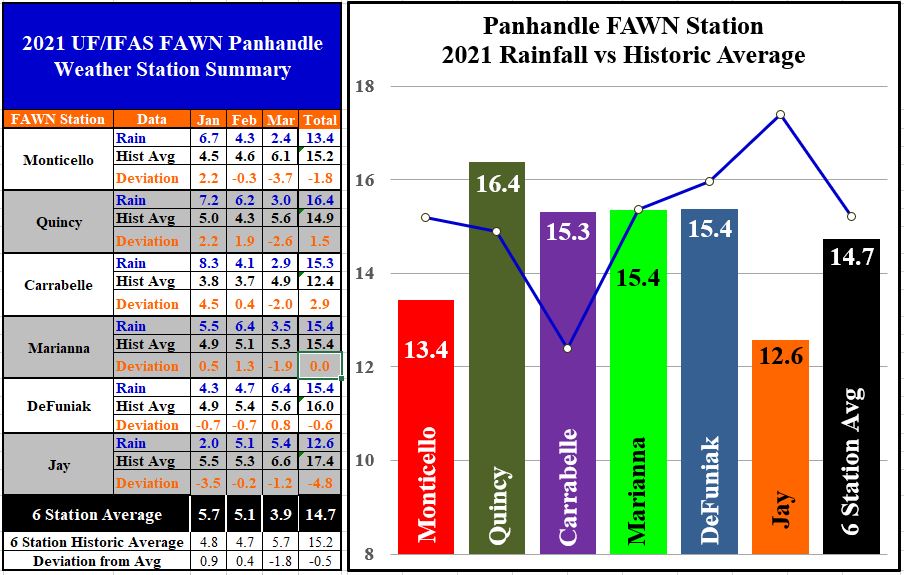
We can also compare rainfall from specific locations through the data collected by the Florida Automated Weather Network (FAWN) stations. There are six stations in the Panhandle. Over the first three months of 2021, three stations were above average and three were below. The average for all six locations was 14.7″, which is – 0.5″ below normal for this time period. The driest location was in Jay where only 12.6″ were recorded, which was almost – 5″ below average. Monticello was also well below normal, with only 13.4″, compared to the 15.2″ average. The highest total through the 1st quarter was at Quincy with 16.4″, and Carrabelle with 15.3″ was not far behind. If you look at the comparisons for each month you can also see that March was much drier than January and February. The polar vortex boosted rainfall in some areas, but it was not at all uniform across the Panhandle.
–
 –
–
Temperatures
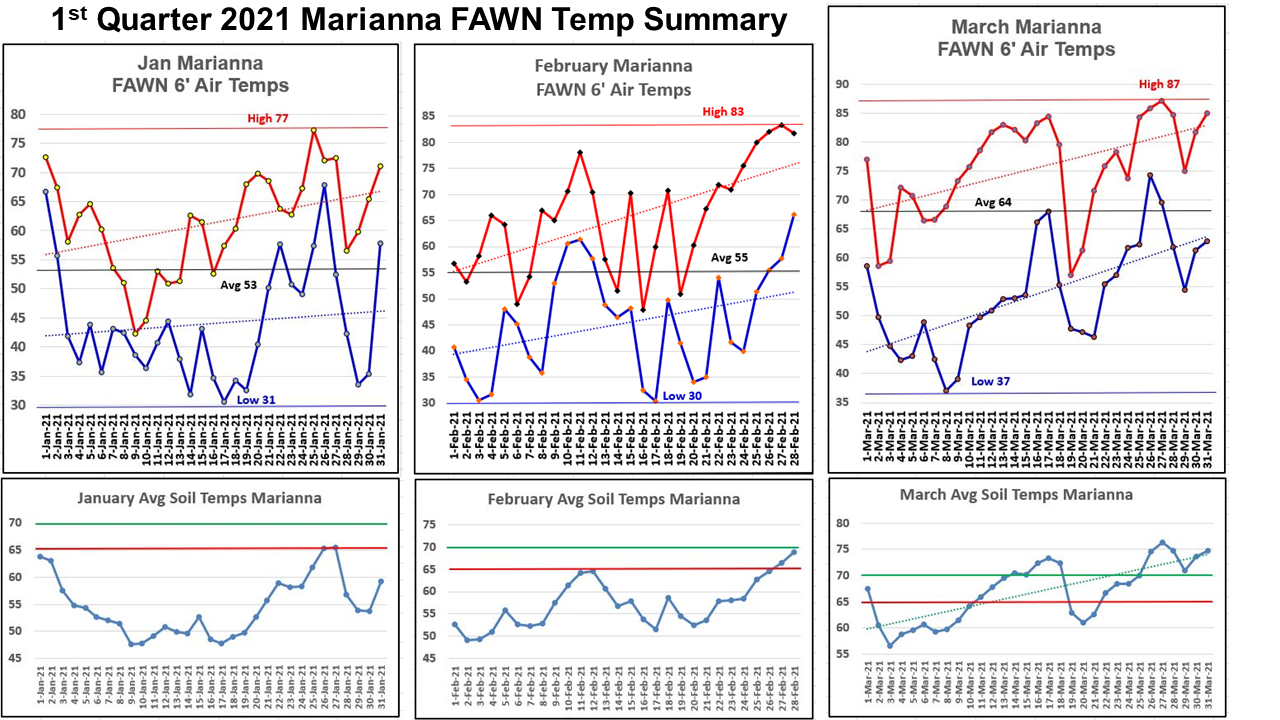
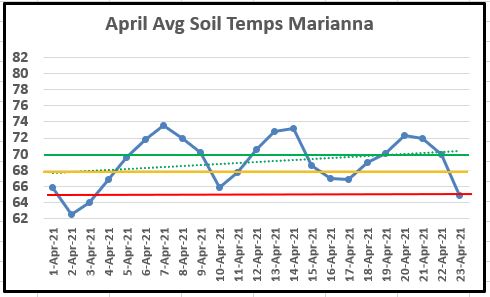
According to NOAA, Jackson County had the coldest winter since 2016, but even so was 1.6° above the long-term historic average for the first quarter. Temperatures never fell below 30°, so the Panhandle saw none of the real damaging cold that the southern states further west had to endure. In the charts above you can see the roller coaster of temperatures that were measured in Marianna from January through March. January ranged from 31° to 77°, February from 30° to 83°, and 37° to 87° in March. Average soil temperatures also swung up and down, finally reaching above 65° in late February and then falling again in March. By the end of March, soil temperatures were above 70°, which was warm enough for good cotton and peanut seed germination. But as you can see below, the roller coaster temperatures continued in April. The recent cool nights have pushed the average soil temperatures back down below 65°, which is the minimum temperature for cotton and peanut seed germination. Be patient, as the roller coaster will bounce back up again soon, likely within the next several days. You really want to target at least three days above 68° (yellow line), and ideally above 70° (green line), so these seedlings come up quickly and uniformly.
–
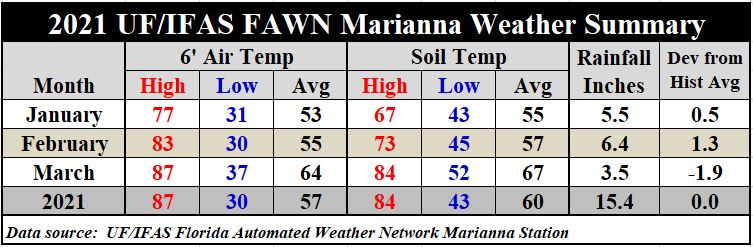
The average 6 ft. air temperature in Marianna rose from 53° in January, to 55° in February, and then 64° in March. The average soil temperature rose from 55° in January, to 57° in February, and then 67° in March. You can see the general warming trend by month. Rainfall was above average in January and February, but well below average in March. It was a fairly mild, dry winter, as was forecast, but the polar vortex provided a boost to rainfall in January and especially in February.
You can download the daily temperature and rainfall from the Marianna FAWN station, and monthly rainfall totals for the Panhandle FAWN stations by using the following link: Jan-Mar 2021 Jackson Co Weather Summary.
–

Planting Season Outlook
The Climate Prediction Center (CPC) is forecasting above average temperatures in May, and also a wetter than normal month. Based on this information, this is a positive outlook for getting cotton and peanuts planted on time. Just remember May is normally one of the driest months of the year, so above average rainfall may not be that extreme.
–
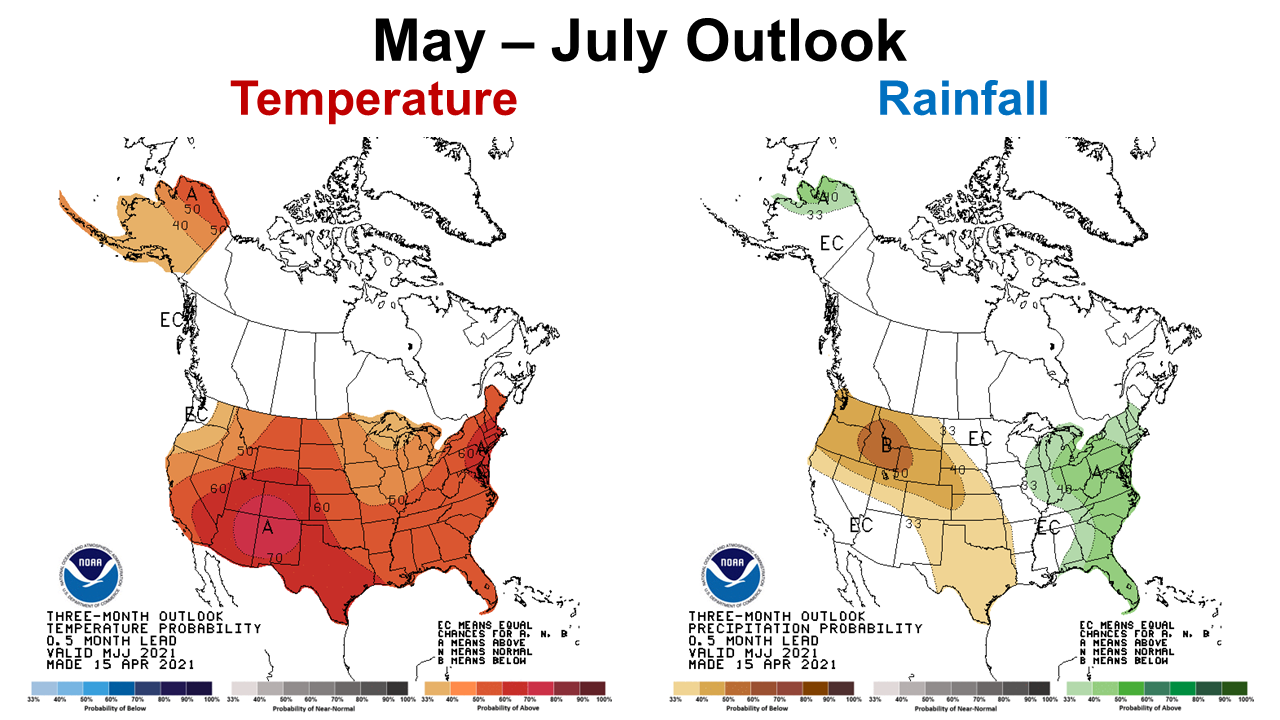
The three month outlook is fairly similar to the May Outlook, with warm and wet conditions expected. The Central Time Zone portion of the Panhandle is a lighter shade of green in the precipitation map, meaning the CPC is less confident of above average rainfall in the western Florida counties. Why this sudden change of precipitation forecast? La Niña is quickly fading, so we are headed back to neutral in the coming months.
–
La Niña Watch
The Climate Prediction Center (CPC) is expecting the current La Niña to continue to weaken with a transition to neutral in the next few months. This is good news for area farmers. The following came from their April 8 ENSO discussion.
La Niña continued during March, reflected by negative sea surface temperatures , which extended across much of the equatorial Pacific Ocean. The Southern Oscillation and Equatorial Southern Oscillation were weakly positive in March. Overall, the trend in the coupled ocean-atmosphere system is consistent with a weakening La Niña. Most of the models predict a transition to ENSO-neutral during the spring 2021. The forecaster consensus agrees that a transition is imminent, with a 50-50% chance of La Niña or ENSO-neutral for the March-May average, and then predicts ENSO-neutral to continue at least through the summer. In part, due to the uncertainty in predictions made at this time of year, the forecast for the Fall 2021 has lower confidence with a 40-50% chance of either La Niña or ENSO-Neutral, with a small chance for El Niño. In summary, a transition from La Niña to ENSO-Neutral is likely in the next month or so, with an 80% chance of ENSO-neutral during May-July 2021. Climate Prediction Center April 8, 2021
–
So what does this mean for farmers and ranchers?
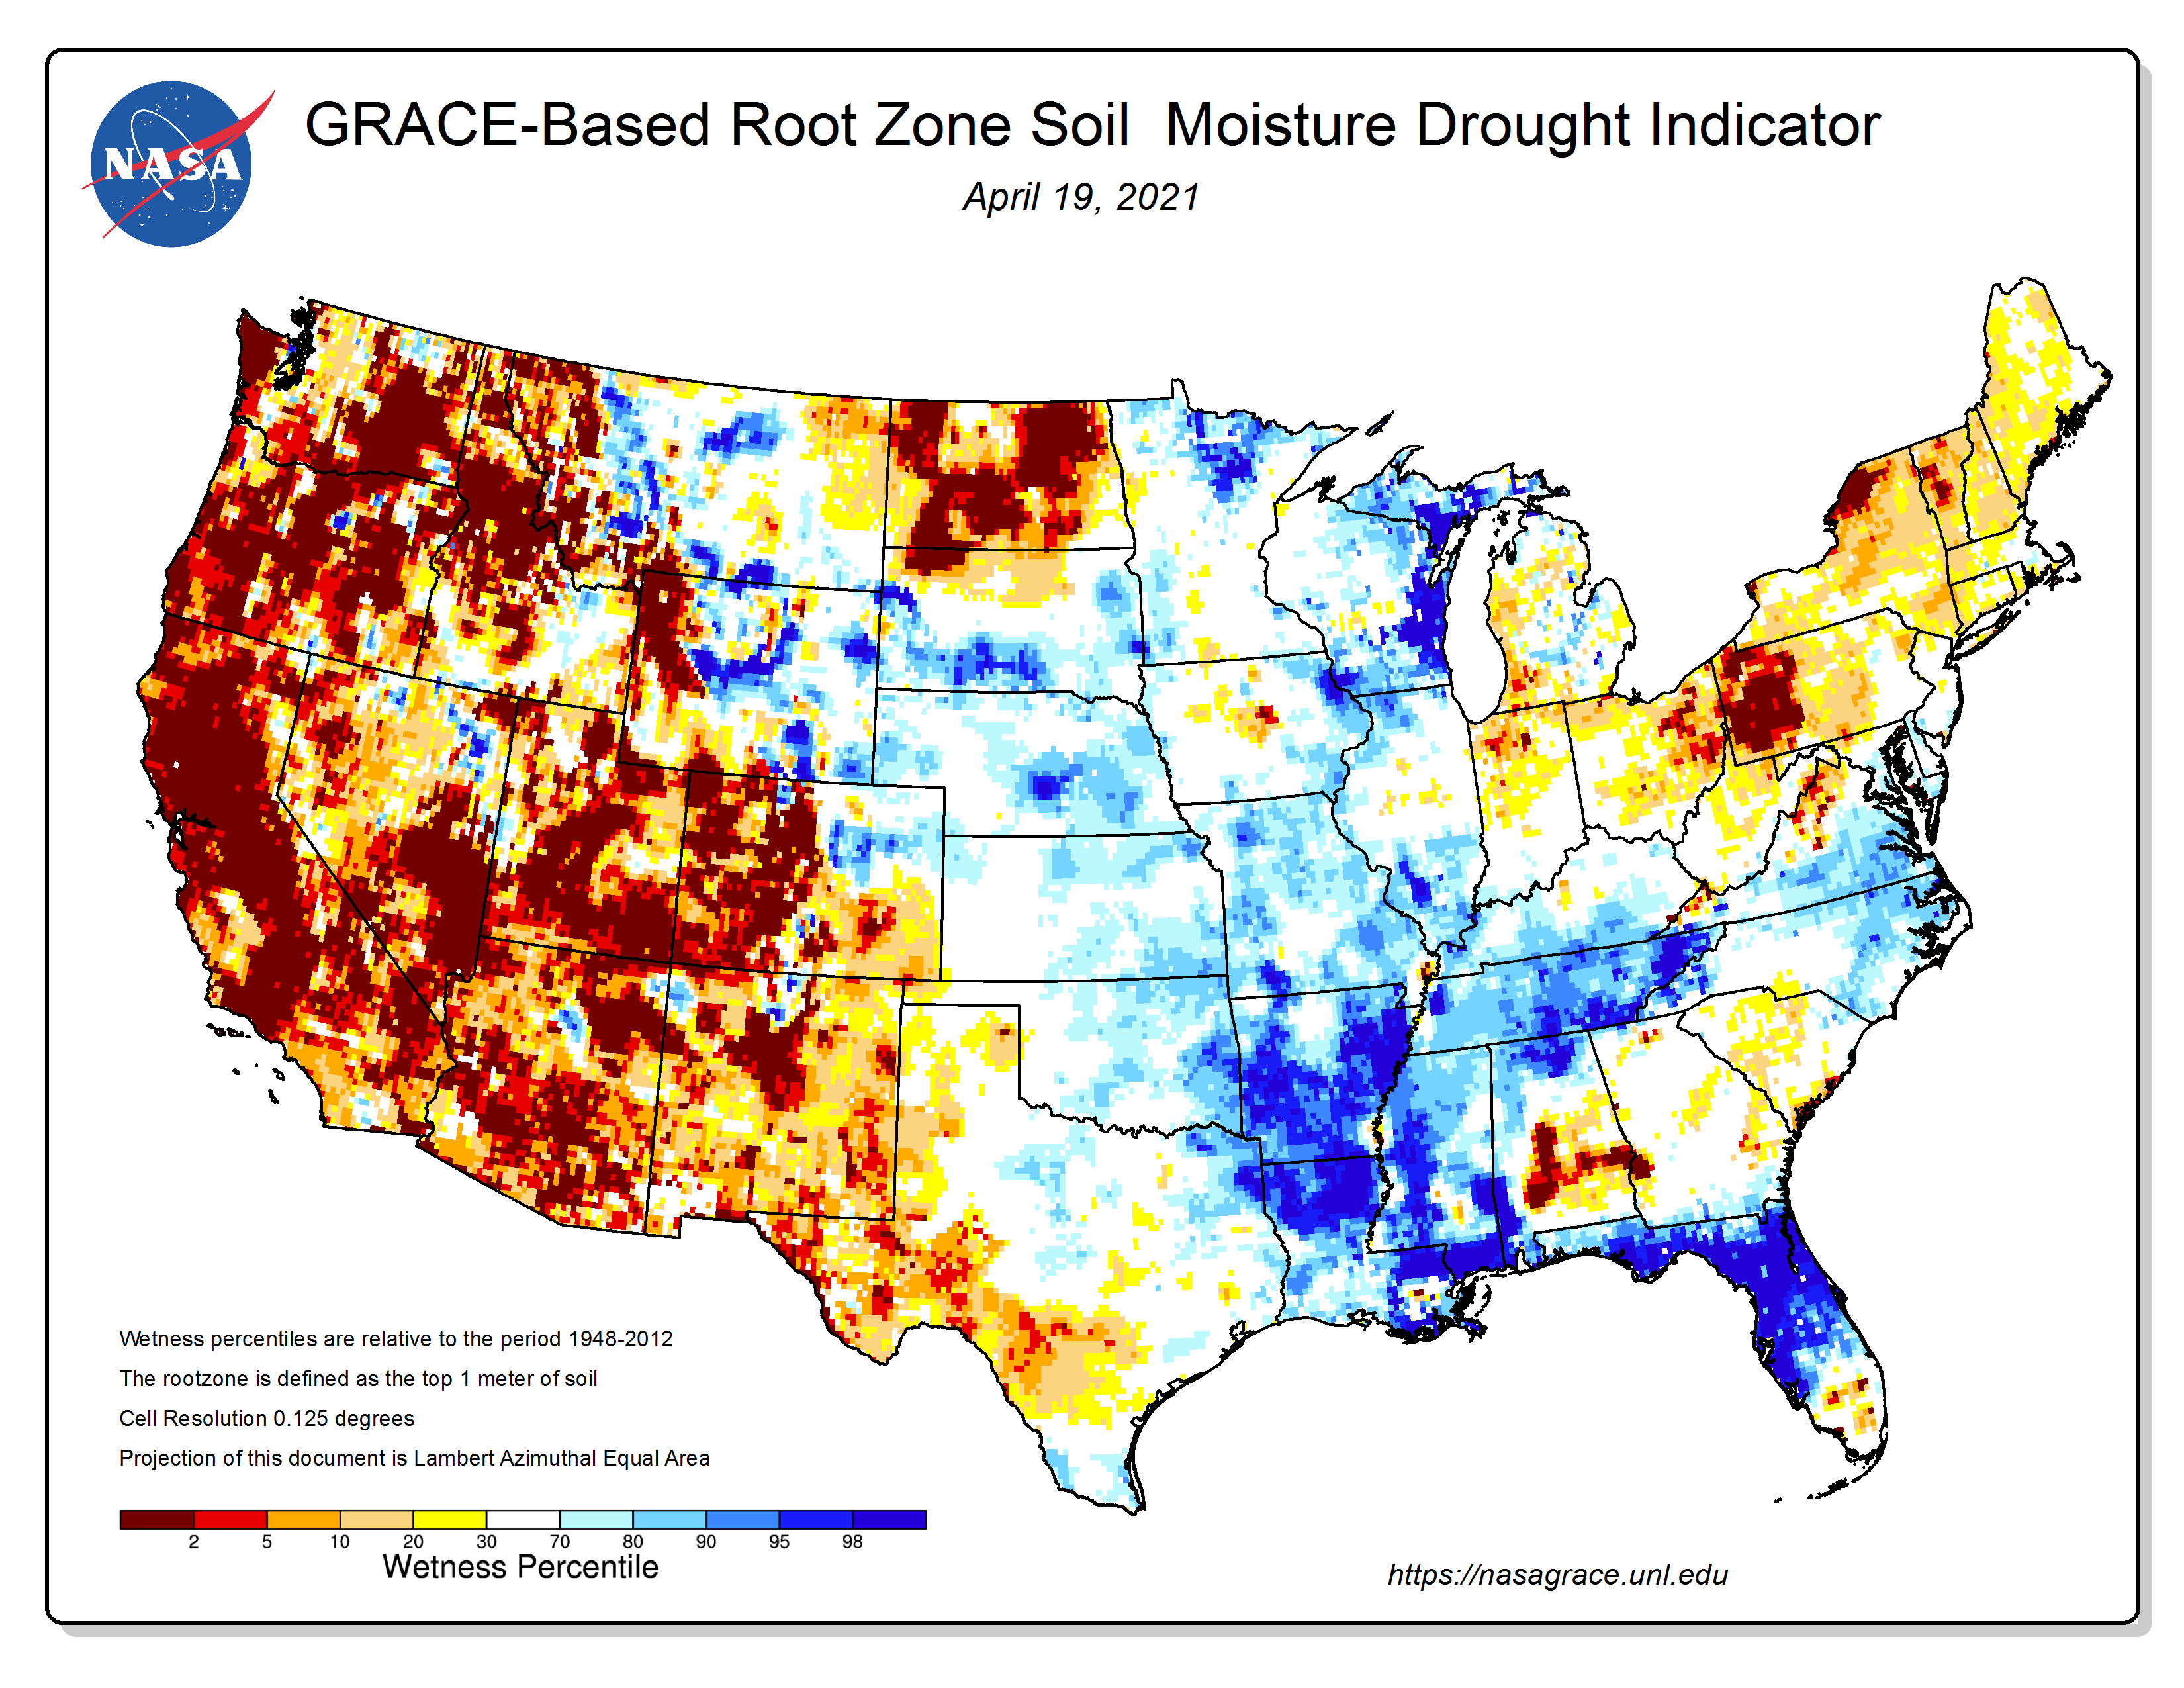
Soon the enjoyable spring weather with cool nights will fade as the calendar turns to May. Sleeping with the windows open will soon end. This was not a good year to gamble on early planting, due to the late spring cold fronts. Based on the most recent NASA soil moisture map below, the Panhandle is in pretty good shape , but farmers in south central Alabama have not been as fortunate.
 –
–
Going forward the key to successful crop stands will depend on average soil temperature. There is decent soil moisture with more rain on the way this weekend.
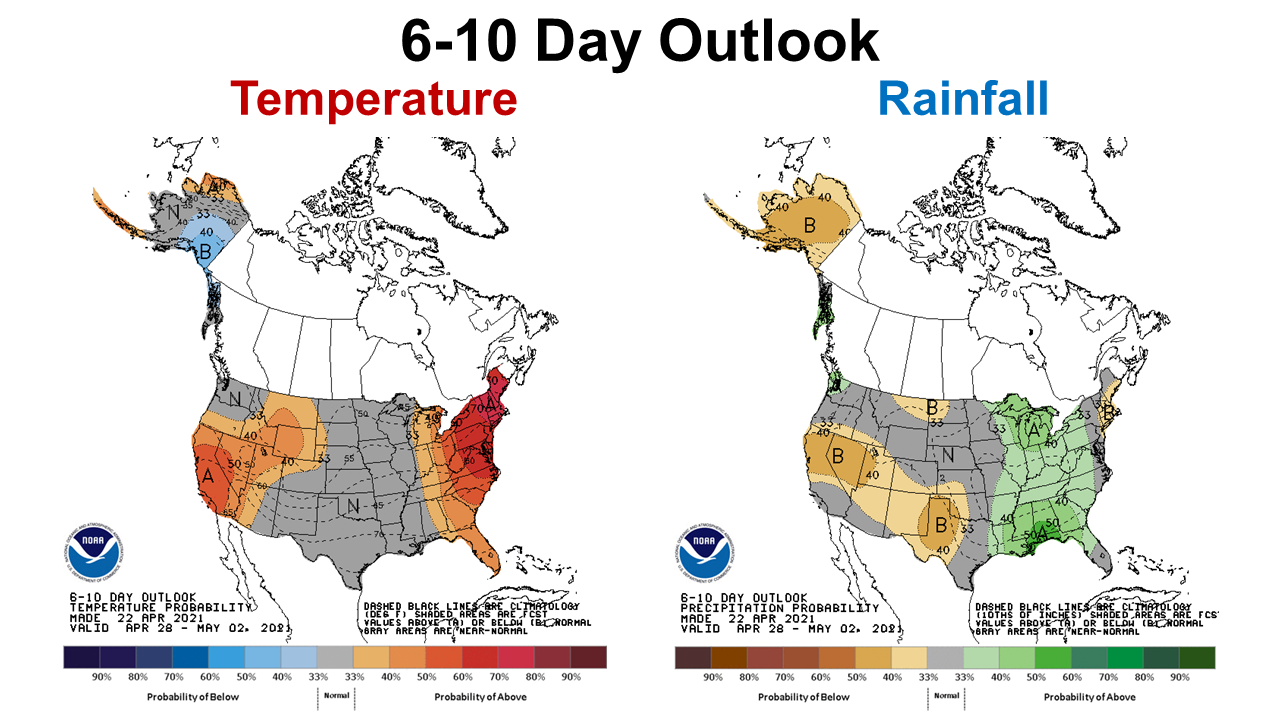
The short-term 6-10 Day CPC Outlook shows a warming trend is expected, with an increase in moisture from the coming front. This is good news, but be patient, as the soil warms slower than air temperatures. Hopefully, by the time fields are dry enough again for planting, the soil will have warmed up enough too. You can check the average soil temperatures of the FAWN station nearest you using the FAWN Report generator: https://fawn.ifas.ufl.edu/data/reports/

demayo@ufl.edu - 850-482-9620
Follow me on Twitter
@UFCowman
- June 2025 Weather Summary and Three-Month Outlook - July 11, 2025
- Friday Feature:Pipeline Farming Accident - July 11, 2025
- May 2025 Weather Summary and Summer Outlook - June 20, 2025