
De Broughton, Regional Specialized Row Crop Agent, Tyler Pittman, Gilchrist County Extension Agriculture Agent, Kelsey Steller, NFREC Extension Assistant, and Dalton Tiner, NFREC Extension Assistant
–
Why soil test?
Farmers need to soil-test annually to determine potential plant-available nutrients for the future crop. Soil testing is one of the ultimate Best Management Practices (BMPs) to help manage nutrients for plant uptake, but also for other benefits. This practice generally helps farmers maintain profitable crops, while protecting the environment from excessive fertilization and nutrient losses. This basic practice can be even more efficient if samples are annually collected from digitally mapped small blocks in a grid.
–
What is grid sampling?
Soil sampling using a digitally mapped grid with georeferenced points can help producers get a more accurate picture of nutrients and soil pH at any given time and the variation from year to year, when compared to single or composite point sampling. Grid sampling reveals how the pH and essential nutrients are distributed across a field. By collecting more soil samples in a location, a grower can obtain a better understanding of the nutrients available for the next crop. Grid sampling prevents over-application of fertilizer in areas where nutrient levels are high and provides more accurate recommendations for soil nutrient building in areas where the soil needs to be enriched. The smaller the grid size, the higher the accuracy of field nutrient levels in the test results.

Figure 1. Various sampling software allow the customer to customize grid sizes and orient grids spatially for optimal sampling coverage. In this image, the green marks represent samples that have been collected, as the sampler moved through a large block.
–
How does it work?
Common grid sizes for applying calcium in the form of dolomitic lime in the winter are commonly 2.5-10 acre-sized blocks, and 2.5-5 acre-sized blocks for applying nutrients like phosphours (P), potassium (K), magnesium (Mg), and micronutrients. Various agriculture software companies create the georeferenced grid for you, which can be connected to the same (or similar) software at your local analytical lab for processing (Figure 1 above).
Once grid sampling is completed, using georeferenced points as a guide, fertilizer recommendations are generated, based on the expected plant response of the future crop, for fertilizer application as a function of nutrient levels known. From there, maps can be generated and given to commercial fertilizer applicators, or for producers using their own variable rate spreading equipment for precise nutrient applications of lime and fertilizer (Figure 2 below). Precision of variable rate application of nutrients usually improves as fields are further divided and sampled in smaller units, however sampling and testing costs will also increase.
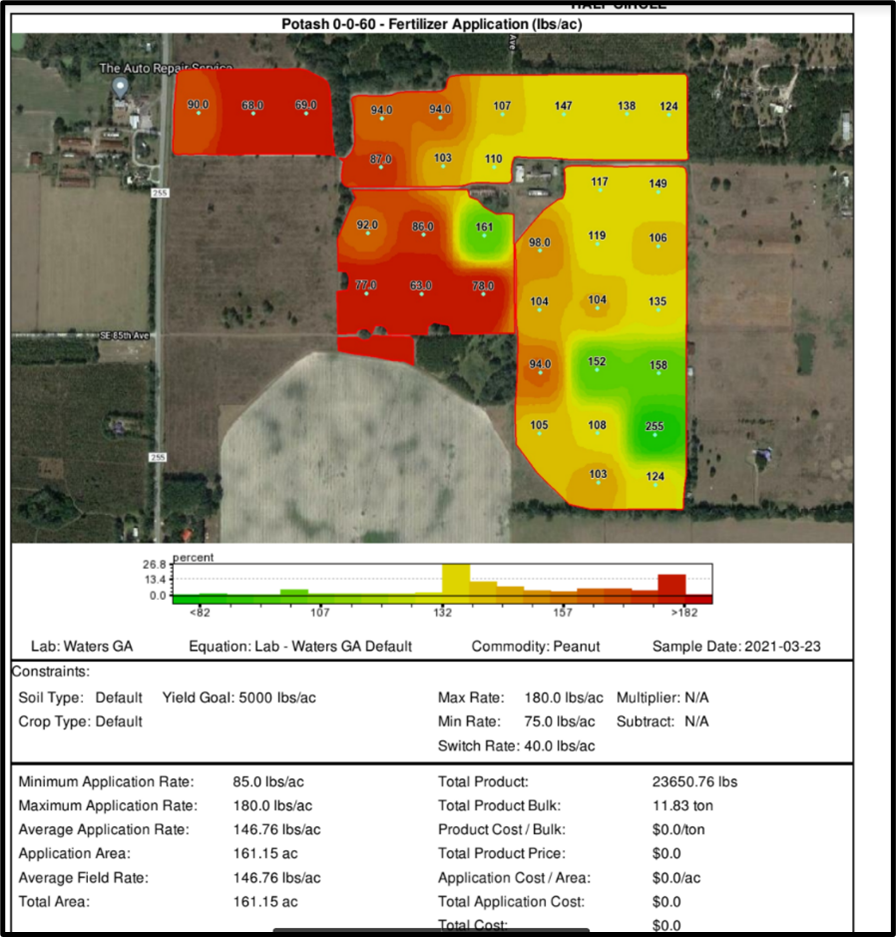
Figure 2. The appearance of final spread maps may vary slightly from one software company to another. A fertilizer summary with nutrient recommendations should accompany each final map.
–
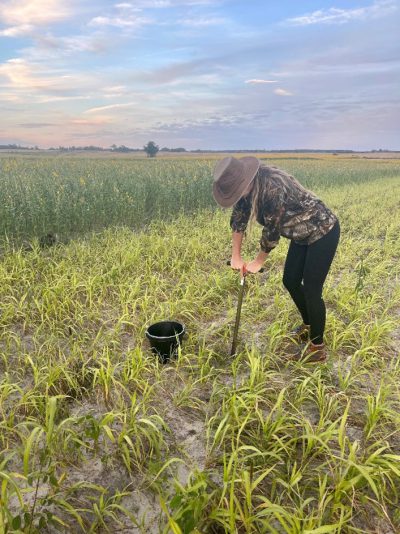
Figure 3. The soil sampler should collect no less than 4-5 cores within each grid cell to form one composite sample. Credit: De Broughton, UF/IFAS
Another less costly approach to achieve systematic soil sampling (outside of using GIS software) is to overlay a square or rectangular grid on a map or photograph of the field, drive to the middle of each grid cell, and collect a soil sample at that point and within each individual cell. Each soil sample consists of several soil cores collected within a small radius of the grid cell center. The soil cores are composited and bagged as one soil sample (per cell of the grid) for analysis at a laboratory (Figure 2 right). The purpose of compositing several cores is to average out variability in soil test properties that occurs over small distances. This increases the accuracy of results and better placement of nutrients where needed most.
Many extension soil sampling guidelines for field-average recommendations call for dividing fields into smaller areas, so it is recommended that soil cores within small areas be collected while walking a zigzag pattern across each grid area. An average value can be generated from the multiple soil sample composites to arrive at a fertilizer rate application for each individual block.
–
Weighing out cost to benefit
Costs associated with sampling services increases with smaller grid spacings. Also, climate conditions vary due to inconsistent rainfall amounts, sandy soils, and heat lead to changes in soil nutrient diversity from one year to the next, making annual sampling necessary. Mitigating costs by changing the grid size from year to year could be a consideration. The smaller (more expensive) grid sampling is required less frequently, if soil test information, fertilizer applications, and crop removals are georeferenced, so that a nutrient balance budget can be maintained.
To further address the benefit of grid sampling, misapplication of fertilizer from random soil sampling can lead to an inaccurate maps of nutrient variability. Yield and income losses have been experienced when soil test recommendations were based on overestimated nutrient levels, when in fact areas were nutrient deficient, caused by incomplete or inaccurate sampling.
–
Keeping records for future planning
A buildup of nutrients is less likely to happen in our sandy, low cation exchange-capacity soils, so annual soil testing will help farmers avoid planting crops in nutrient-deficient soils. Farmers should maintain good records of a field’s soil test history and fertilization practices. These records will help track fertilizer inputs and can help increase the efficiency of fertilizer use. Records will also help track buildup of certain nutrients that may be detrimental to crop productivity and may have negative environmental impacts. For example, if phosphorus builds up to excessive levels, then loss of soil by erosion could result in phosphorus enrichment of a nearby water body. Another example, leaching of nitrogen may be a problem in the deep sandy soils of Florida, such as in the Jackson Blue Spring area, and Suwannee River Valley regions of the state.
For more information or details on grid sampling for Florida grown crops, contact your local UF/IFAS County Extension Ag Agent.
–
References:
Soil Sampling Strategies for Precision Agriculture
Soil Testing for Plant-Available Nutrients—What Is It and Why Do We Use It?
Grid Soil Sampling (Better Crops/Fall 1994 Vol. 78, No. 4)
- Farming More Efficiently with Grid Soil Testing and Precision Nutrient Application - November 12, 2021
- Calcium for Peanut Production in North Florida - May 28, 2021
- Evaluation of Controlled Release Fertilizers for Crop Production in Florida - December 11, 2020