
Rainfall
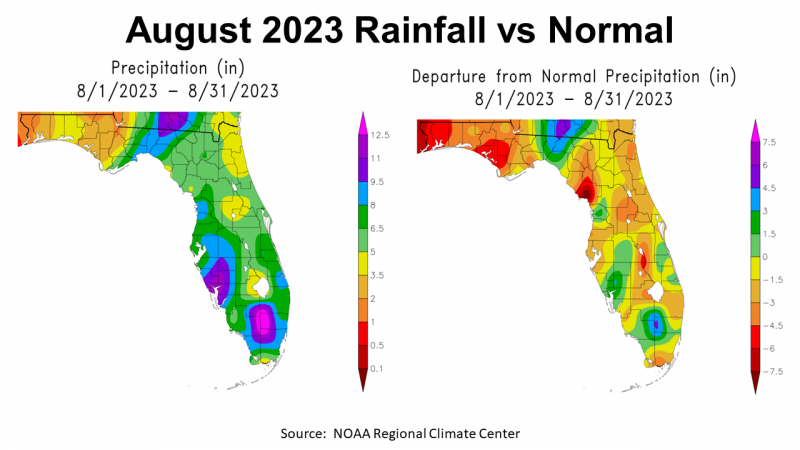
August was very hot and dry for much of the Panhandle. Hurricane Idalia was not a welcomed guest in the Florida Big Bend but it did provide some beneficial rainfall for areas that had been very dry. You can see in the map to the left above the clear path of the storm based on rainfall. The areas in orange received less than 2″ in August, in tan less than 3.5″, and yellow less than 5″. Those areas were west of the path of Idalia. The map to the right above shows how this rainfall compared to historic average for August. The areas in red were -4.5″ or more below average, and the areas in orange were -3″ or more inches below average, and in tan were -1.5″ below average. Only the areas in green (1.5-3″), blue (3-4.5″) and purple (4.5-6″) were above average, due primarily to the rainfall associated with Hurricane Idalia.
–
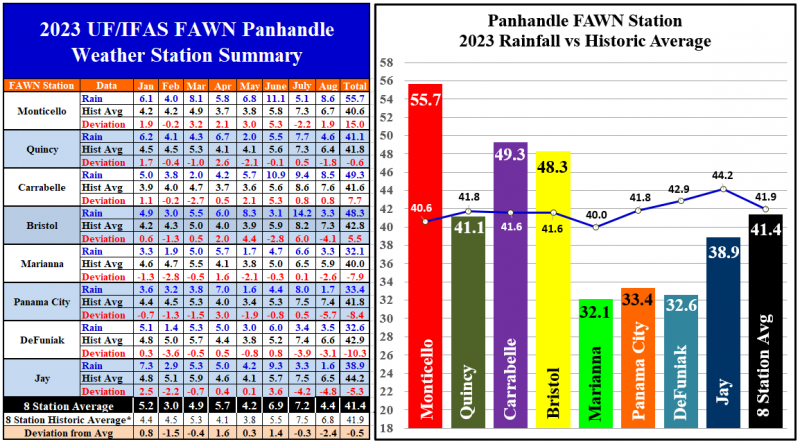
The eight Florida Automated Weather network (FAWN) stations provide more precise records for August 2023 rainfall records. The chart above lists the weather stations from east to west, so it shows the reach of Hurricane Idalia in a very dry month. The wettest location was Monticello with 8.6″, which was 1.9″ above average for August. Just for reference sake, the Mayo FAWN Station (Lafayette County) recorded 12.34″, and the Live Oak Station 7.4″ in August. Contrast those totals with the 1.6″ recorded at the station near Jay, which was -4.8″ below normal. The Panama City station recorded 1.7″, which was -5.7″ below average for the month. The average of all eight stations for August was 4.4″, which was -2.4″ below normal.
Through the first eight months of 2023, the disparity in rainfall for Central Time Panhandle Counties becomes very evident. The station in Marianna had the lowest total of only 32.1″, which was -7.9″ below the 40″ average. Contrast that with Monticello which has received 55.7″ thus far in 2023, which was 15″ above historic average. The average for all eight stations from January through August was 41.4″, just -0.5″ below normal. Looking at the bar chart above you can really see the differences on either side of the Apalachicola river. Not that the river stopped the rain, it is simply the edge of the area where the high-pressure heat-dome plaguing much of the south this summer and spent the most time interrupting typical summer rainfall patterns.
–
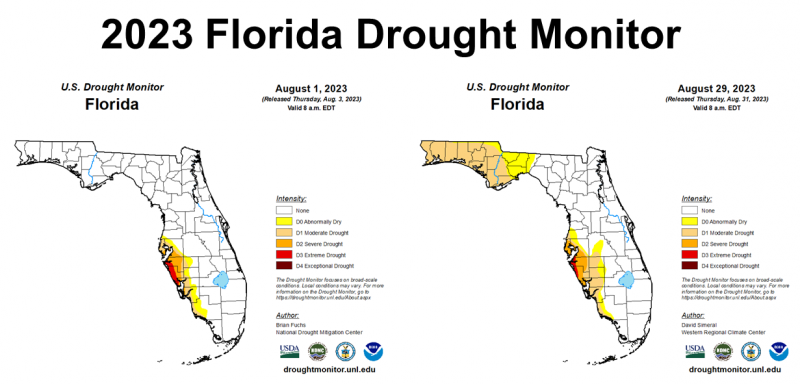
At the end of July, farmers and ranchers in the Panhandle were feeling good about the current growing season but then came August. The Florida drought monitor maps above show the contrast from August 1 to August 29. This was the impact of the heat-dome that not only prevented summer rainfall but also included high temperatures that dried up the moisture in the soil. What is a little surprising is that Jefferson County was included in the Abnormally Dry zone on August 29, yet they have been well above average rainfall most of this year.
–
Temperatures
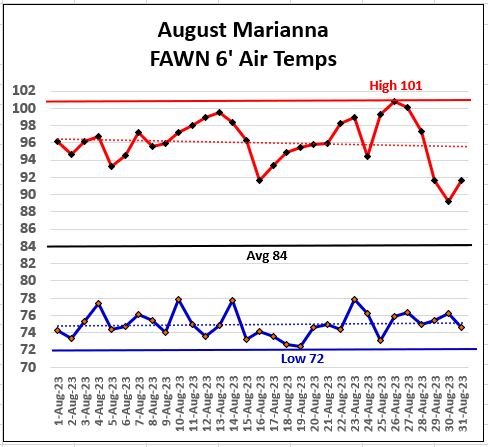 Through the first two months of summer, there were two days in June above 95°, and five days in July. In August there were 21 days >95° and two days of 100° or more at the six foot height (7 days >100° at 2 ft crop level). It was certainly hotter than normal. For instance, there were no days over 95° in August 2022, one day in 2021, and three in 2020. The hottest day in 2023 was August 26, with a six foot air temperature of 101°. The low of 72° came on the morning of August 19.
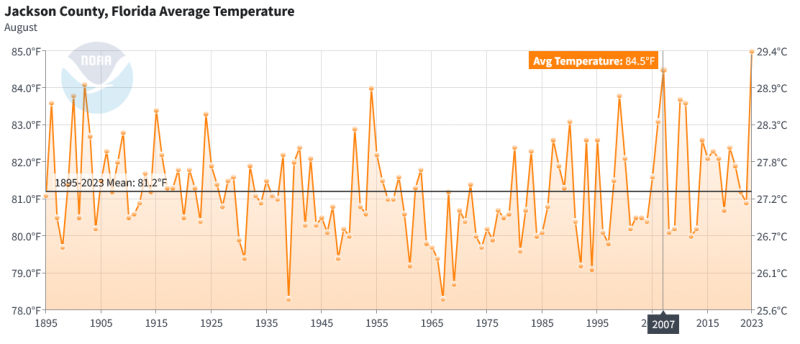
The August 2023 monthly average daily six foot air temperature at the Marianna FAWN Station was 84°. NOAA’s Climate at a Glance data shows that the average August air temperature in Jackson County was 85° this year, which was a new record high from 1895-2023, and was 3.8° warmer than the 81.2° average emperature from 1895-2023. The previous high monthly average air temperature was 84.5° in 2007. So if you said, I don’t remember an August being this hot before, you were right!
–
–
Harvest Season Climate Forecast
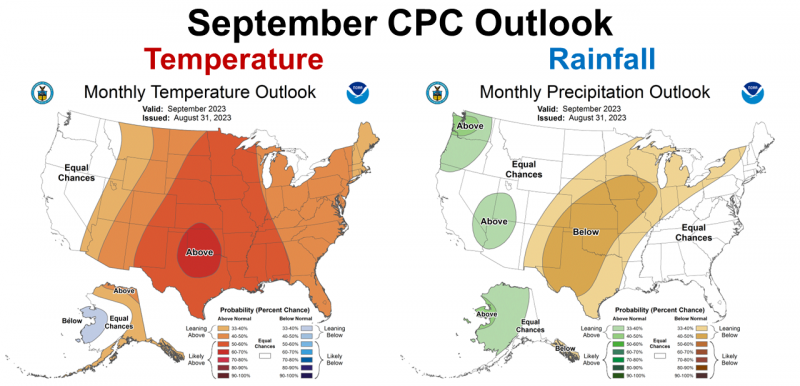
The Climate Predication Center (CPC) is expecting the higher than average temperatures to continue through September. They made no prediction for the rainfall in the Southeast in September. We are halfway though the month and have a ways to go to get to average.
–
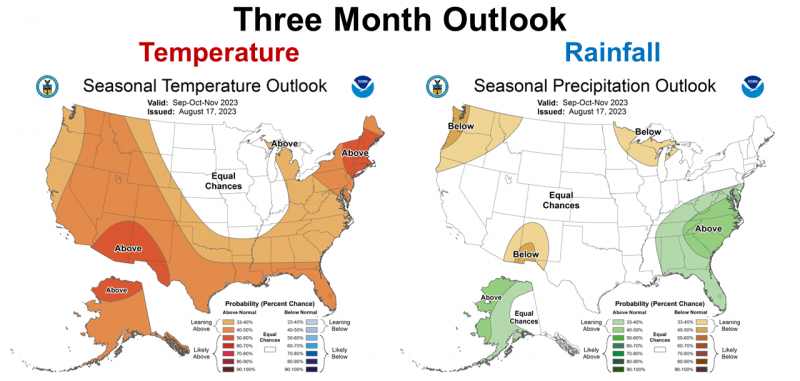 The three-month outlook is similar to the one-month map above, with one big difference. Above average rainfall is expected over the next three months. Just remember that October and November are typically the driest months of the year, so above average may not mean a wet harvest season.
–
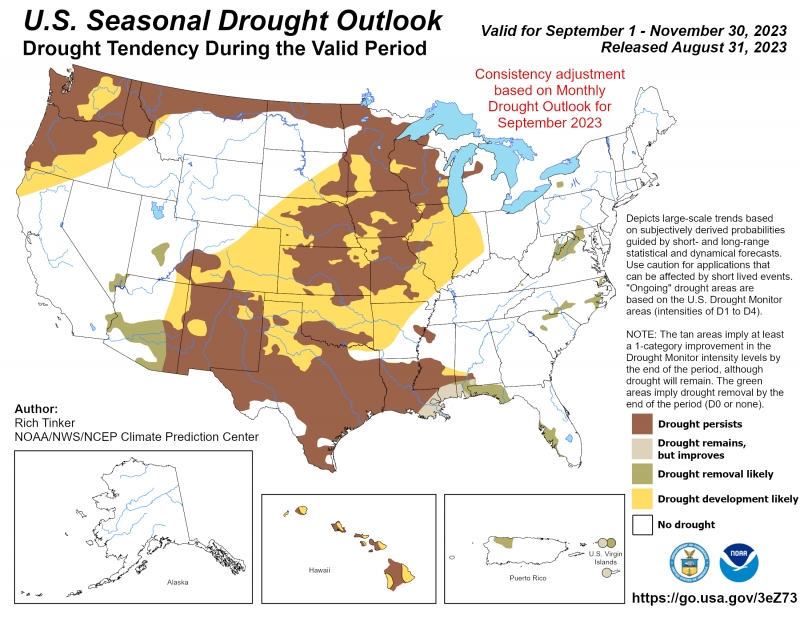 The Seasonal Drought Outlook Map above shows forecasters do think that the drought along the Gulf Coast of Florida will end soon, but it may not be soon enough to relieve stressed crops and pastures before the end of the growing season.
–
El Niño Advisory
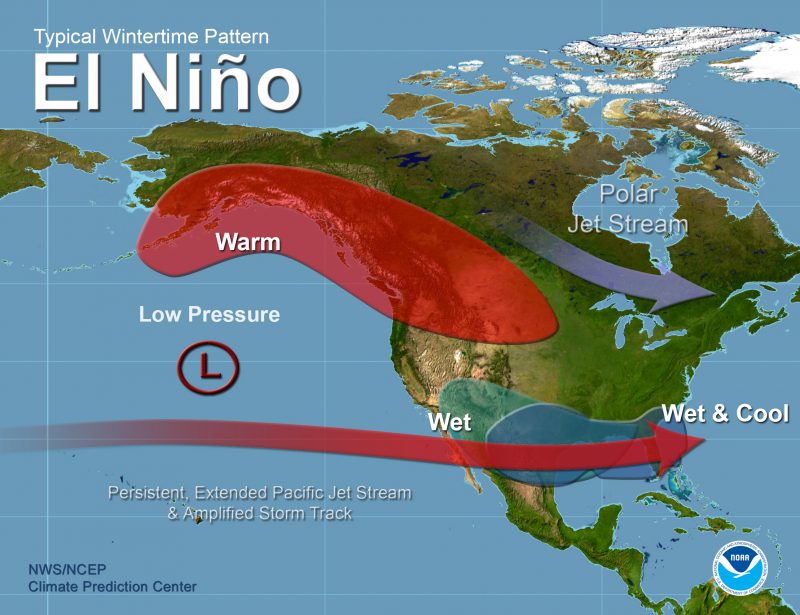 El Niño is building in the Pacific Ocean. Forecasters are even more convinced than last month that a strong El Niño is coming this winter. Typically the ENSO phases have the greatest affect from November through January. Based on their latest advisor statement below, this wet & cool pattern may stretch out into March in 2024.
In August, sea surface temperatures (SSTs) were above average across the equatorial Pacific Ocean, with strengthening in the central and east-central Pacific. All of the latest weekly Niño indices were in excess of +1.0°C (Niño-4 was +1.1°C, Niño-3.4 was +1.6°C, Niño-3 was +2.2°C, and Niño1+2 was +2.9°C). Area-averaged subsurface temperatures anomalies increased compared to July in association with anomalous warmth in the central and eastern equatorial Pacific Ocean. Tropical atmospheric anomalies were also consistent with El Niño. Over the east-central Pacific, low-level winds were anomalously westerly, while upper-level winds were anomalously easterly. Convection was slightly enhanced around the International Date Line, stretching into the eastern Pacific, just north of the equator. Convection was mostly suppressed around Indonesia. The equatorial Southern Oscillation Index (SOI) and the traditional station-based SOI were both significantly negative. Collectively, the coupled ocean-atmosphere system reflected El Niño.
The most recent IRI plume indicates El Niño will persist through the Northern Hemisphere winter 2023-24. Despite nearly the same ensemble mean amplitude as last month, the shorter forecast horizon means that the odds of at least a “strong” El Niño (≥1.5°C for the November-January seasonal average in Niño-3.4) have increased to 71%. However, a strong El Niño does not necessarily equate to strong impacts locally, with the odds of related climate anomalies often lower than the chances of El Niño itself. In summary, El Niño is anticipated to continue through the Northern Hemisphere winter (with greater than 95% chance through January – March 2024). Climate Prediction Center
–
What does this mean for Panhandle Farmers and Ranchers?
The long hot & dry summer for much of the Panhandle may be coming to an end, but it is likely to remain warmer than average through harvest. Forecasters feel fairly certain the El Niño will start to affect our climate in the coming months. There is not much time left for crops and pastures to recover from the heat and drought stress of the past month and half, so waiting longer than normal for harvest may have some risks, as cold fronts finally start moving through the region in the coming months. At the end of July, this growing season looked very positive for crops and pastures, but August and the first half of September have been harsh. Crop stress has resulted in numerous disease outbreaks and pest issues. Record heat and limited rainfall in much of the Panhandle will impact yields that will likely not improve at this point in the season even with above average rainfall. The damage is done, so timely harvest is important to salvage what you can get from another tough year of farming. Hopefully extra rainfall from El Niño will replenish dry soils and raise the water table for next planting season. The climate forecast does still look positive for winter forages and cover crops. I know it does not fell like it yet, but fall is not far off now. Some seeds may be in short supply this year, so start making plans and booking seed for planting in October and November.

demayo@ufl.edu - 850-482-9620
Follow me on Twitter
@UFCowman
- Making the Most of High Cattle Prices – Grow More of Your Own Feed - July 18, 2025
- Friday Feature:1960 Corn Farmer - July 18, 2025
- June 2025 Weather Summary and Three-Month Outlook - July 11, 2025