Don Shurley, UGA Emeritus Cotton Economist
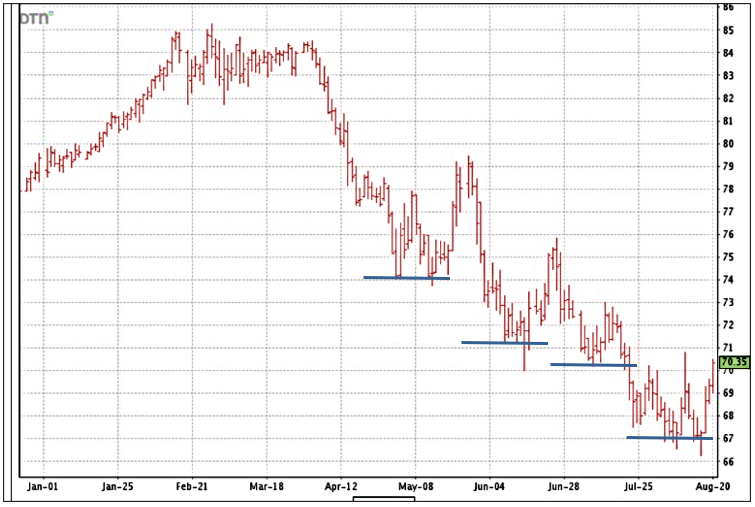
Over the past 3 months, prices (December futures) have made 4 consecutive lower lows—rallies followed by a subsequent decline to lower than where the market was before the rally.
This week, prices pushed, and actually finished, the day on Wednesday above 70¢ for the first time in a month. There will be “resistance” at 71¢ but if the market could break above that, it puts 73¢ to 75¢ in play. Otherwise, we stay in less than 70¢ mode.
 –
–
The market is looking for, and price direction depends on, the balance between supply concerns and demand uncertainty. The demand side appears weak and the market already takes that into consideration. Recently, supply-side concerns have now come more into play.
This month’s August USDA crop production and supply/demand numbers are not friendly to prices.
- The projected 2024 US crop was reduced 1.89 million bales—from 17.0 to 15.11 million bales. This was due to a ½ million acre reduction in acres planted, an increase in abandonment, and a small reduction in average yield.
– - But, exports for the 2024 crop year were cut 1 million bales.
– - World production for 2024 was reduced 2.55 million bales; reduced crops in US and India.
– - Use was reduced almost 1 million bales- mostly due to a reduction for China.
– - Imports were increased for India, Turkey, and Pakistan; reduced for China and Bangladesh.
–
While production for 2024 was cut from the July estimate, production for 2024 is expected to still be 3 million bales more than last year and in 2022. Exports were decreased 1 million bales from the July estimate. So, although production was cut, considering the cut also in exports, US Ending Stocks (how much is projected to carry into the 2025 crop year) are expected to increase by 1.25 million bales.
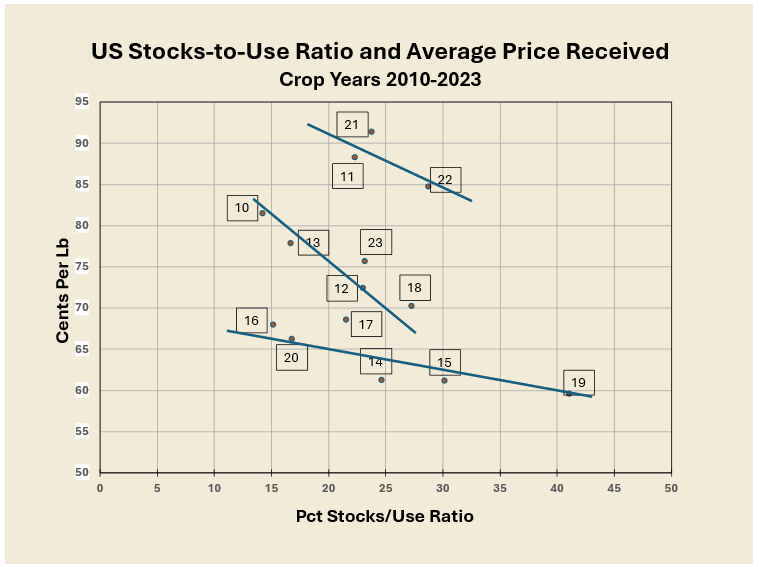
It has always been believed that prices respond to how “tight” stocks are—the smaller the ratio of stocks as a percentage of use, this pushes price to increase.
 –
–
Because we operate within a global supply and demand system, other factors can and do come into play. In general, prices can tend to increase when S/U declines and decrease when S/U increases. But not always. For the 2024 crop year, the ending S/U is currently projected to be 32% compared to 23% last year. Increasing S/U. The average price received is projected to be 66 cents compared to 76 cents for the 2023 crop.
This week’s crop condition report shows 26% of the crop poor or very poor. Texas is 37% poor or very poor. The market will continue to watch the crop and prices could increase, if the crop looks like it may get smaller.
This week’s export report (for the previous week ending 8/15) showed sales of 104,300 bales and shipments of 179,200 bales. Cumulative sales thus far for the 2024 crop are 4.52 million bales compared to 5.37 million bales at this time last year for the 2023 crop year.
–