Rainfall
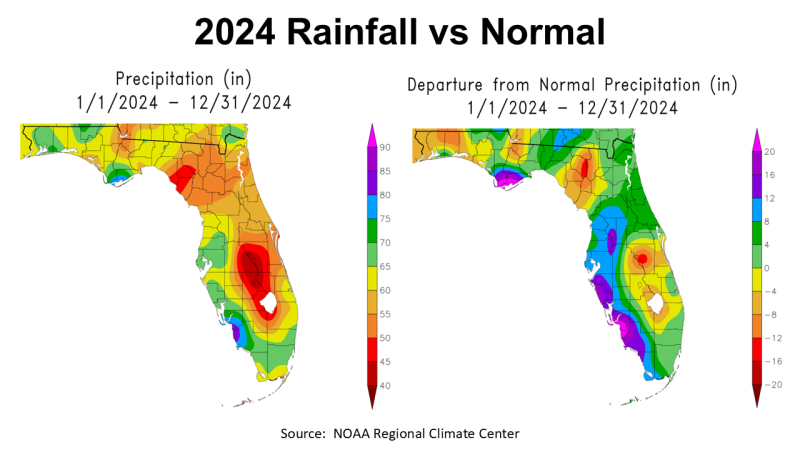
2024 will be remembered by most farmers and ranchers as a dry growing season, but rainfall totals for the whole year were highly variable. The map above to the left shows NOAA’s estimate of annual rainfall in 2024 across Florida. Multiple hurricanes were the source of the variation. The areas shaded in red received less than 50″ in 2024, in tan 55-60″, yellow 60-65″, and light green, green, and blue over 65″. The map to the right above shows how 2024 annual rainfall compared with historic average. Areas yellow, tan, orange or red were below average, and areas green, blue or purple were above average.
–
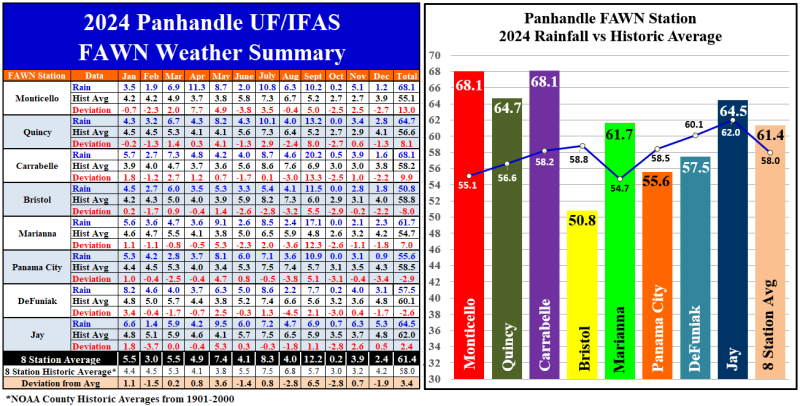
The data from the eight Florida Automated Weather Network (FAWN) stations provide us with a more precise snapshot of when and how much rainfall fell each month. The driest location was Bristol, in Liberty County, where only 50.8″ were recorded, which was 8″ below historic average. Looking back up at the maps above you can see that there was considerable variation in Liberty County ranging from 8-12″ above normal (blue) to -4 to 8″ below average at the north end of the county where the FAWN station is located. The FAWN Stations located near Panama City and DeFuniak Springs were also below normal for the year. The other five stations were above historic average, with the wettest locations being Monticello and Carrabelle. The Monticello station was 13″ above historic average for Jefferson County, and the Carrabelle station was 9.9″ above normal. The average of all eight stations was 61.4″, 3.4″ above the 58″ average.
–
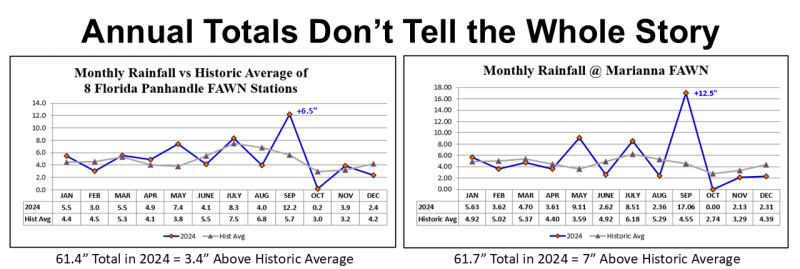
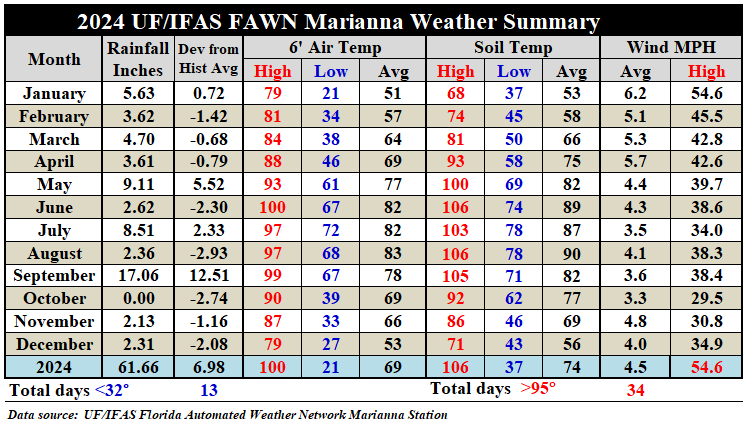
I have talked about this before, but 2024 provides a prime example of, it is not how much rain you get in total, but when it falls that is most important. The chart to the left above is the summary of all eight FAWN Stations in the Panhandle. The chart to the right shows rainfall at the Marianna FAWN Station. Hurricanes Helene and Francine dumped considerable rainfall on portions of the Panhandle in September 2024. A month later, very limited rainfall was recorded. At Marianna, May, July, and September were the only months with above average rainfall, with 12.5″ of surplus in September alone. October was tied for the driest on record at Marianna, with no rain recorded at all. At the end of the year, the 61″ total seems impressive, yet the year ended with much of the Panhandle back in the Drought Monitor. It was a roller coaster of a growing season going from ample to shortfall and back and forth. Soil can only absorb a few inches before saturation and runoff, and can dry out again fairly quickly without replenishing rainfall.
–
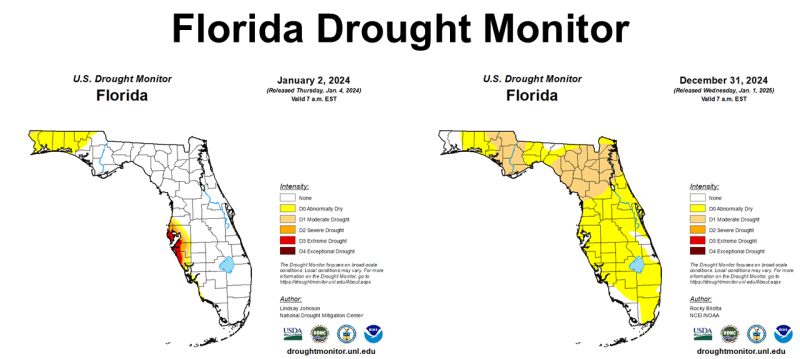
The map above to the left was the Florida Drought Monitor on January 2, 2024. The map to the right was what Florida looked like on the last day of 2024. Only Escambia and Santa Rosa Counties saw improvement by year’s end. Most of Florida dried out considerably after getting drenched by Hurricanes earlier in the year.
–
 Temperatures
While the rainfall was highly variable, the temperatures through the growing season were warmer than normal. There were 34 days in total above 95°. That number is significant because plant reproduction is affected even in peanuts and cotton, that were developed to be productive in the South with hot humid summers. There were also 13 days with lows below freezing, but 7 of those days were in January and the other six in December. The average for the year was 69.2° in Marianna, which was 2.1° warmer than NOAA’s historic average of 67.1° for Jackson County.
–
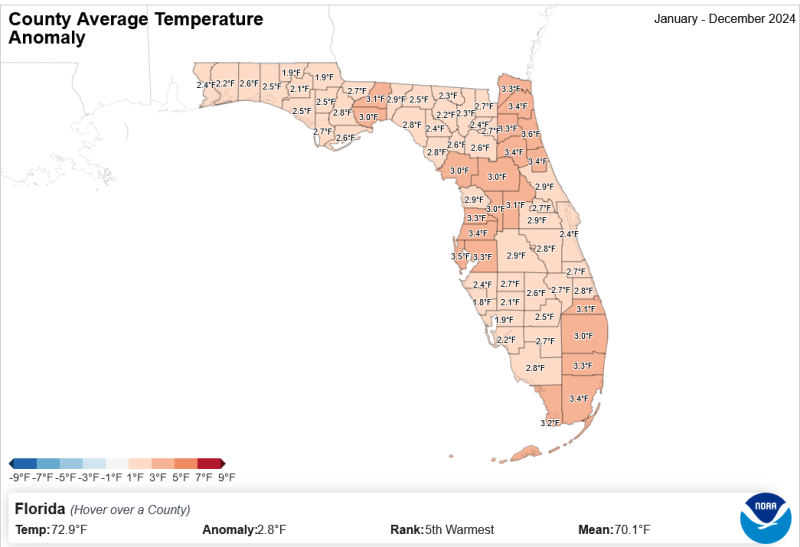
The map above, provided by NOAA’s Climate at a Glance County Mapping, gives you a snapshot of each Florida County in comparison with historic average from each location. You can see that Leon County was 3.1° warmer than historic average, while Holmes and Jackson Counties were 1.9° warmer than average.
–
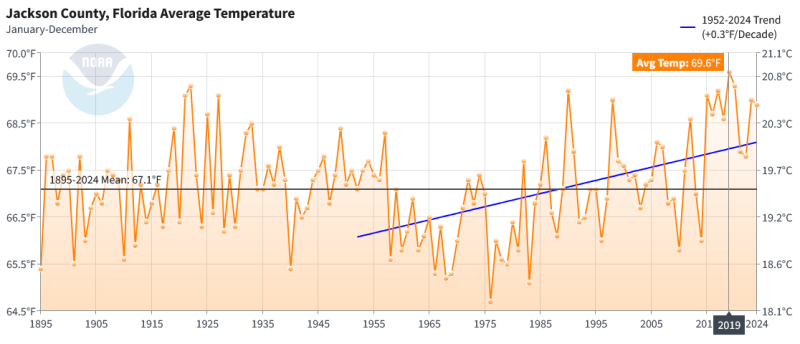
Source: NOAA County Time Series
On this same website, if you click the link for your home county in the listings below the map, you can see how 2024 compared to past years dating back as far as 1895. The map above shows how 2024 compared to past history in Jackson County with a historic annual average air temperature of 67.1° since 1895. The average air temperature in 2024 was 68.9°, while the highest average temperature was 69.6° back in 2019, and the low of 64.7° in 1976. The blue trend-line I added shows how average air temperature has gradually changed during the time that UF/IFAS has been keeping weather data in Marianna. It does show a general trend of +0.3º per decade, but you can also see wide variation from year to year.
Download the full summary of daily weather records from the Marianna FAWN Station, along with monthly rainfall totals from all eight FAWN Stations in the Panhandle, by using the following link:
UF/IFAS 2024 Jackson County Weather Summary
–
Climate Outlook
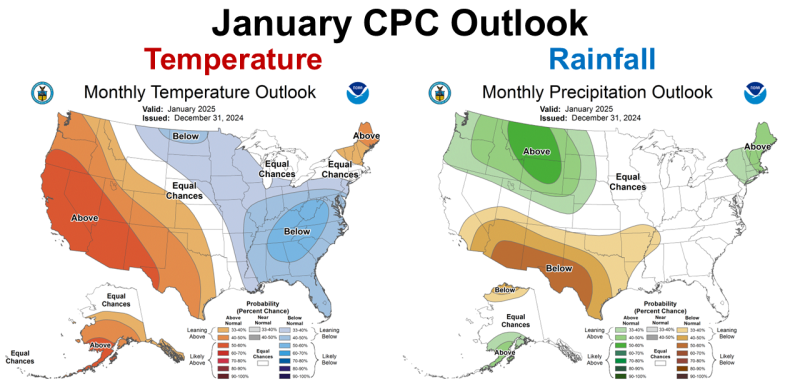
The Climate Prediction Center’s (CPC) January Outlook breaks the trend of recent forecasts. January is anticipated to be cooler than normal, with equal chances for above or below average rainfall. Certainly, the first 10 days of January have been cold, but not extreme for North Florida.
–
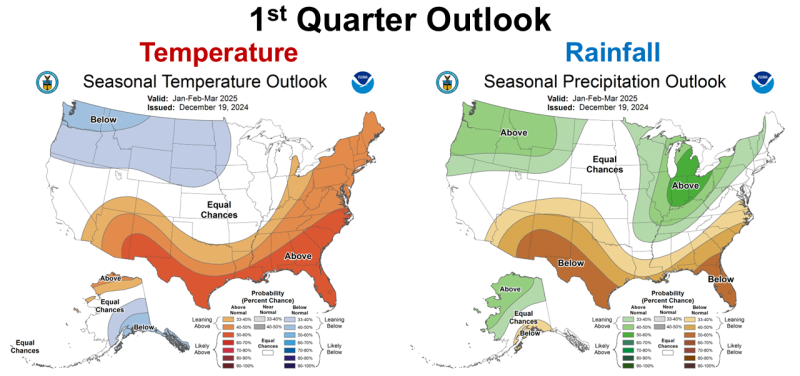
The three-month, January through March Outlook, shows the typical expectation for La Niña winters, with an expectation for warmer and drier than average climate in Florida. The expectation of drier than normal is even stronger in Peninsula and Big Bend regions of Florida in the Eastern Time Zone.
–
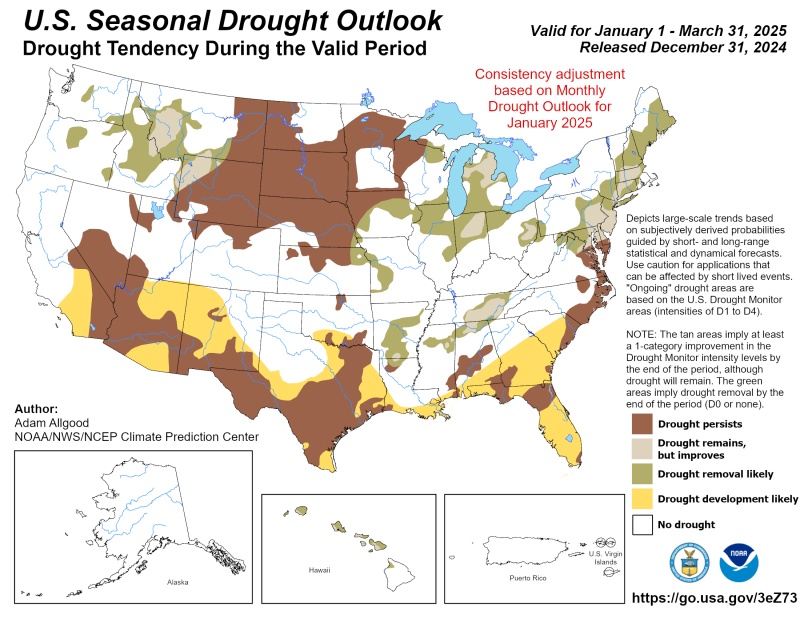
Drought conditions are expected to become widespread throughout Florida, Georgia, and Alabama in the coming months. The map above shows drought projections through March 31st.
–
La Niña Advisory
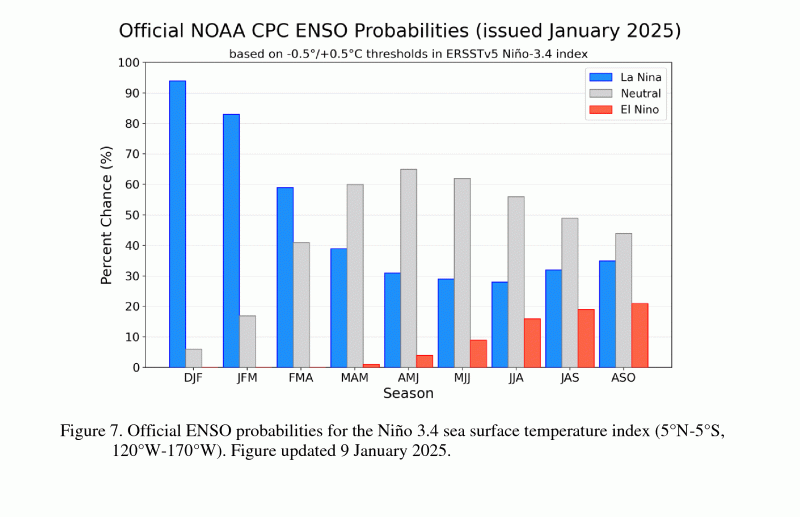
On January 9, the CPC made their announcement that we are indeed in a La Niña ENSO phase. While our weather patterns since October have been very La Niña like, it was not official until this week.
La Niña conditions emerged in December 2024 and were reflected in below-average sea surface temperatures (SSTs) across the central and east-central equatorial Pacific Ocean… Subsurface cooling in the equatorial Pacific Ocean strengthened significantly, with below-average temperatures dominating the central and eastern equatorial Pacific Ocean…The traditional and equatorial Southern Oscillation indices were positive. Collectively, the coupled ocean-atmosphere system indicated La Niña conditions.
The dynamical models in the IRI plume continue to predict a weak La Niña during the winter seasons…The North American Multi-Model Ensemble (NMME) predicts slightly cooler SST anomalies with La Niña persisting through February-April 2025. The forecast team favors the NMME guidance, predicting weak La Niña conditions through the early spring before transitioning to ENSO-neutral. Weak La Niña conditions are less likely to result in conventional winter/spring impacts, though predictable signals can still influence the forecast guidance. In summary, La Niña conditions are present and are expected to persist through February-April 2025 (59% chance), with a transition to ENSO-neutral likely during March-May 2025 (60% chance). Climate Prediction Center – January 9, 2025
 What does this means for farmers and ranchers in the Florida Panhandle?
2024 was not a good year for crop and forage production. Short-term flash drought from higher than normal temperatures and lower than average rainfall made an impact on crop yields, but there were not periods when Panhandle counties were designated in the red D3 Extreme Drought Category of the Weekly Drought Monitor that triggers disaster programs. As I said earlier, we had a roller coaster ride from dry to wet and back and forth. The current climate outlook is not favorable for drought improvement in the 1st Quarter of 2025. La Niña has affected frontal rainfall this winter and is expected to continue to do so through April. The highest probability of 65% for a return to Neutral is the April-June window, but there is a 60% during the March-May time period as well.
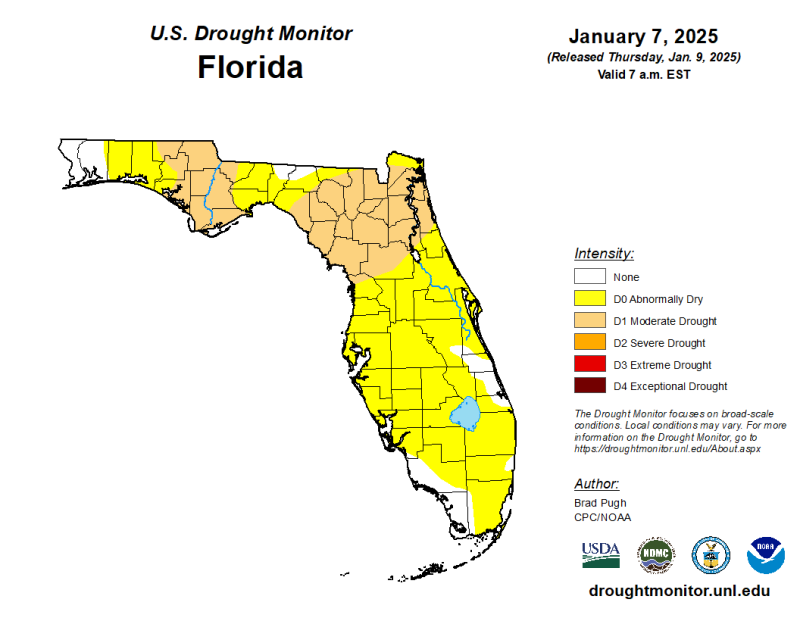 Putting all of these forecast models together, the rainfall outlook through March is not positive. All of the Panhandle counties, except for Escambia and Santa Rosa are currently in the D0 Abnormally Dry (yellow) or D1 Moderate Drought (tan) categories of te Drought Monitor this week (right). It does not appear that normal rainfall patterns will return for the next four months. That will likely mean the corn and vegetables will be planted in drier than normal soils, but those crops are also primary on irrigated fields. The real challenge may come for rainfed or dryland crop fields and pastures in April and May. It is still too early to accurately predict late-spring rainfall, but all the current expectations are for soils to continue to remain dry. I would expect to start the 2025 growing season drier than normal with the hope of a more normal rainfall over the summer. Stay tuned for future forecast updates as we move closer to planting time.
- Friday Feature:Prosperity on the Modern Farm in 1950 - January 30, 2026
- Ranch Record Keeping for Annual Analysis & Innovation - January 23, 2026
- Friday Feature: 2026 Farm Dog of the Year - January 23, 2026

