
Over the last 10 years or so, the Florida Panhandle has gotten used to relatively warm winters, at least historically speaking. While we have experienced sharp cold snaps that were devastating to unprepared plants and livestock (the most recent being the late December dip down into the low to mid-teens in 2022), they haven’t lasted long and, overall, winters have been mild. Anecdotally, it seems like this winter (2024-2025) has been a return to a historical norm, with extended periods of cloudy, dreary cold (including a straight up historic snow event!); but does the data support that feeling? Let’s find out.
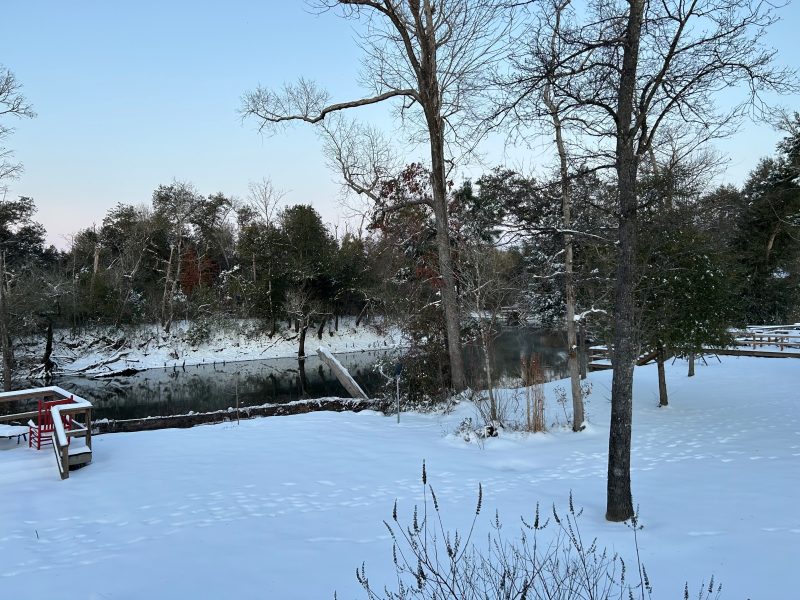
Snow on the banks of the Chipola River, on January 22, 2025, in Calhoun County. Credit: Daniel Leonard, UF/IFAS
–
There are several ways of measuring the relative cold of one winter to the next. You could use weather station data and see what the coldest temperatures a given year received. You could track how many days the mercury dipped below freezing. You could measure the maximum temperatures and compare those year to year. However, for farmers (especially fruit producers), I think the most useful and intuitive comparison of winter intensity from year to year is chill hours.
A chill hour is loosely defined as an hour below 45 degrees. Chill hours play a big role in deciduous fruiting plants’ flowering cycle and ultimately help determine if those plants make fruit the following year or not. While that is important to fruit growers, in this article, we’re more concerned with using chill as a relative comparison of winter intensity year to year. Last winter, the Florida Automated Weather Network (FAWN) station in Marianna logged 444 hours from the period of October 1 to January 27. This winter, that same weather station has logged 588 hours in the same period of time. A little elementary school math tells us we’ve received 144 more chill hours *so far* this year than we received last year – the equivalent of six entire 24-hour days under 45 degrees! That’s pretty significant! However, the historical average over the same time period is 680 chill hours, so we are still lagging behind what the area “used” to receive. Whether this is a result of random climate fluctuations that have happened from time-to-time over a millennia or human-induced warming, there isn’t much doubt that it isn’t as cold as it “used to be”.
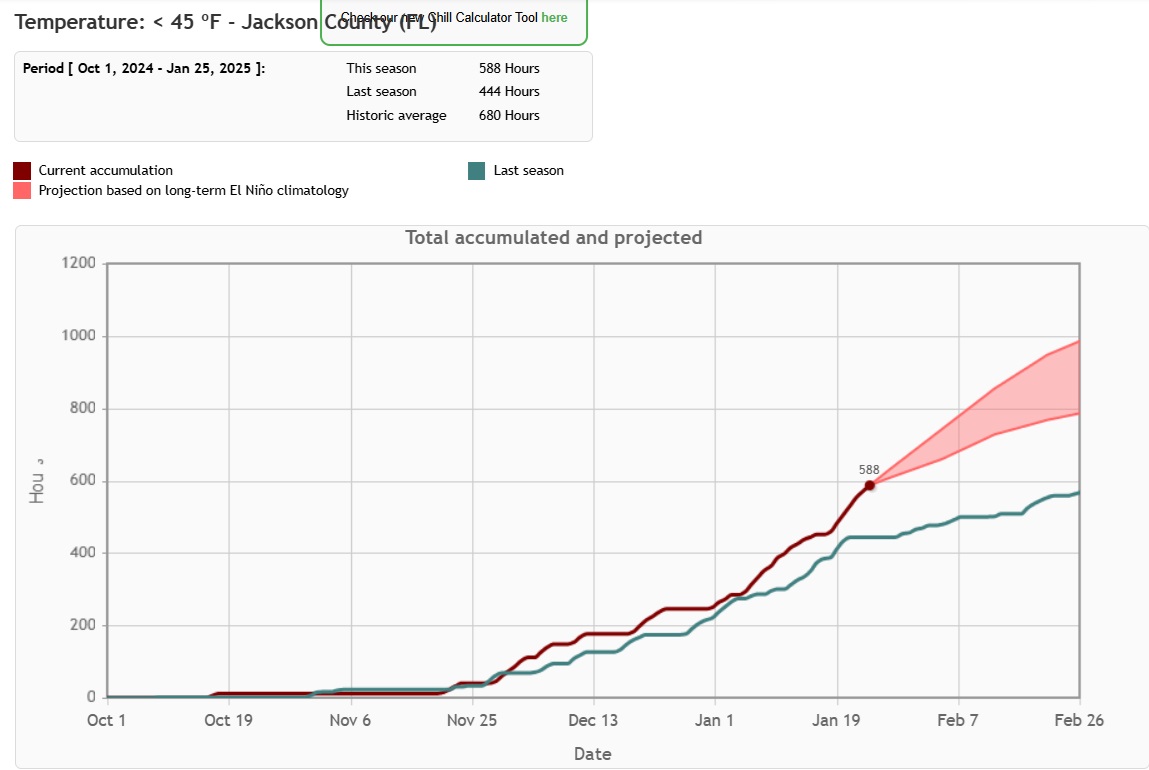
Chill hours graph for Marianna October 2024 to January 2025
–
So yes, this winter has been colder than the last several at the time of this writing. Things have been cold and could remain that way into February and maybe March. However, so far it is not an extreme outlier year, as recency bias seems to indicate. It is important to remember that as frigid as this spate of recent bitter cold has been, it still finds us lagging our historical cold temperature norms a bit.
To track chill hours yourself, visit AgroClimate’s Chill Hours Calculator that utilizes the data from the FAWN Weather Stations in Florida. For more information on our local climate, how it can affect your operation, and strategies to maximize production under our conditions, contact your local Extension Office. Bundle up out there and enjoy what remains of the coldest winter in several years!
- Get your Pesticide Applicator CEUs – February 10 & 12 - January 16, 2026
- Stay Ahead of Peanut Fungal Pathogens This Summer - August 8, 2025
- Panhandle Cotton Acres Are Down in 2025– Here’s the Reason - July 11, 2025