
 Rainfall
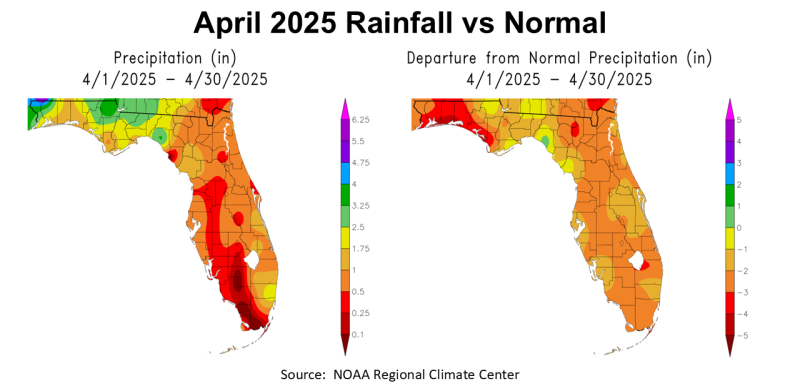
April was another dry month in the Florida Panhandle, but not as bad as in Central and South Florida. The map to the left above shows an estimate of actual rainfall in April. The Panhandle ranged from 1-1.75″ (tan), 1.75-2.5″ (yellow), 2.5-3.25″ light green, and 3.25-4″ (dark green), with an isolated area over 4″ in blue or purple. The map to the right above shows how April 2025 rainfall compared to historic average. Almost the entire state of Florida was below average, except for a small area in green in Taylor County. Part of the Panhandle, the area shaded red, was at least -3″ below normal.
–
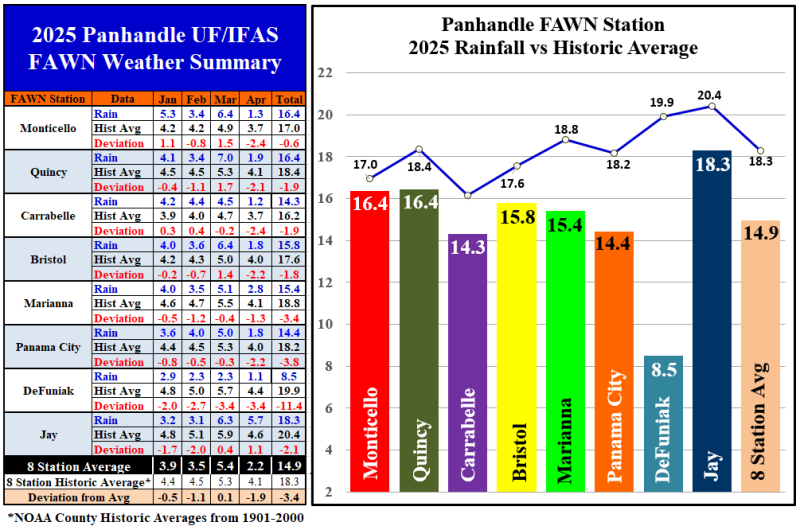
The rainfall data from the eight Florida Automated Weather Network (FAWN) Stations provides a more precise picture of the variation in rainfall in April 2025. The eight stations ranged from a low of 1.1″ in DeFuniak Springs, which was -3.4″ below average, to 5.7″ at the Jay Station, 1.1″ above historic average for the month. These two weather stations are <70 miles apart. The average of all eight stations in April was 2.2″, which was -1.9″ below normal.
Through the first four months of 2025, the average of all eight FAWN stations was 14.9″, -3.4″ below average. The wettest location was in Jay with 18.3″ so far in 2025, which was still -2.1″ below normal for that location. By contrast, the DeFuniak station has only recorded 8.5″ through April, -11.4″ below average. You can see in the bar graph above that all of the eight FAWN stations were below average so far in 2025.
–
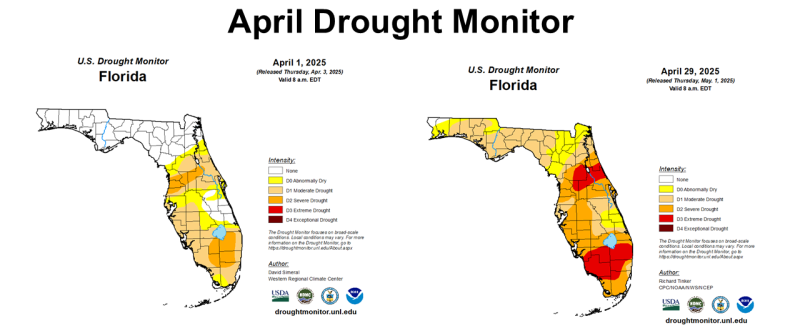 The Florida Drought Monitor from April 1st and April 29th shows how the entire state got much drier in the month of April. By month’s end, much of the Panhandle was in the Moderate Drought Category (tan). South of Lake Okeechobee was moved into the Extreme Drought Category (red), along with a few counties in Central Florida. May rainfall has improved this situation somewhat, but Florida was really dry at the end of April.
–
 Temperatures
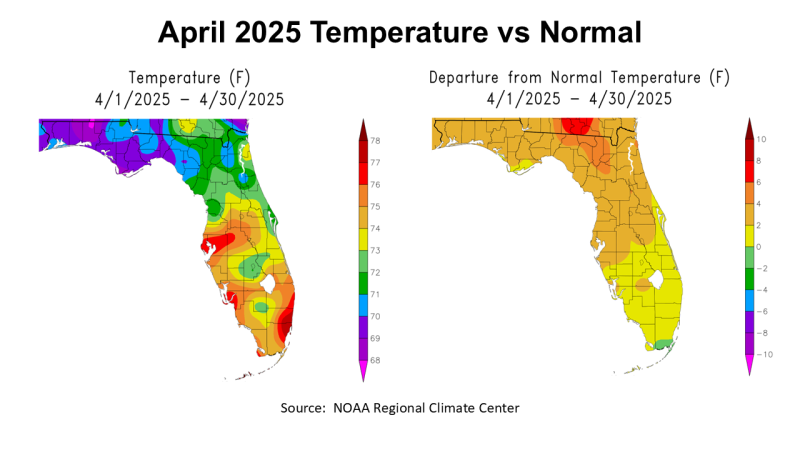
 In the map to the left above you can see the average air temperature variation across Florida in April. The map to the right shows the deviation from normal temperatures. So, while April was a pretty pleasant month, it was 2-4° warmer than average for most of North Florida, but there was an area from Jefferson County east to Lake City (shaded in orange) that was 4-6° warmer than normal.
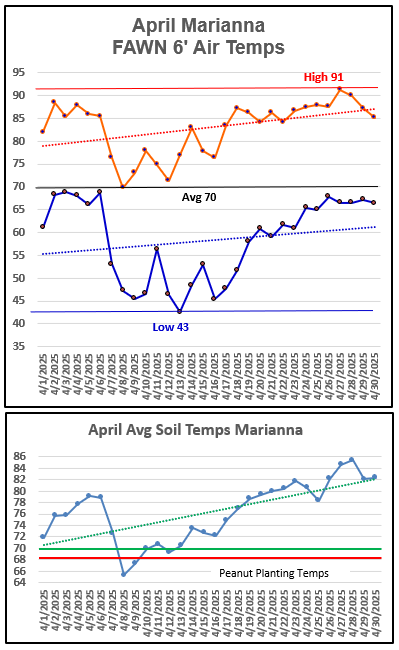
The charts to the right show daily temperatures from the Marianna FAWN Station in April. The 6′ air temperature low was 43° on the morning of April 13th, and the high was 91° on the afternoon of April 27th, for a total range of 48° between the two. The average 6′ air temperature was 70° for the month.
As seen in the bottom chart to the right, average soil temperatures rose significantly through the month, ranging from a low of 57° on April 9th, to a high of 77° on April 28th. The two lines designate the minimum (red) and optimum (green) temperature for peanut seed germination. You can see that in April 2025, optimal germination would have occurred from April 13 on. The dotted trend line shows how rapidly the soil temperature increased in April.
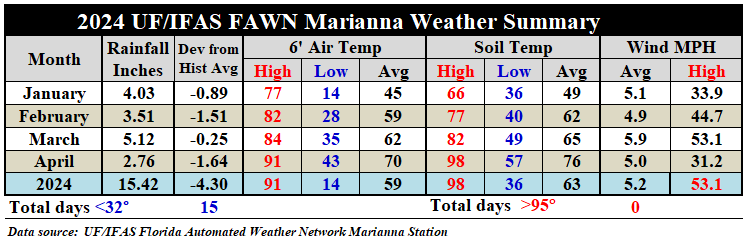
The weather summary chart below showed that, compared to March, the Average air temperature in April rose 8°, from 62° to 70°. Average soil temperatures rose 11°, from 65° in March to 76° in April. The daily high soil temperature jumped from 82° on March 29, to 98° on April 27 and 28. So, not only was there a lack of rainfall, but soils were also rapidly heating up as they continuously dried out.
–
Climate Outlook
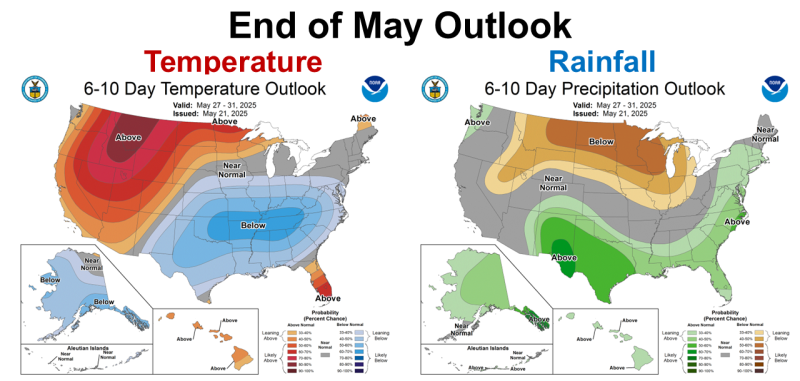
Since we did not send out a newsletter the last two weeks, due to conferences in the state, I did not provide an outlook for the entire month of May. The following outlook graphic shares the Climate Prediction Center’s (CPC) short-term forecast for the remainder of May. The CPC is expecting a cooler and wetter than normal end to the month for much of the Panhandle. Typically, the last week of May is hot and dry, so if this holds true, that would be a pleasant surprise.
 –
–
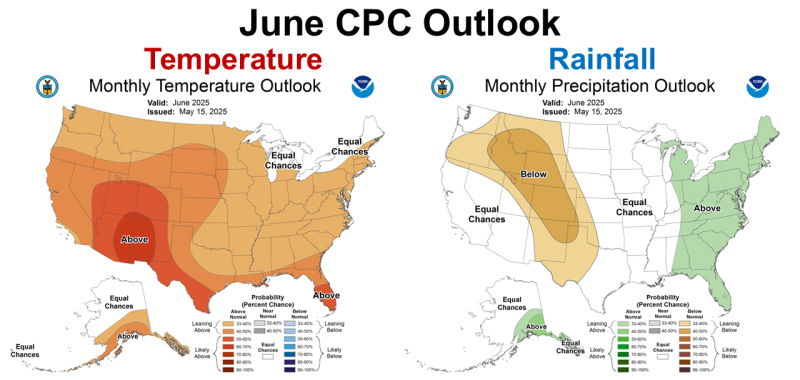
The June CPC Outlook below is more typical, with an expectation of above average temperatures along the Gulf Coast, and wetter than normal rainfall for the entire East Coast of the Southeast.
 –
–
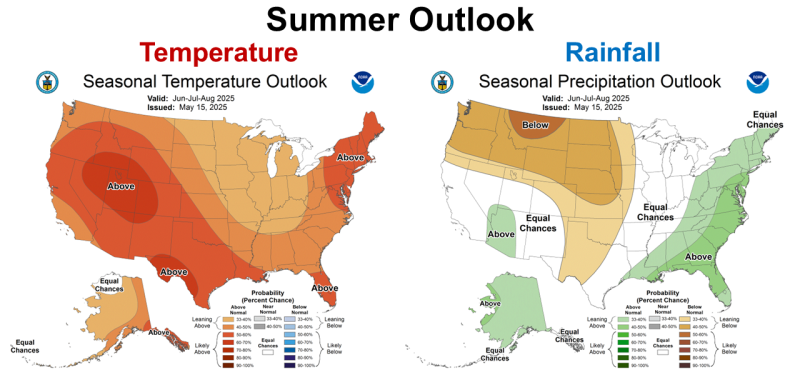
The longer range, CPC 3-Month Outlook this summer is fairly similar to the June Outlook. They are expecting a warmer than average and wetter than average summer for the entire East Coast of the U.S. Based on this forecast, we should have a better growing season than the past two years, but you really can’t make specific predicts from this. As we saw last year, it is not how much rain you get in total, but adequate rainfall with even distribution.
–
ENSO Outlook
Climate forecasters have been tracking the ENSO Outlook for many years, because of its effect on our climate. The chart and short summary below were from the monthly ENSO Discussion published by the CPC, on May 8, 2025. Predicting the ENSO phase this fall and winter this early in the year is challenging for forecasters. Currently, they agree that the greatest probability is for ENSO Neutral to continue, but you see in the probability chart below that their confidence of a Neutral fall and winter diminish as we close out 2025. So, it is possible that we might have another La Niña winter again, but very unlikely that we will have an El Niño.
 The following summary shares the latest climate information that was used to create the probability chart above.
ENSO-neutral is favored through the Northern Hemisphere summer 2025 (74% chance during June-August), with chances exceeding 50% through August-October 2025.
In April 2025, ENSO-neutral continued, with near-average sea surface temperatures (SSTs) covering most of the equatorial Pacific Ocean. All of the latest weekly Niño index values were near zero, ranging from -0.2°C to +0.1°C . Subsurface temperatures were mostly near average in the central and eastern Pacific Ocean, with above-average subsurface temperatures remaining at depth in the western Pacific. For the month, low-level and upper-level winds were near average across the equatorial Pacific. Convection remained suppressed near and west of the Date Line and was enhanced near Indonesia. Collectively, the coupled ocean-atmosphere system was ENSO-neutral.
The IRI and North American Multi-Model Ensemble anticipate ENSO-neutral will continue through the Northern Hemisphere summer and early autumn 2025. The forecast team also favors ENSO-neutral, especially through the summer, with chances nearing 50% during the autumn. The uncertainty increases at longer time horizons, with a 46% chance of ENSO-neutral and a 41% chance of La Niña during November 2025 – January 2026 (chances of El Niño are under 15%). In summary, ENSO-neutral is favored through the Northern Hemisphere summer 2025 (74% chance during June-August), with chances exceeding 50% through August-October 2025. Climate Prediction Center – May 8, 2025
–
What does this mean for Panhandle farmers and ranchers?
There is reason for optimism for this growing season. The past two years have been challenging other than the month of July. The growing season is off to a dry start, but that is expected to change soon. Forecasters are predicting a wetter than normal end to May, and the month of June. It appears that we are heading to a more rainy period. Bear in mind, however, that historically ENSO Neutral years had more tropical storm activity. 2024 was an above average rainfall year, but there were extended periods of flash-drought (high temperatures and low soil moisture) and periods with extreme rainfall. Hopefully the rainfall will be more even this year. Based on this current long-range forecast, there are somethings to keep in mind. Stay timely on herbicide and fungicide applications, as wetter years also benefit weeds and fungal diseases. Hay harvest timing may be more challenging than the past two years, so base those decisions on short-term forecasts. It does appear that crop yields should improve over the previous two years. It is very possible that we will have a more normal fall and winter this year as well. I will admit though, that I struggle to recognize what the new normal climate for our area is at this point. Our climate has shifted, with March and June no longer as wet as they once were, and May and October being wetter than they used to be. For certain our climate has become less predictable, and that does seem to be the new normal. Stay tuned as we get more weather data and climate updates in the coming months.

demayo@ufl.edu - 850-482-9620
Follow me on Twitter
@UFCowman
- 2025 Weather Summary and 2026 1st Quarter Outlook - January 16, 2026
- 2025 Average Farmland Rental Rates, Lease Agreements, and Worker Wages Summary - January 16, 2026
- Friday Feature:1954 How to Dial Your Phone - January 16, 2026