
 Rainfall
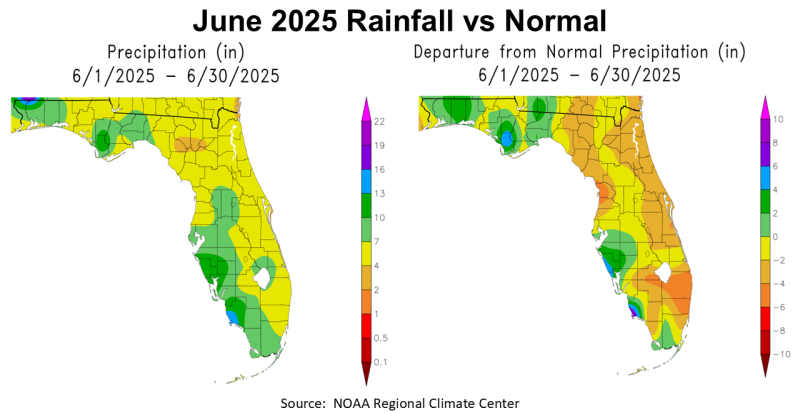
For many years June was a wet summer month, but lately has been more variable. June 2025 rainfall was not uniform in the Panhandle with some counties above average and many slightly below average. The map above to the left shows the variation with counties in yellow 4-7″ , in light green 7-10″, dark green 10-13″, and in blue 13-16″. The map above to the right compares June rainfall to historic average, ranging from yellow 0-2″ below average, light green 0-2″ above average, dark green 2-4″ above average, and blue 4-6″ higher than normal.
–
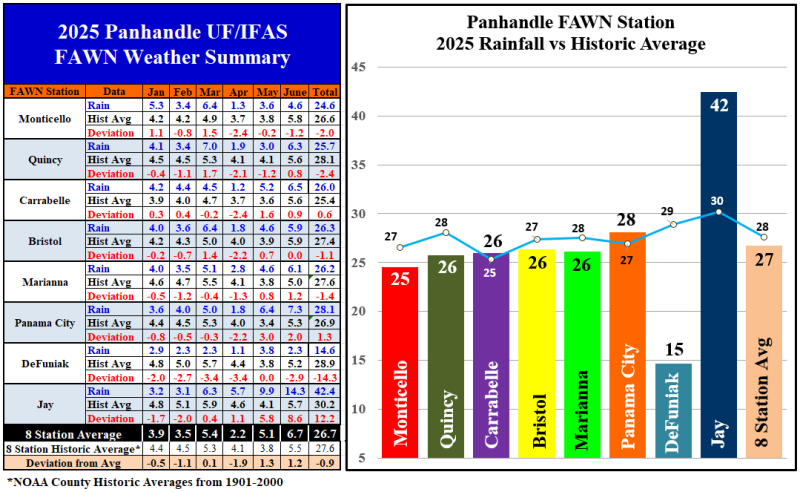
The chart above shows the rainfall recorded at the eight Florida Automated Weather Network (FAWN) stations. In June the driest location was DeFuniak Springs with only 2.3″, which was -2.9″ below normal. Compare that with the whopping total of 14.3″ that was recorded at the Jay station, 8.6″ above normal. The average for all eight stations was 6.7″, 1.2″ above average. The dry areas got drier and the wet areas got a whole lot wetter.
Through the first half of 2025, the average for all eight stations was 26.7″, which was -0.9″ below average. The station at Jay has recorded 42.4″ so far this year, 12.2″ higher than historic average. The DeFuniak Springs FAWN Station has only recorded 14.6″ for the last six months, -14.3″ below normal.
–
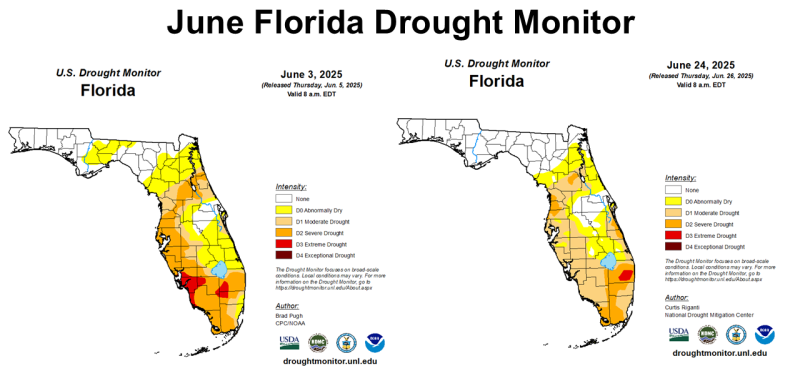
The Florida Drought Monitor shows that most of Florida saw drought improvement in June, except for a pocket south of Lake Okeechobee that has been in drought much of 2025. Most of North Florida was drought free at the end of the month, but much of the Peninsula is still really dry.
–
 Temperatures
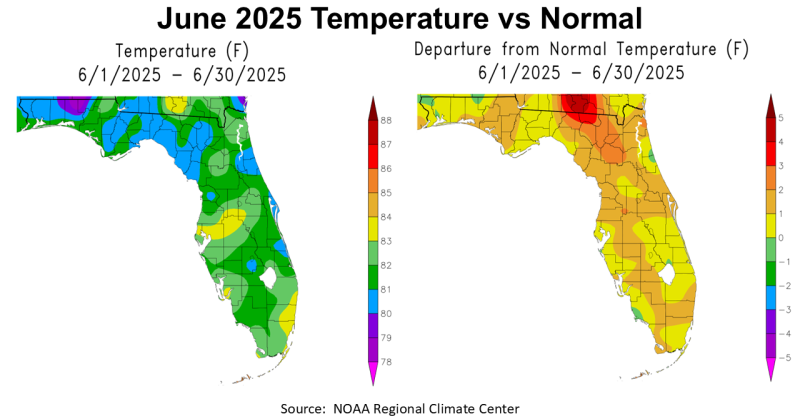
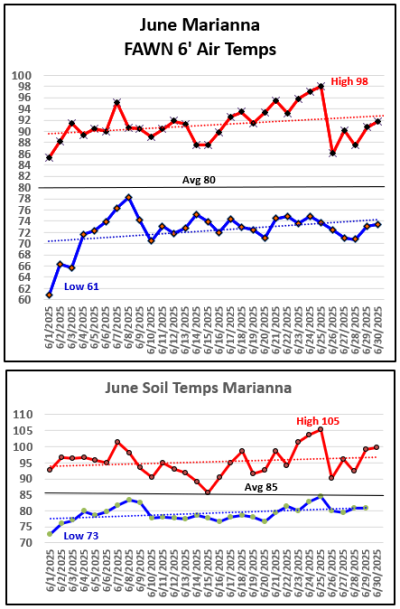
Temperatures continued to heat up in June. In the maps above you can see that much of Florida was 1° to 2° warmer than normal in the area shaded in tan. Only the areas with heavy rainfall were slightly cooler than average. The chart to the right shows the temperatures measured at the Marianna FAWN Station. The high for the month was 98° on June 25th, with a low of 61° on June 1st. The average air temperature was 80°.
The -4″ soil temperatures ranged from a low of 73° on June 1st to 105° on June 25th. The soil was 84° at the start of the day on the 25th. The average soil temperature in June was 85°.
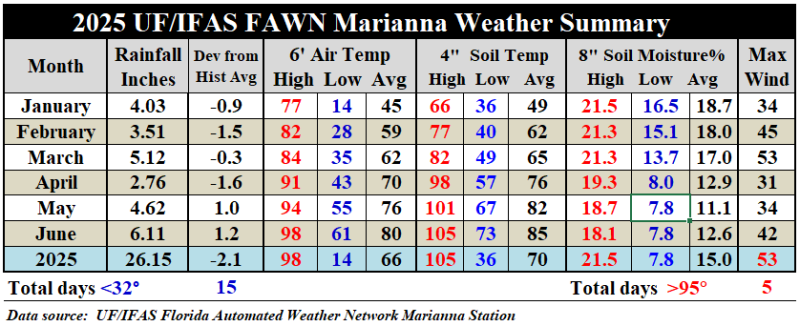
The chart below shows a summary from the first six months of 2025, at the Marianna FAWN Station. The average air temperature increased 4° in June, from an average of 76° in May to 80° in June. There were 5 days in June over 95°, which is not good for crop production, but is lower than past years. The average soil temperature increased 3°, from 82° in May to 85° in June. You can also see the 6 month total at Marianna was 26.15″ which was -2.1″ below historic average.
Something new in 2025, the FAWN stations have started measuring soil moisture at different depths to help with irrigation scheduling. June -8″ soil moisture ranged from a high of 18.1% to a low of 7.8%, with an average of 12.6%. This seems to be a very useful measurement to give a snapshot of how dry or wet the soil has become. A thunderstorm passing through created a top wind speed of 42 mph in June.
 –
–
Climate Outlook
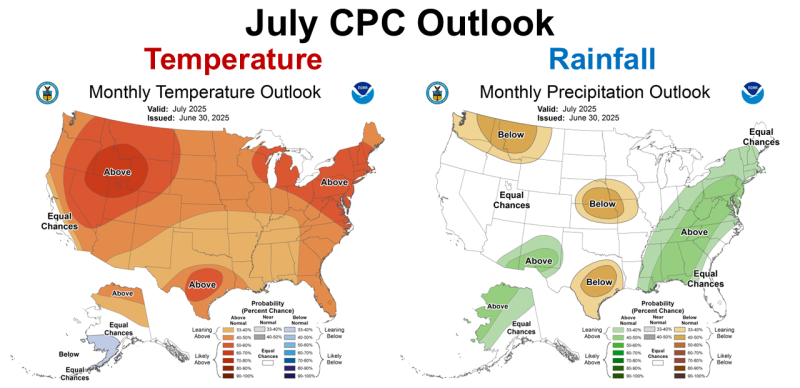
The Climate Prediction Center (CPC) is expecting the hotter than average trend to continue in July throughout the whole U.S. They also expect much of the eastern states to have higher than average rainfall with the exception of the Florida Peninsula. It is sort of interesting that this outlook map was issued on June 30th, and look at the CPC forecast for South Central Texas in July. Certainly the tropical storm played a major role in the terrible flooding that took place last week in that area.
–
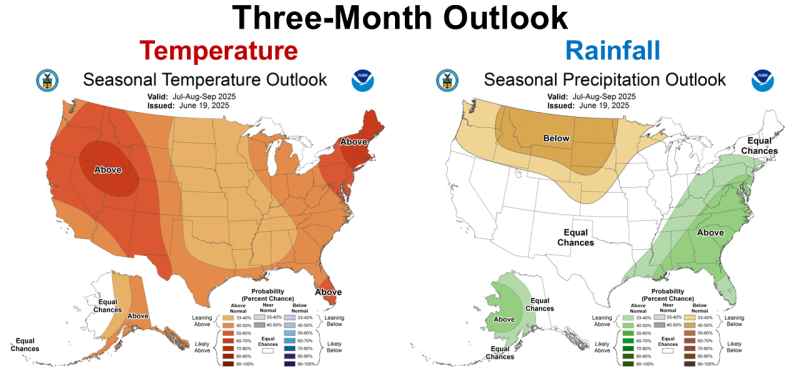
The longer ranged, three-month outlook does include all of Florida with the expectation of above average rainfall, but they were somewhat less certain of this for South Florida vs North Florida.
–
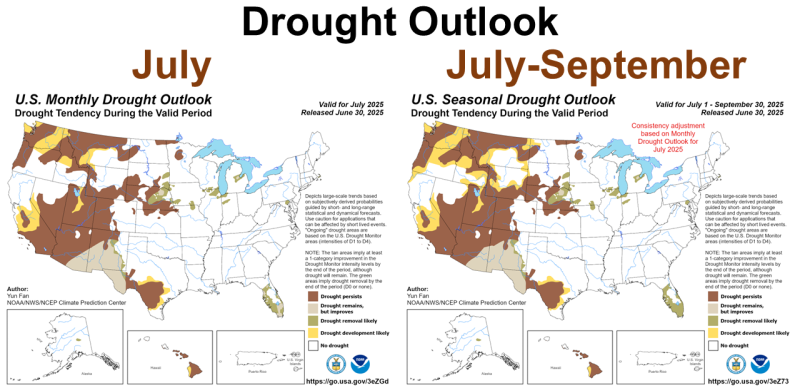
The CPC also issued drought outlook maps that predict drought improvement for South Florida in the coming months. Drought is not expected in North Florida through September.
–
ENSO Watch
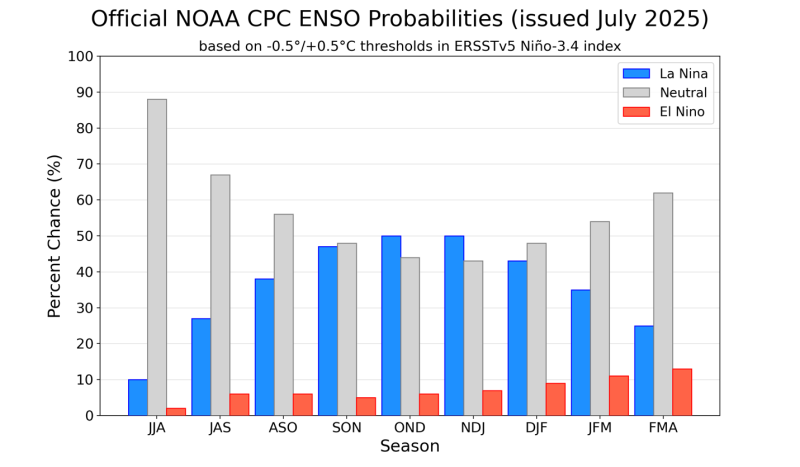
This month the CPC is starting to lean more towards a potential La Niña this fall and winter. Summer predictions are more challenging, but this is a subtle change from their monthly discussion in May. This could mean that after a wetter than average growing season, soils may get drier than normal in the fall. This could be positive for crop and hay harvest, but the chances of either Neutral or La Niña are fairly even.
During June 2025, ENSO-neutral continued, with near-average sea surface temperatures (SSTs) prevailing across most of the equatorial Pacific Ocean… Subsurface temperature anomalies were weakly positive and nearly unchanged from last month…Over the east-central and eastern equatorial Pacific Ocean, low-level wind anomalies were easterly and upper-level wind anomalies were westerly. Convection remained enhanced over Indonesia. Collectively, the coupled ocean-atmosphere system in the tropical Pacific reflected ENSO-neutral.
The IRI predictions indicate ENSO-neutral is most likely through the Northern Hemisphere winter 2025-26. In contrast, the North American Multi-Model Ensemble favors the onset of La Niña conditions during the Northern Hemisphere fall, though lasting a shorter duration than NOAA’s requirement of five consecutive overlapping 3-month seasons. While the subsurface equatorial Pacific remains above average, easterly trade winds are predicted to strengthen in the coming month, which could portend cooler conditions. In summary, ENSO-neutral is most likely through the late Northern Hemisphere summer 2025 (56% chance in August-October). Thereafter, chances of La Niña conditions increase into the fall and winter 2025-26, but remain nearly equal to ENSO-neutral. Climate Prediction Center June 10, 2025
–
What does this mean for Panhandle farmers and ranchers?
The Panhandle has moved out of the Drought Monitor and and is not expected to return through September. So far the hurricane season has been pretty calm, but we know that will change in the coming months. ENSO Neutral years tend to have greater tropical storm development. The Western Panhandle has been wet and the Eastern Panhandle slightly below or near average. Based on the current outlooks, it appears that 2025 will be more typical for rainfall. July is normally the wettest month of the year, so even dryland fields should continue to produce average or above average yields. Finding multiple days without rainfall for hay production may be more challenging this summer, but at least the grass is growing well this year. There are certainly dry spots in the Panhandle this summer, but the majority of the region should continue to see regular rainfall. The forecast is positive, so that is what we should expect to continue over the next three months. Stay tuned for ENSO predictions over the next few months to see what we should expect this winter.

demayo@ufl.edu - 850-482-9620
Follow me on Twitter
@UFCowman
- 2025 Weather Summary and 2026 1st Quarter Outlook - January 16, 2026
- 2025 Average Farmland Rental Rates, Lease Agreements, and Worker Wages Summary - January 16, 2026
- Friday Feature:1954 How to Dial Your Phone - January 16, 2026