
 Rainfall
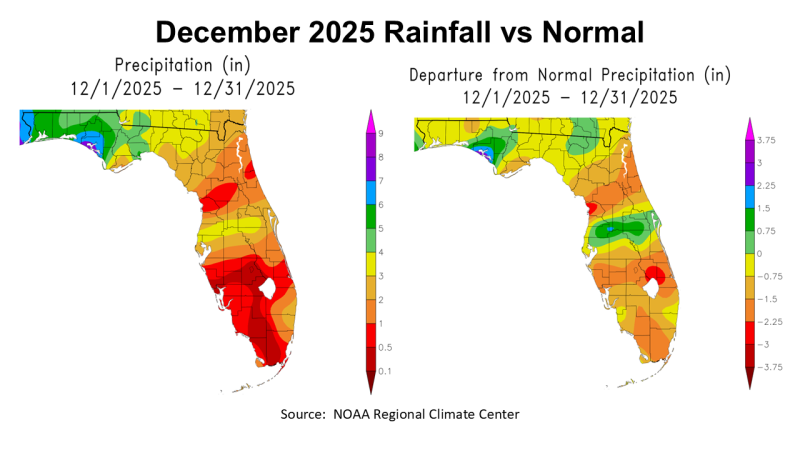
2025 was a challenging year for farming and ranching. The year started with the big snow and very cold temperatures that prevented satsumas from making fruit. Crop farmers planted into dry soils with long dry spells throughout the growing season and ended with significant drought through harvest. December rainfall did bring some drought relief to much of the region, but not enough to overcome the shortfall. In the Florida map to the left above you can see the estimated rainfall that fell in December 2025 across Florida. Rainfall ranged from 6-7″ (blue) in Escambia and Bay Counties, to 5-6″ (dark green), 4-5″ (light green), 3-4″ (yellow), or 2-3″ (gold), and so on. While there was significant rainfall in the Panhandle, much of the state received less than 3″ in December. The map to the right shows departure from normal rainfall. Only small portions of the state were above average in blue or green.
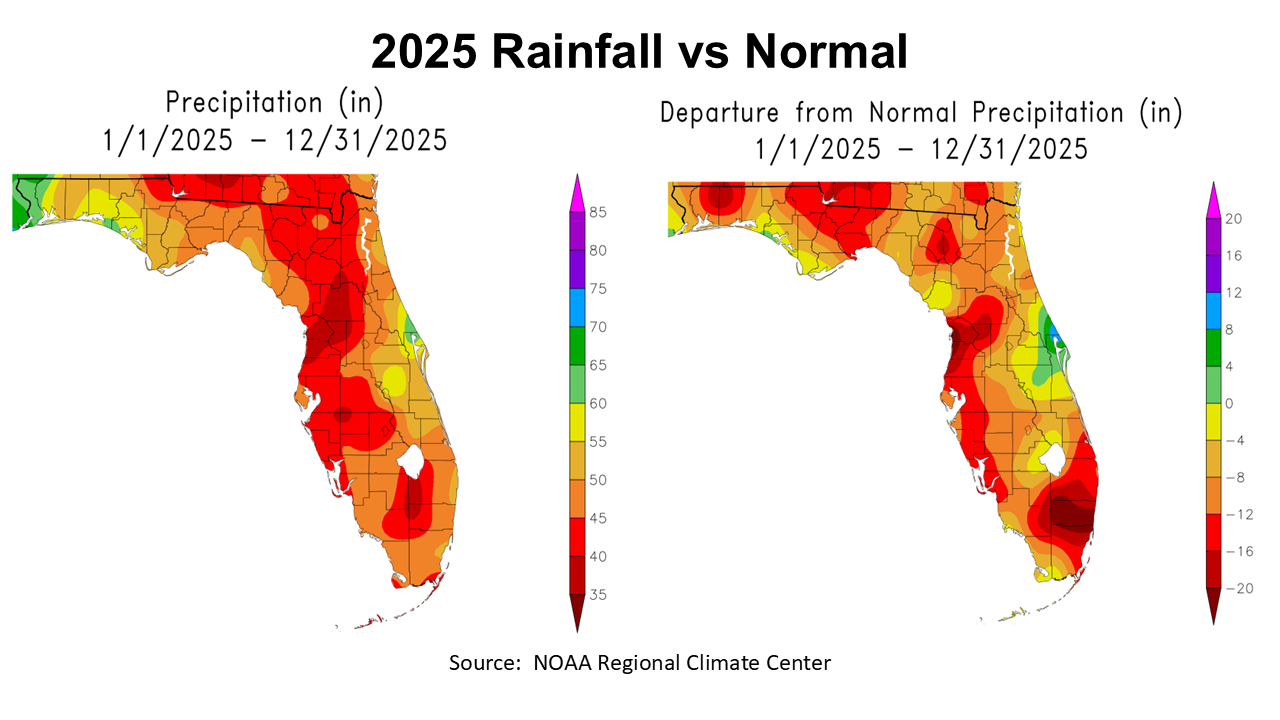
The next set of maps above estimated rainfall for all of 2025, as compared to historic average. In the map to the left, you can see that only small portions of the state received 60″ or more inches (green) last year, with most of the state in the <55″ (gold), <50″ (orange), and a large portion in the <45″ (red) category. In the map to the right, you see how 2025 rainfall compared with historical average annual rainfall. Very small portions of the state in green or blue were above average, while most of Florida ranged from -4 (gold) to as many as -20″ (deep red) below normal.
–
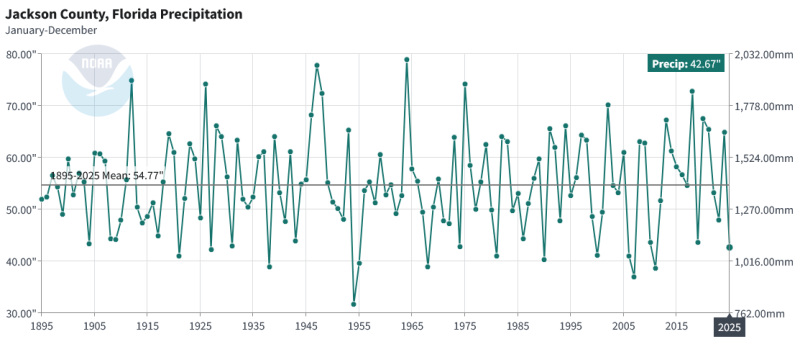
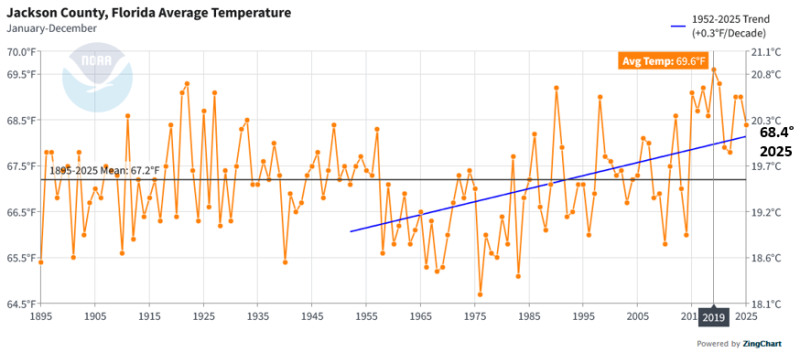
Another interesting tool that NOAA provides is their Climate at a Glance online tool that lets you compare different climate data for specific counties. The chart above shows annual rainfall for Jackson County from 1895 to 2025. The driest year was 1954 when only 31.76″ fell. In more recent history, only 36.99″ were recorded in 2007, and 38.68″ in 2011. So, 42.67″ the total in 2025, and was the 13th driest year, and the driest we have had in the last 14 years. Using this tool will show some variation from the data collected at each FAWN station location. You can compare single months or the entire year to historic average for each county, so if you don’t have a FAWN station nearby, you can see NOAA’s estimates for your home county.
–
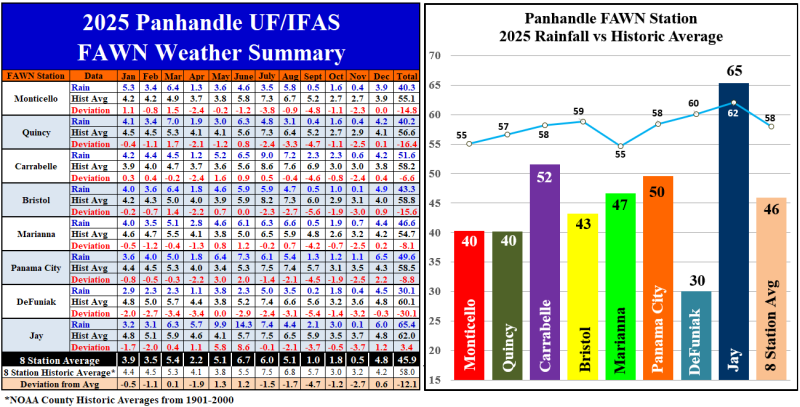
The eight Florida Automated Weather Network (FAWN) stations in the Panhandle provide a more accurate depiction of the varying rainfall in 2025. In December 2025, the FAWN station in Panama City collected 6.5″, 2.2″ above normal for the month. The driest location was in Monticello, where only 3.9″ was recorded, which was average for that location in December. The average for all eight locations was 4.8″, 0.6″ higher than normal.
The annual rainfall total for seven of the eight stations was well below average. The Jay FAWN Station recorded 65.4″, which was 3.4″ higher than normal. Contrast that with only 30″ that was captured in DeFuniak Springs, -30.1″ below historic average. The average for all eight FAWN stations was 45.9″, which was -12.1″ below normal.
–
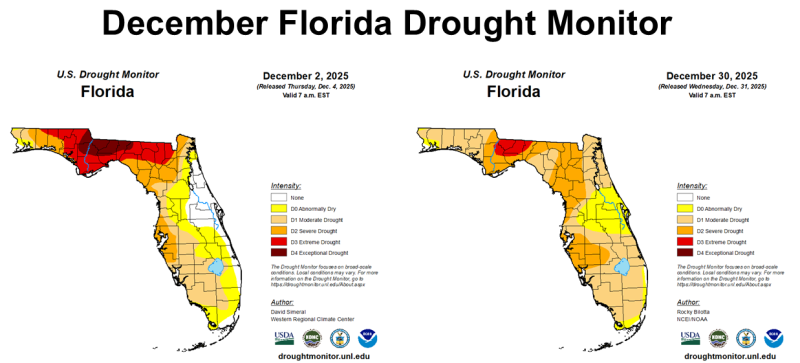
At the end of November, Drought conditions were exceptional (brown) or extreme (red) across much of the North Florida. December rains did bring improvement to portions of North Florida, but conditions grew worse through the Florida Peninsula. In the map to the right, you can see that the entire state of Florida was shown in one of the drought categories.
–
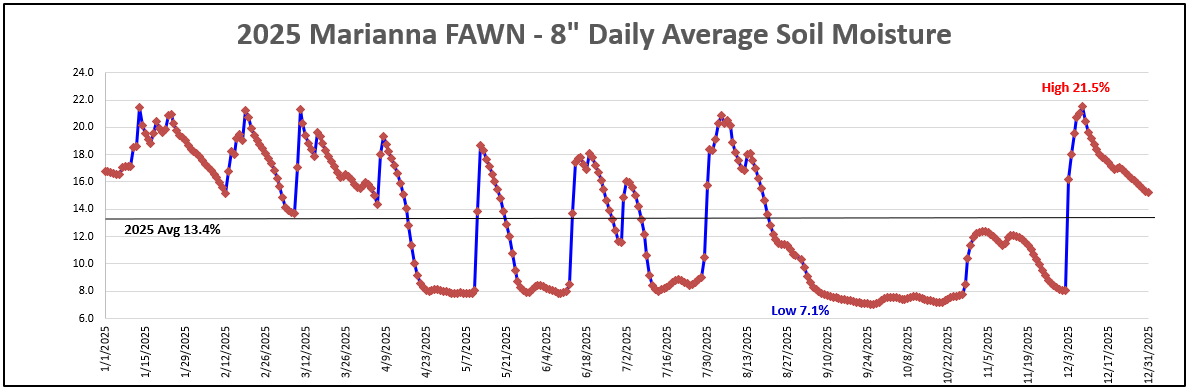
A tool I have been using at end of each month that was new this year was the soil moisture data collected at the Marianna FAWN station. The chart above shows the average daily -8″ soil moisture from the Marianna FAWN Station. You can really see roller coaster of soil moisture in 2025 at that location. The chart above shows how moisture changed over each 2-week period. There were six points in the year where moisture climbed over 20%, but there were also four extended periods where moisture stayed below 10%. This chart shows how dry we got in August through November. For the entire year, the Marianna FAWN Station was -8.1″ below the 74-year average, but that number alone does not tell the whole story. This chart shows the value of monitoring soil moisture as an aid as to when to trigger irrigation to maintain crop productivity.
–
Temperatures
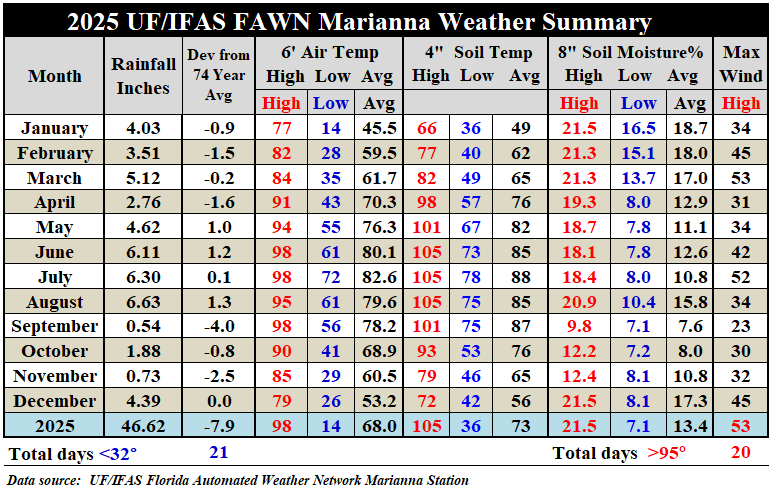
Th chart above shows an overall weather summary for the Marianna FAWN station. NOAA reported 42.67″ of rainfall for Jackson County, but this data shows that at that specific weather station between Marianna and Greenwood, the annual rainfall total was 46.62″. The chart also shows how temperature varied from month to month. For instance, the Average air temperature dropped 7.3° from an average of 60.5° in November to 53.2° in December. The average soil temperature dropped 9°, from 65° in November to 56° in December. Use the following link for the complete weather summary from the Marianna FAWN Station and the monthly rainfall summary from all eight FAWN stations in the Panhandle: 2025 Jackson County Weather Summary
While 2025 was much drier than normal, average air temperatures were 1.2° above normal. The blue trend line follows the same timeline as rainfall data has been collected at the Marianna research station. You can see that the general trend since 1952 has been an increase of 0.3° per decade. 2019 was the hottest recorded annual average of 69.6°, so you can see that there is variation from year to year.
 –
–
1st Quarter Outlook
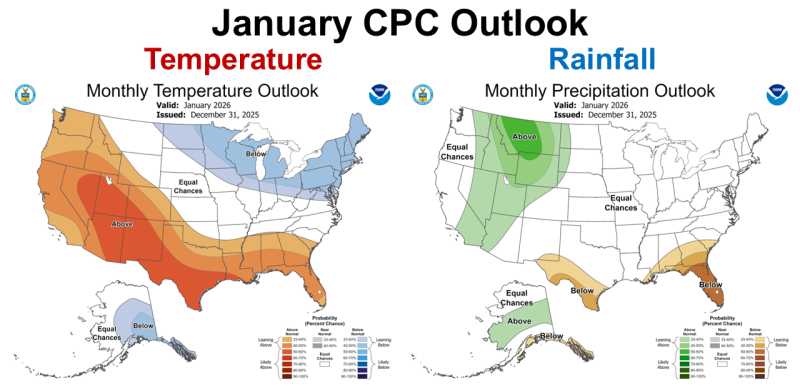
The Climate Prediction Center (CPC) updates their climate outlook maps every two weeks. The warmer than average and below normal rainfall forecast continues for January. No real surprise here as we are halfway through January as I write this article. The cold fronts just don’t pack much punch moving across the Gulf Coast States in La Niña years.
–
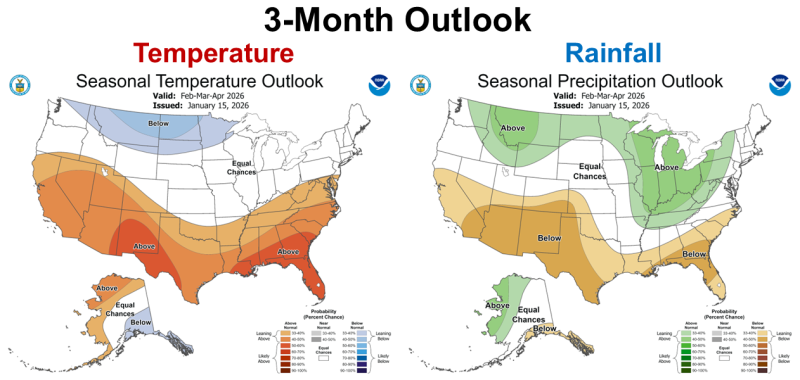
On January 15th, the CPC issued the February through April 2026 Climate Outlook maps. The big change is that the below average zone for rainfall expands to include the whole southern regions of the U.S.
–
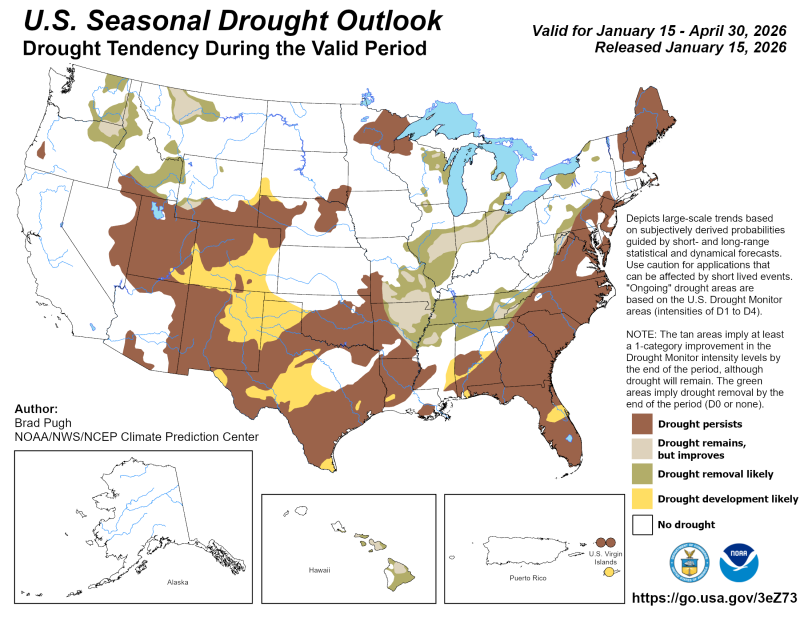 The CPC also updated their Seasonal Drought Outlook map this week. A dry start to the 2026 growing season is expected all across Florida.
–
 La Niña Advisory
Early predictions from the CPC indicated that La Niña would end in the early part of 2026. The current prediction is that the most likely change back to ENSO Neutral will come in the February through April time frame.
In December 2025, La Niña was reflected in the continuation of below-average sea surface temperatures (SSTs) across the east-central and eastern equatorial Pacific Ocean… Atmospheric anomalies across the tropical Pacific Ocean remained consistent with La Niña…Collectively, the coupled ocean-atmosphere system remains consistent with La Niña. The IRI multi-model predictions indicate ENSO-neutral will emerge during January-March (JFM) 2026. In conjunction with the North American Multi-Model Ensemble, the team favors ENSO-neutral to develop during JFM 2026. Even after equatorial Pacific SSTs transition to ENSO-neutral, La Niña may still have some lingering influence through the early Northern Hemisphere spring 2026. For longer forecast horizons, there are growing chances of El Niño, though there remains uncertainty given the lower accuracy of model forecasts through the spring. In summary, La Niña persists, followed by a 75% chance of a transition to ENSO-neutral during January-March 2026. ENSO-neutral is likely through at least the Northern Hemisphere in late spring 2026.
–
What does this mean for Panhandle farmers and ranchers?
Based on the most recent climate outlook information, it appears that the 2026 growing season will start where the 2025 season ended, DRY! I would encourage planting early season crops such as field corn, melons, and vegetables be closely tied to recent rainfall and positive soil moisture. Forage planting in late March and early April would be similar. Even if the ENSO phase changes to Neutral in the coming months, it may happen too late to get adequate soil moisture recharge from cold front rainfall. There is some hope in the current expectation of a switch to El Niño and a wetter than normal weather pattern as the 2026 growing season progresses. So, if you can get a crop off to a decent start, conditions should improve through the summer this year. While it is still too early for high confidence in an accurate prediction, the current outlook for this fall is more positive than last year.
–
Links for more information:
–
County Climate at a Glance
–
Monthly ENSO Update (next one comes out on February 12)
–
2025 Jackson County Weather Summary
–
Florida Automated Weather Network (FAWN)

demayo@ufl.edu - 850-482-9620
Follow me on Twitter
@UFCowman
- 2025 Weather Summary and 2026 1st Quarter Outlook - January 16, 2026
- 2025 Average Farmland Rental Rates, Lease Agreements, and Worker Wages Summary - January 16, 2026
- Friday Feature:1954 How to Dial Your Phone - January 16, 2026