
Rainfall
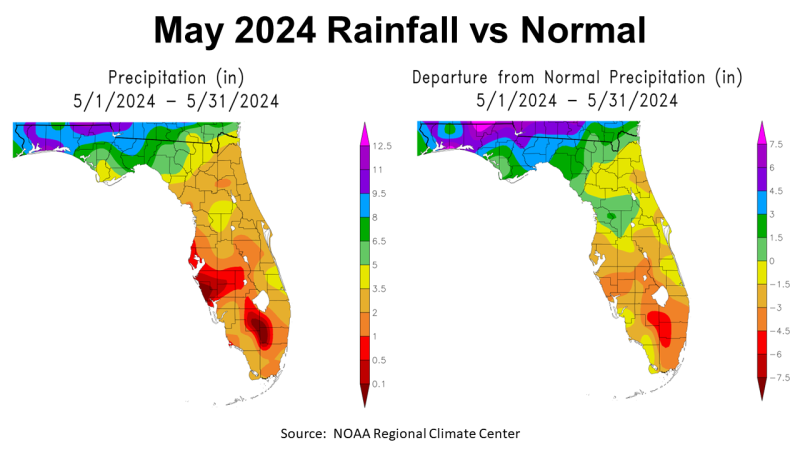
May in the Panhandle is typically a transition month from spring to summer with increasing temperatures and limited frontal rainfall. May 2024 was not typical in the Panhandle, with higher than average rainfall and temperatures across the region. The map on the left above shows the disparity in rainfall across Florida in May. Most of the Panhandle 5-8″, while Peninsular Florida had much lower totals ranging from 0.5″ to 5″. In the Panhandle, there were pockets that received over 9.5″ (purple) or less than 5″ (yellow) of rain in May. Much larger sections received 8-9.5″ (blue), 6.5-8″ (green), or 5-6.5″ (light green). The map to the right above shows how the May 2024 rainfall compared to historic average. The entire Panhandle was above average in May, with 0-1.5″ (light green), 1.5 to 3″ (green), 3-4.5″ (green), 3-4.5″ (blue), or over 6″ (Purple, mauve, or pink) above historic average.
–
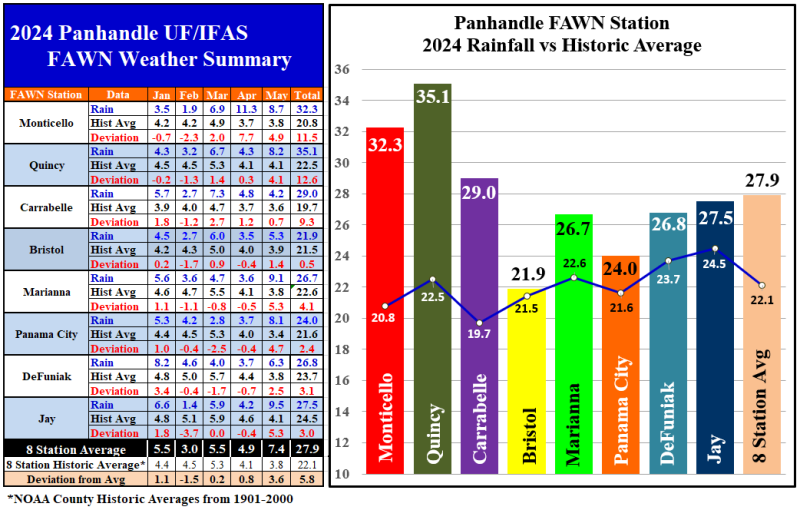
The eight Florida Automated Weather Network (FAWN) stations show more precisely the variation in precipitation across the Panhandle in May 2024. The wettest location was Jay with 9.5″ recorded, which was 5.3″ more than normal. The driest location was Bristol, with 5.3″, but even there was 1.4″ above average for the month. The average of all eight FAWN stations was 7.4″, which was 3.6″ higher than historic average.
Through the first five months of 2024, all eight FAWN Stations averaged 27.9″, which was 3″ above historic average. The wettest location was Quincy with 35.1″, which was 4.1″ above the 22.5″ average. By contrast, the station at Bristol recorded a total of 21.9″, and was only 0.5″ above normal.
–
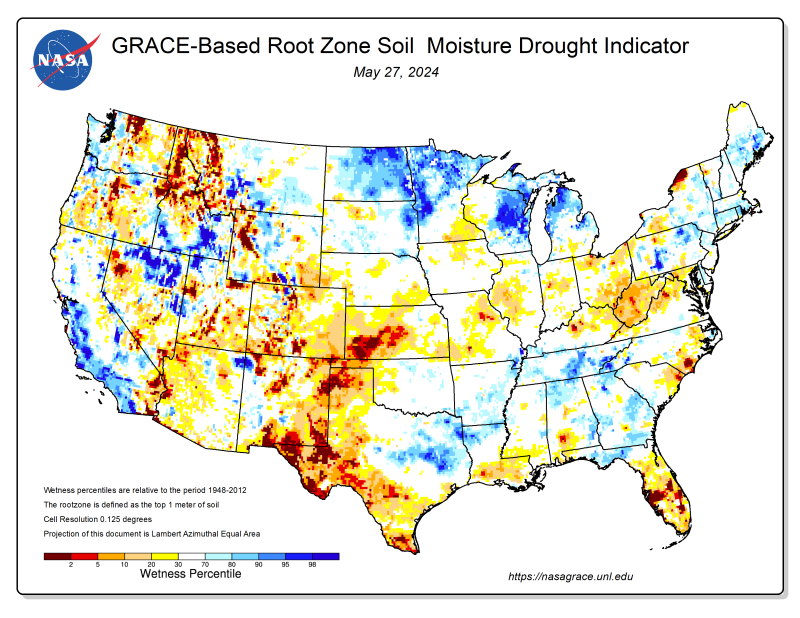 The NASA Soil Moisture map from May 27 shows the discrepancy of rainfall across Florida at the end of the month. The driest locations were in Central and South Florida, but much of the Panhandle had adequate (white) or wetter than normal moisture (blue).
–
 Temperatures
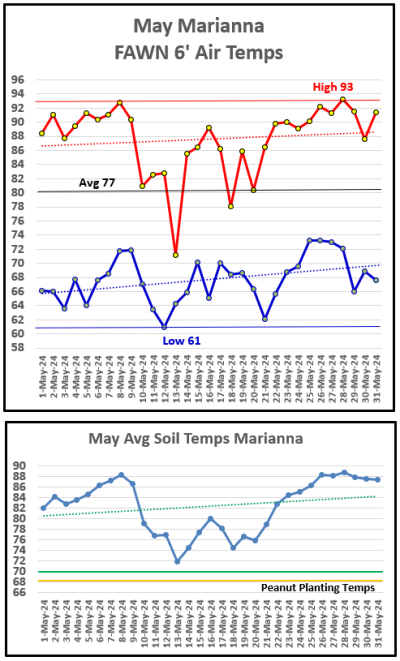
Air temperatures climbed as we moved through May, with a high of 93° on May 8th and 28th, in Marianna. The low of 61° occurred on the morning of May 12th. The trend lines in the graph show that morning lows warmed faster than afternoon highs in May. The average 6′ air temperature was 77° for the month.
The bottom graph to the right shows average daily soil temperatures in May. The solid lines depict the marginal (yellow) and optimal (green) soil temperatures for fast peanut seed germination. In this chart you can see that the entire month of May was warm enough for peanut planting.
–
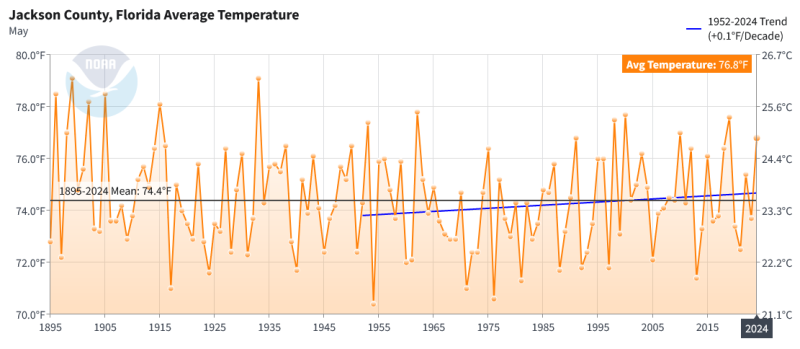
NOAA provides county average temperatures through their Climate at a Glance website. The graph above shows data from 1895 through 2024 for May in Jackson County. The 76.8°F average in May 2024, was 2.4° higher than the historic average of 74.4°F. While there was quite a bit of fluctuation through the years, the blue line in the graph shows how the climate has changed over the same time period weather data has been collected at the NFREC Marianna Weather Station. Since 1952, the May average air temperature has risen 0.1° per decade.
–
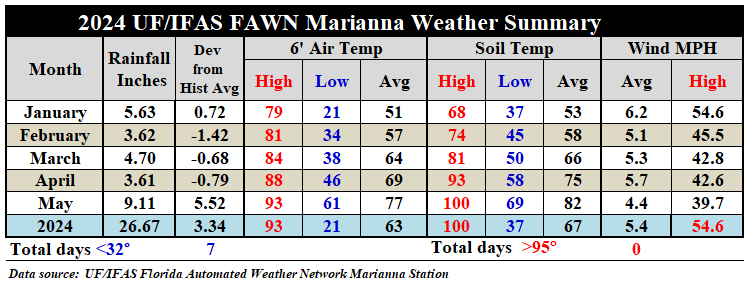
In the chart above you see the summary of weather data from January through May 2024 at the Marianna FAWN Station. The average air temperature rose 8°, from 69° in April to 77° in May. The average soil temperature rose 7°, from 69° in April to 77° in May. Winds were 1 mph calmer in May than April.
–
Summer Outlook
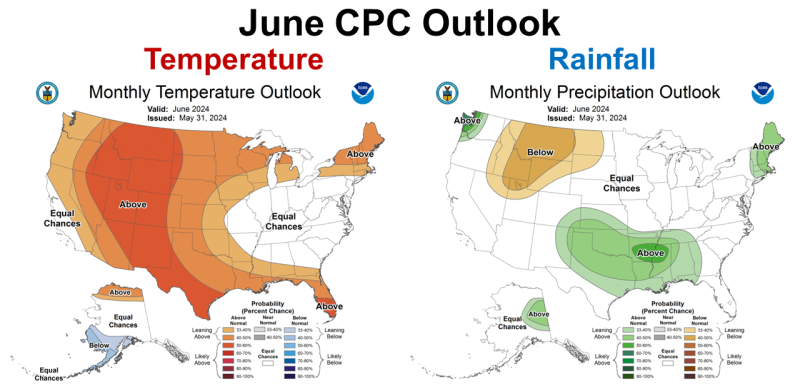
The Climate Prediction Center (CPC) is expecting above average temperatures across Florida in June. They did separate the Panhandle out of the rest of the state in their prediction of above average rainfall in June 2024. Above average temperatures in June could mean above 95°, which is detrimental for plant reproduction.
–
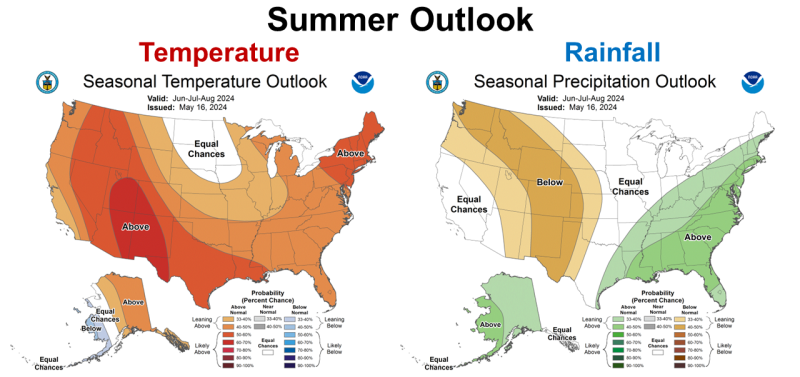
The Summer CPC Outlook shows an expectation of a warmer and wetter than average summer for much of the Southeast. This forecast seems positive for crop and forage production, as long as the rainfall is not excessive.
–
 La Niña Watch
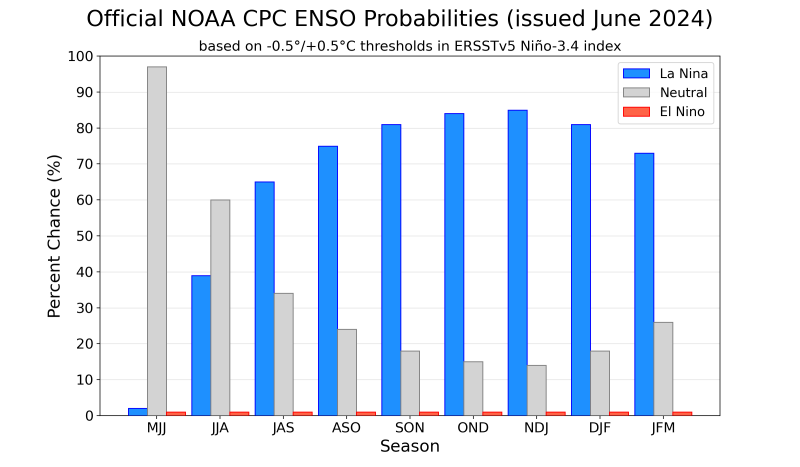
El Niño is officially over, so we are now in the Neutral ENSO phase with expectations of the transition to La Niña in the coming months. The chart above was recently issued by the CPC. The CPC has a high confidence (>75%) of La Niña from the August-October time period through the December-February 2025 time period.
ENSO-neutral conditions returned during the past month. Near-to-below average sea surface temperatures (SSTs) expanded across the eastern equatorial Pacific Ocean. … Below-average subsurface temperatures were mostly unchanged during the past month, with negative anomalies persisting in the eastern half of the Pacific. Low-level wind anomalies were easterly over the east-central equatorial Pacific, and upper-level winds were near average. Convection was mostly average around Indonesia, while below-average rainfall strengthened near the Date Line. Collectively, the coupled ocean-atmosphere system reflected ENSO-neutral conditions.
The most recent IRI plume indicates La Niña may develop during July-September 2024 and then persist through the Northern Hemisphere winter. The forecast team is also favoring the development of La Niña during July-September because the rate of cooling has slowed since last month. The team still favors La Niña to emerge sometime during the summer months, given the persistent below-average subsurface ocean temperatures and changes in the tropical atmospheric circulation. In summary, ENSO-neutral conditions are present. La Niña is favored to develop during July-September (65% chance) and persist into the Northern Hemisphere winter 2024-25 (85% chance during November-January. CPC June 13, 2024
–
What does this mean for farmers and ranchers in the Panhandle?
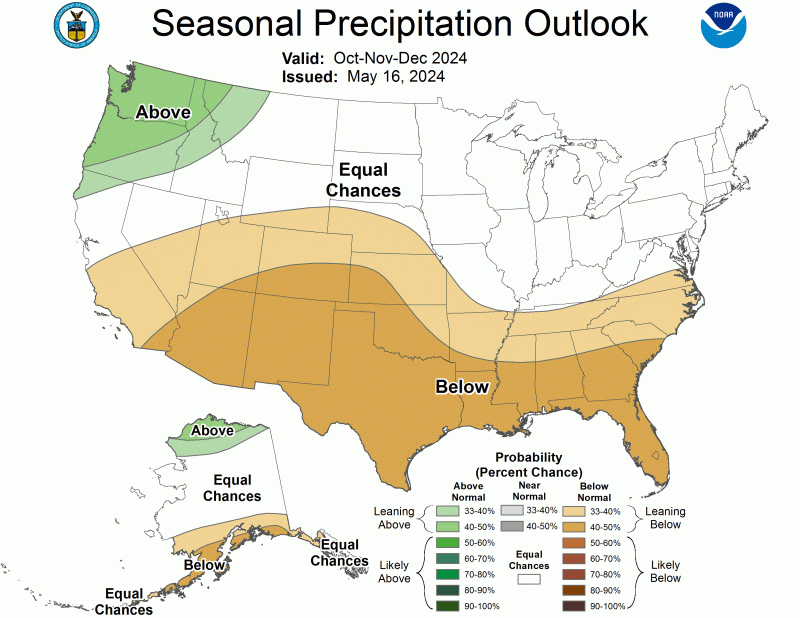 The climate outlook has certainly improved from April to May, and appears to be solid for good growing conditions for crops and forages through the summer. The CPC is expecting above average rainfall this summer, but their current long-range forecast for October though December forecast (right) calls for below average rainfall this fall. Long-range forecasts are certainly subject to change, but you see the expectation of climate influence of the expected La Niña. This could provide excellent hay and crop harvest this fall, but it will all depend on if and when we start to get extended drought. While the current forecast does appear favorable for crop and forage production, we all know how quickly this can change with tropical storms in the region. A good growing season can become a muddy mess with extra moisture from a tropical system moving through. We will have to keep an eye on the long-range forecasts before making decisions on cool-season crops, but for right now the climate has become more favorable for the summer crops. Of course there are always pockets that don’t see above average rainfall, so we will have to keep watching to see how this summer progresses. As of today, there is good reason for optimism in the Panhandle for the summer growing season ahead.

demayo@ufl.edu - 850-482-9620
Follow me on Twitter
@UFCowman
- Northwest Florida Beef Cattle Conference & Trade Show – February 11 - December 19, 2025
- Friday Feature:The Sears Catalog –How Rural America Shopped before the Internet - December 19, 2025
- November 2025 Weather Summary & Winter Outlook - December 5, 2025