
Mark Mauldin, Ag & Natural Resources Agent Washington County, Dr. Barry Tillman, Peanut Breeder UF/IFAS NFREC, Ethan Carter, Regional Row Crop IPM Agent, De Broughton, Regional Crops Agent, and Camila Ichazo
–

Over the past two weeks the trend of wet weather has persisted in parts of Florida’s peanut producing region and has eased a bit in others. Overall, as this crop year begins to wind down it is safe to say that drought stress has not been a major issue this year. https://water.weather.gov/precip/
The peanut crop continues to advance. In the aGDD Tracker below you can see that all of the March and most of the April planted peanuts have reached or pasted optimum maturity at this point. As always, there is a considerable variation in maturity based on field location and the associated weather conditions at that location throughout the growing season. Take, for example, the April 21st planting date shown on the Tracker, these fields are right at 140 Days After Planting (DAP). Based on calendar days, these fields should all be very close to optimum maturity (2500aGDDs). However, as you can see they range from 2381 to 2686 accumulated aGDDs. Some locations are tracking more than a week ahead of the calendar, while others are tracking behind. Check the Tracker, if you’ve got a field that has reached or is close to 2300 aGDDs, it’s time to pull some samples. Don’t risk sacrificing yield or grade, take the necessary steps to optimize your harvest timing.
–
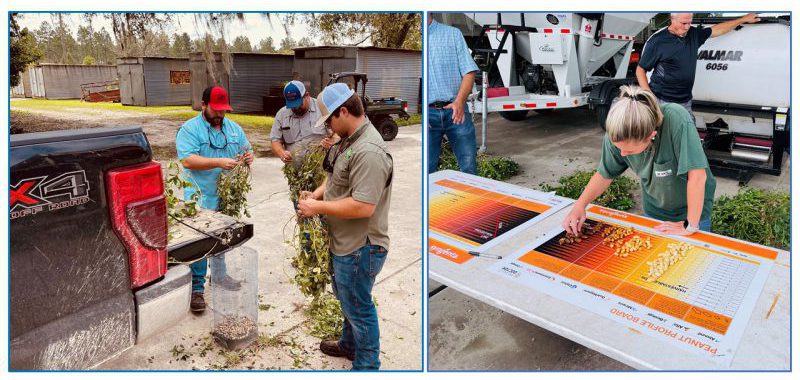
Peanut maturity evaluation at the NFREC Live Oak. Photo Credit: De Broughton, UF/IFAS Extension
–
If you have fields that are approaching 2300 aGDDs, contact your County Extension Office and make arrangements to have samples pod-blasted and analyzed. Over the past two weeks, across all locations, fields accumulated approximately 136 aGDDs each week (down from 145 during the previous two week period), so plan accordingly. Remember, that the information generated will only be as good as the sample provided. Collect a good representative sample; dig (don’t pull) plants from several locations throughout the field, avoiding field edges and the ends of rows. Below is a link to a document that describes the entire maturity evaluation process in detail. There is also video linked below the Tracker that discusses peanut maturity evaluation.
Methods to Evaluate Peanut Maturity for Optimal Seed Quality and Yield
aGDD Tracker for the Florida Peanut Producing Region – 9/10/21 edition
The aGDD Tracker is compiled from data generated by PeanutFARM.org. The dark blue bars in the cells with the aGDD values indicates progress towards 2500 aGDDs. The extends to the right as aGDDs are accumulated. The entire cell will be dark blue and the text will be orange when a field has accumulated 2500 aGDDs. It is recommended that fields be sampled and exact days-to-harvest be determined via pod-blasting once a field reaches 2300 aGDDs; text will appear yellow for fields that are between 2300 and 2500 aGDDs.
–
–
- 2026 Watermelon Growing Contest Open to All – “How To” Class February 17 - February 13, 2026
- Row Crop Short Course – March 5 in Chipley - February 13, 2026
- Come See the Washington County Cool-Season Forage Demo – February 12 - January 30, 2026