
 How did El Niño effect the Cool-Season of 2023-24?
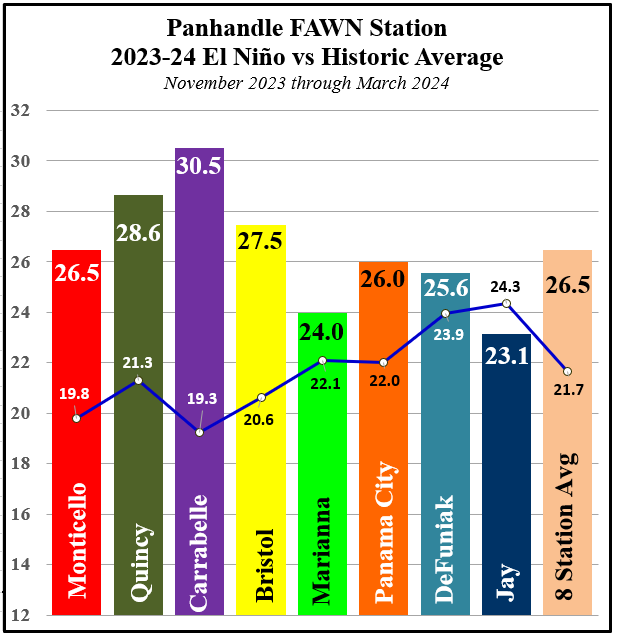
At the end of 2023, there was much discussion of a strong El Niño and the affect it might have on the climate this cool-season (November-March) in Florida. We certainly had more rain than last winter, but it was pretty variable throughout the Panhandle compared to average. The graphic to the right shows the total rainfall at each of the Florida Automated Weather Network (FAWN) stations from November 2023 through March 2024. This was the time frame that the climate was predicted to be influenced by El Niño. The bars show the actual rainfall captured at each location, and the blue line showed how this year compared to historic average at each of these locations.
Overall, we did have almost 5″ more rainfall than average over this five-month period. The wettest location was Carrabelle with 30.5″ as compared to the 19.3″ average, which was 11.2″ above normal during this specific time period. Compare that though with the Jay station that collected only 23.1″, -3.2″ below normal. The average for all 8 Florida Automated Weather Network (FAWN) stations was 26.5″, which was 4.8″ above the 21.7″ historic average for November through March. Most of the extra rainfall, however, fell in December, with a little extra in January, so it was not evenly distributed through the cool-season of 2023-24.
–
1st Quarter Rainfall
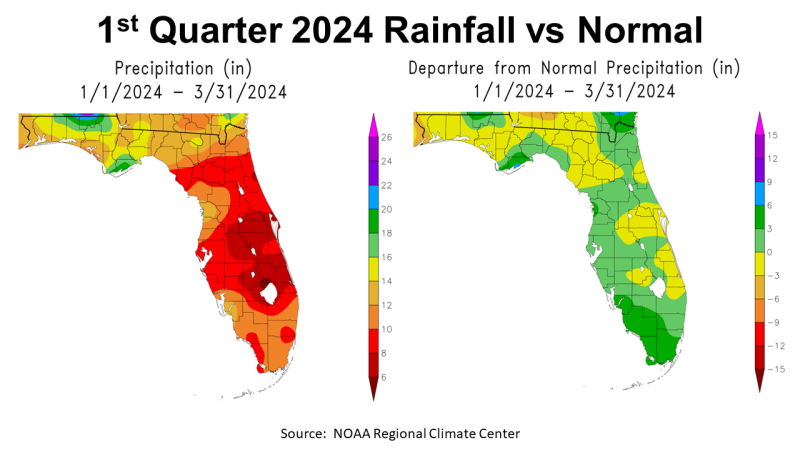
2024 is off and running with crops either in the ground or soon to be planted in the coming weeks. The first quarter of 2024 did not see a significant boost in rainfall as expected from El Niño for most of Florida. The map to the left above shows the estimated rainfall across Florida from January through March 2024. There was a small pocket of Walton and Holmes Counties that was estimated to be over 20″ (blue), with a larger area of 16 to 18″ above normal (green). Most of the Panhandle received 14-16″ (yellow) or 12-14″ (tan). The map to the right compares 2024 rainfall to historic average. It is pretty straight forward to evaluate, with areas in light green (0-3″) or dark green 3-6″ above average, and below average in yellow (0-3″) or tan (-3 to -6″). So, there were pockets that received above average rainfall, especially in the southern tip of Florida, as well as Franklin and Holmes Counties in the Panhandle. The majority of Florida was either slightly above normal (0 to 3″ – light green) or 0 to -3″ below normal (yellow) over the first three months of 2024.
–
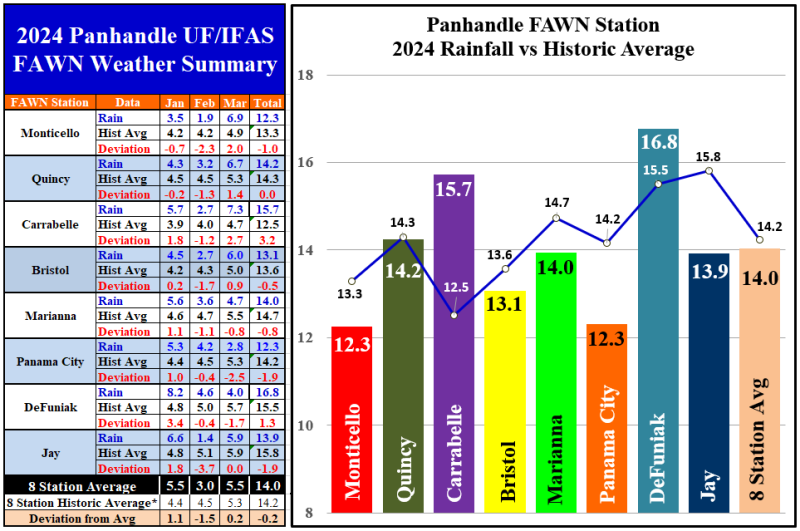
The FAWN Station data shows more precise variation across the Panhandle from January through March 2024. Through the 1st quarter, only the stations in Carrabelle and DeFuniak were above average. The De Funiak Springs station received 16.8″, that was 1.3″ above average, and the station in Carrabelle received 15.7″, 3.2″ above average. Contrast that with only 12.3″ received at the station in Monticello, which was 1″ below normal. The Panama City station also recorded 12.3″, and was -0.9″ below normal. Overall, the eight station average from January through March 2024 was 14″, which was just -0.2″ below average. As you can clearly see, the El Niño influence on rainfall in the Florida Panhandle was not that significant during the 1st quarter of 2024.
–
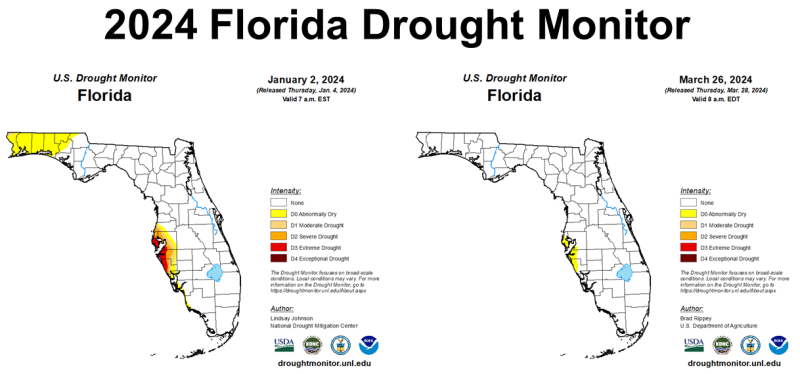 Fortunately, the rainfall in the 1st quarter of 2024 did improve soil moisture across Florida. The map above to the left was the Florida Drought Monitor on January 2nd. There were parts of seven counties in the Abnormally Dry (yellow) category of the Drought Monitor at the start of 2024, but by the end of March, all of North Florida was back to a normal range.
–
Temperatures
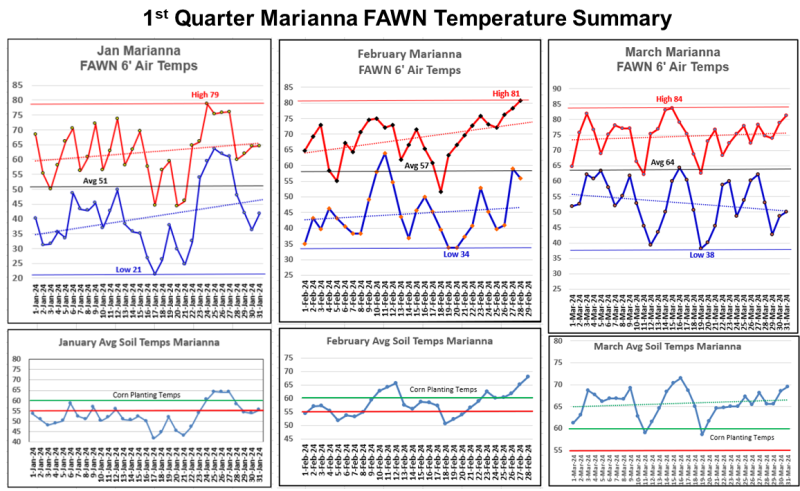
Air temperatures were relatively normal in the 1st quarter of 2024. The high in January was 79° on the 24th, with a low of 21° was on January 17th, and a monthly average of 51°. February temperatures ranged from a high of 81° on the 28th, to a low of 34° on the 19th and 20th, with a monthly average air temperature of 57°. March was only slightly warmer with a high of 84° on the 15th, and a low of 38° on the 19th, with a monthly average of 64°. The average air temperature for all three months at the Marianna FAWN station was 57°.
The bottom charts (above) from each month compares the daily average soil temperature to the optimal (green) and minimum (red) recommended corn planting temperatures of 60° and 55°. You can see that since February 21st, the average soil temperature at Marianna has been above 55°. There were some some cold snaps that dropped temperatures brieflyin March, but basically there should have had good corn seed germination throughout the month of March.
–
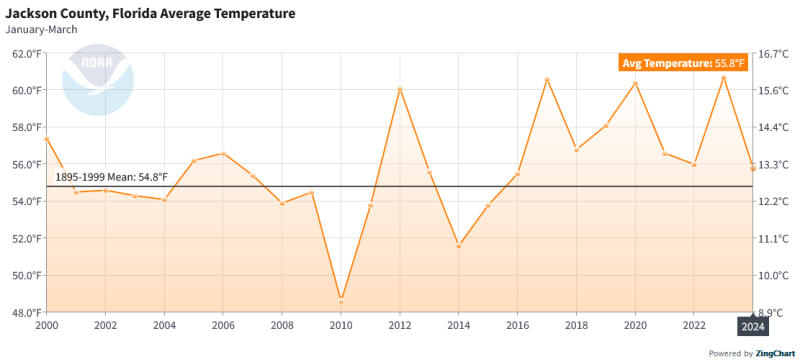
NOAA reports average monthly air temperatures for each county and provides a comparison to the average. From 1895 to 1999 the mean was 54.8° for the 1st quarter, but according to NOAA, the average through the 1st quarter of 2024 was 55.8° in Jackson County. The average in the 1st Quarter of 2023 was 60.7°, so it was almost 5° cooler than last year. As you cans see in the graph above, the air temperature has been warmer than historic average since 2016.
–
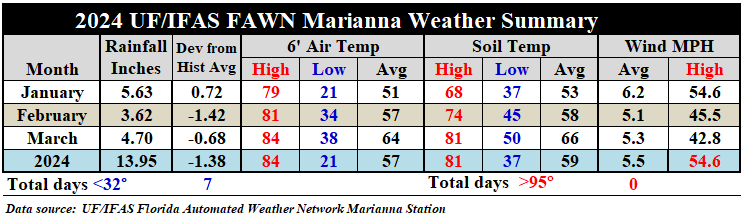
In the summary chart above, you can see the progression of average air and soil temperatures during the 1st quarter of 2024. The air temperature warmed 6° from 51° in January to 57° in February. The average soil temperature warmed 6° from 53° in January to 58° in February. From February to March, the air warmed 7° from 57° to 64°. The average soil temperature rose 8° from 58° in February to 66° in March. During the first quarter of 2024, there were only seven days below freezing at 32°. Also interesting in this chart, was the 54.6 mph high wind speed on January 9th, the same day that the terrible tornado hit east of Marianna. That fast-moving cold front packed powerful straight-line winds as it move through the Panhandle.
–
 Planting Season Outlook
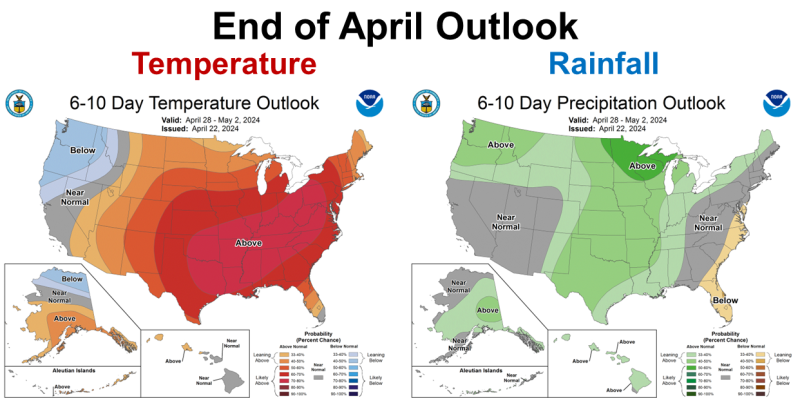
There is not much left of the month of April, but I did want to share the outlook for the week ahead – hot with normal rainfall in the Panhandle. That means the nice weather earlier this week may very well be our last taste of spring. We may have truly enjoyed it, but peanut, cotton, and bahiagrass seeds need warm soils for optimal germination, so its not all bad. Based on the above Climate Predication Center (CPC) graphic forecast above, we can expect a warm week ahead with limited rainfall. High pressure has set over the region and is blocking cold fronts, but this is fairly typical for this time of year.
–
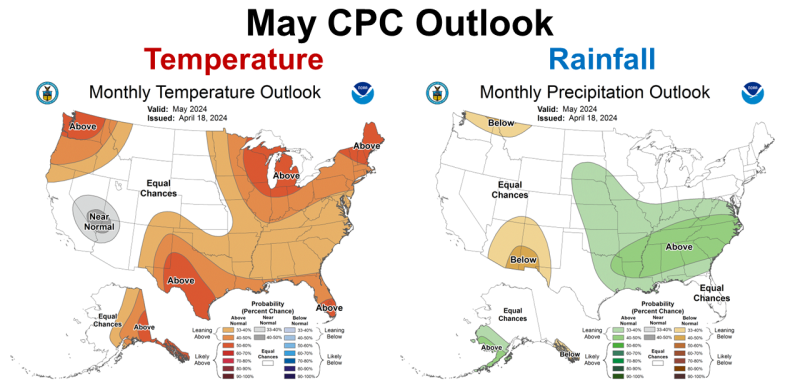 The CPC is expecting a warmer than average May 2024, with only part of the Panhandle in the zone with above average precipitation. May is one of the drier months of the year, so normal is warm and dry. Based on their outlook map it may be hot and dry through much of the month of May.
–
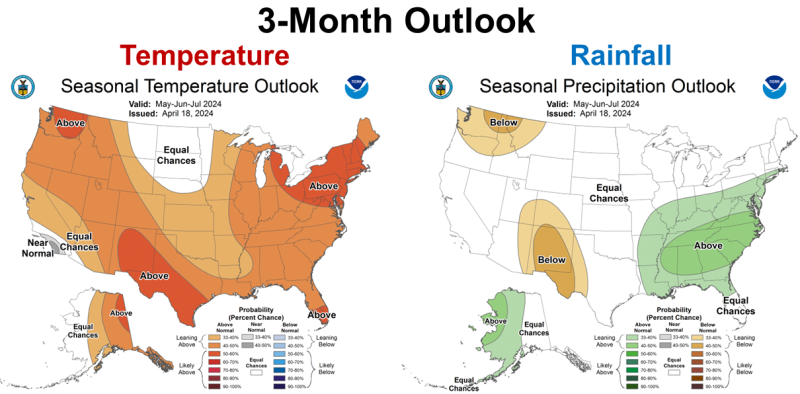
The May through July 3-Month Outlook is more certain for the above average rainfall all across Northern Florida. The higher than normal temperatures are also predicted throughout the Southeast. So, it does appear that the early season rainfall will improve once we move into the summer months.
–
La Niña Watch
El Niño is waning and neutral is expected in the next month or two. Now the concern is a La Niña this fall. The following are a few excerpts form the most recent CPC’s ENSO Diagnostic Discussion.
During March 2024, sea surface temperature (SST) anomalies continued to weaken across most of the equatorial Pacific Ocean…
Below-average subsurface temperatures strengthened (area-averaged index)…
Collectively, the coupled ocean-atmosphere system reflected the continued weakening of El Niño. The most recent IRI plume indicates a transition to ENSO-neutral during spring 2024, with La Niña potentially developing during late summer 2024…
La Niña tends to follow strong El Niño events, which also provides added confidence in the model guidance favoring La Niña. In summary, a transition from El Niño to ENSO-neutral is likely by April-June 2024 (85% chance), with the odds of La Niña developing by June-August 2024 (60% chance). Climate Prediction Center
–
What does this mean for farmers and ranchers in the Florida Panhandle?
The long-term outlook is good for normal summer rainfall, but I am not sure what the next six weeks will bring? This is a critical period for planting peanuts and cotton. The current high pressure system could block rainfall for a short period or for several weeks. The CPC’s graphic climate outlooks call for normal rainfall in the Panhandle over the next three months. Let’s hope that is what turns out to be true. Every year at this point I always get nervous about extended drought, because the end of April and the month of May can be hot and dry. The experts are still predicting normal rainfall this summer, but we need good soil moisture for planting and seed germination.
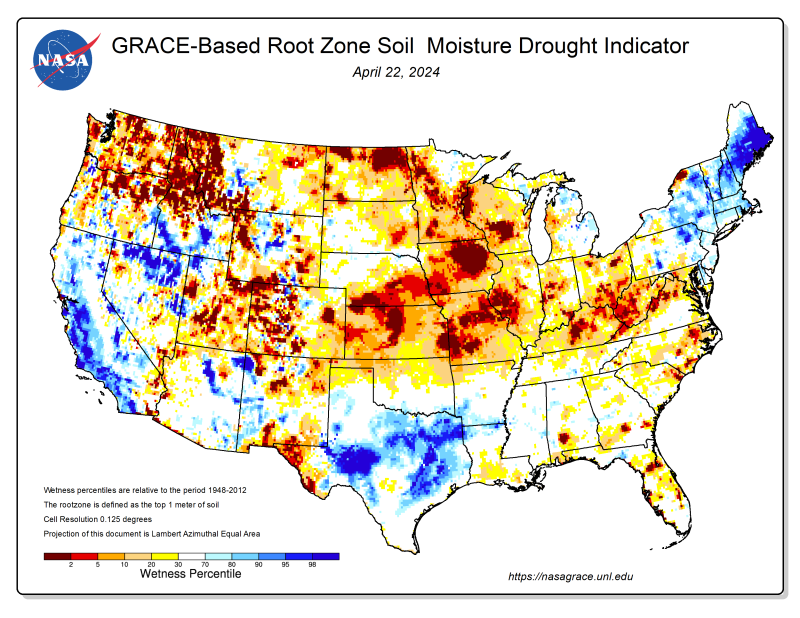 We have decent soil moisture now in most areas of the Panhandle, but April rainfall has not been uniform. The April 22 NASA soil moisture map (above), however, shows that there are dry pockets forming in the Southeast, as we close out the month of April. I hope this is just just a short-term phenomenon, but this is also the time of year when frontal rainfall can be limited. My thoughts are that if you have good soil moisture, I would plant as soon as possible. The reality though is that it takes considerable time to plant 300,000 acres of crop land across the Panhandle. La Niña typically means warm and dry conditions in the Panhandle, so it may get drier than normal again as we move towards fall harvest.
demayo@ufl.edu - 850-482-9620
Follow me on Twitter
@UFCowman
- Friday Feature:Capitalizing on Good Cow-Calf Management - May 3, 2024
- 1st Quarter 2024 Weather Summary & Planting Season Outlook - April 26, 2024
- Friday Feature:Peanut Season Kicks Off at McArthur Farms - April 26, 2024