
Rainfall
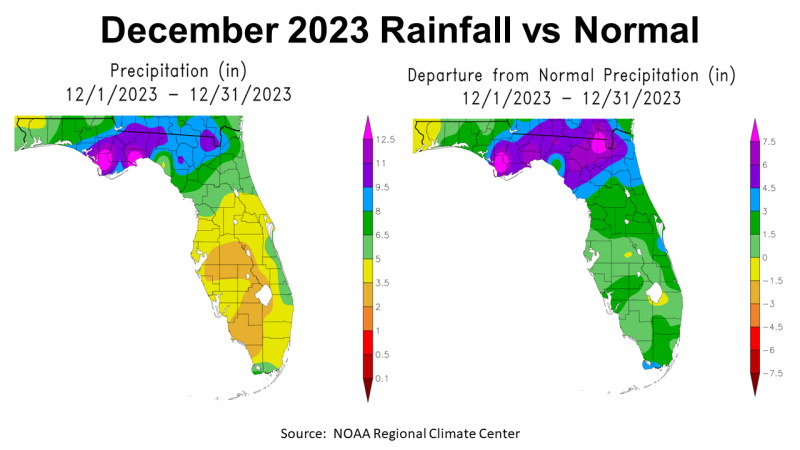
That calendar has turned from 2023 to 2024, so it is time to summarize the weather year. Early in 2023, there was optimism for a good growing season, but for much of the Panhandle it was not a good year because of the excessive heat and lower than average rainfall during the growing season. December was an anomaly in 2023, however, with above average rainfall. The map to the left shows estimates of actual rainfall for the month. Only the Northwest corner of the Panhandle had less than 5″ (Yellow), the areas in light green had 5.0-6.5″, in dark green 6.5-8″, blue 8-9.5″, purple 9.5-11″, lilac 11-12.5, and fuchsia over 12.5″. The map to the right shows how December 2023 rainfall compared with average. Only Escambia and Santa Rosa were below average (yellow), according to NOAA’s Regional Climate Center. These maps show once again that discrepancy this year between Central and Easter Time Zone Counties this year.
–
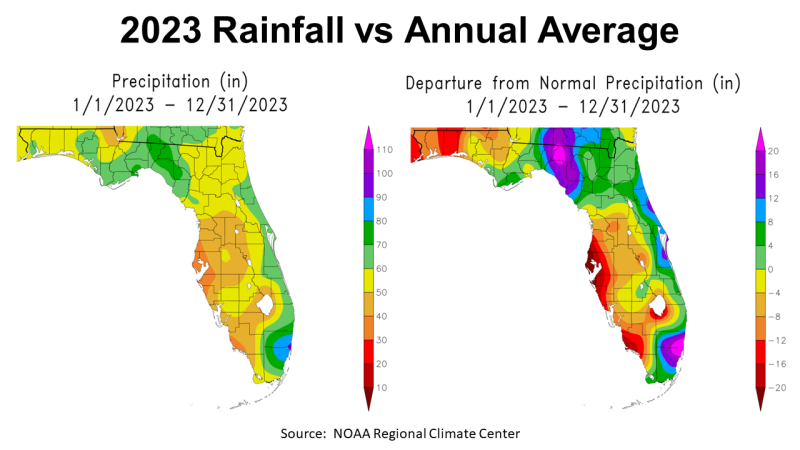
The discrepancy between eastern and western Panhandle counties was a recurring theme throughout 2023. In the map to the left the areas in dark green received 70-80″, light green 60-70″, yellow 50-60″, and tan, 40-50″. The map to the right compares 2023 rainfall with historic average. The area in purple, lilac and fuchsia were 12″ or more above average, while the areas in dark green were 4-8″ above average, light green 0-4″ just above average, yellow 0 to -4″ below average, tan -4 to -8″ below average, orange -8 to -12 below average, and red -12 to -16″ below average.
–
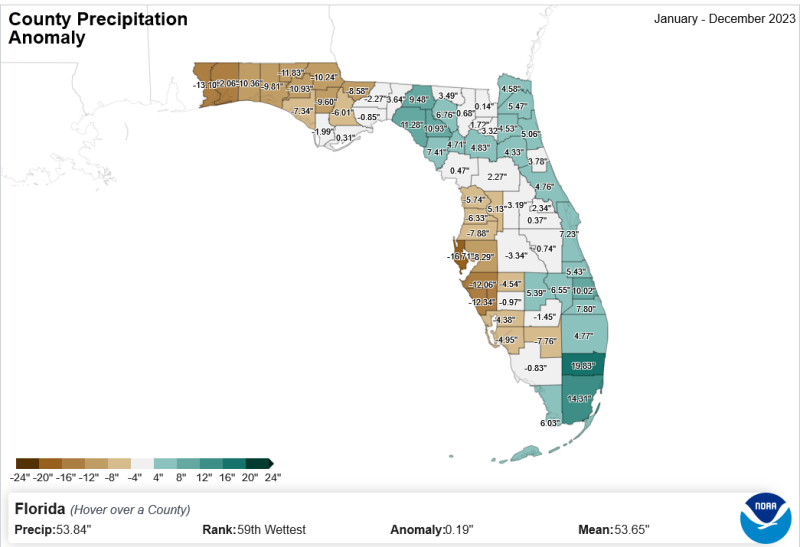
NOAA also tracks climate by county, so the map above provides a county by county rainfall comparison with historic average for 2023. This is helpful because it provides a specific variation for each county.
–
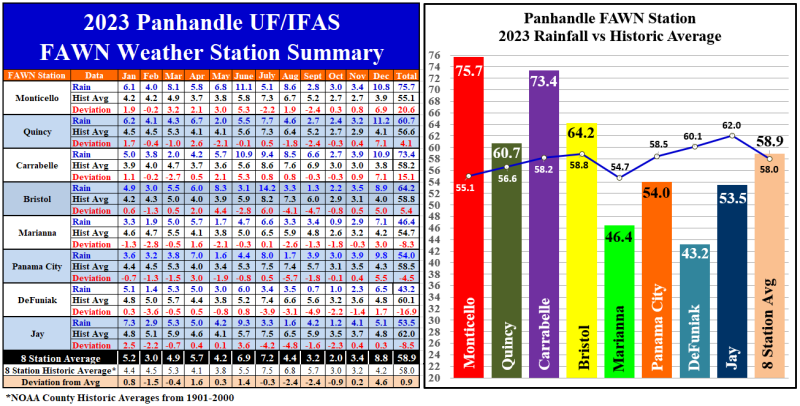
The data from the eight Florida Automated Weather Network (FAWN) stations provides more specific rainfall data across the Panhandle. In this chart you can see the discrepancy between the four stations in the Eastern Time Zone stations from the four in Central Time Zone. December 2023 was a big improvement with every station above historic average. Even so there was a wide disparity between the 11.2″ in Quincy, which was 7.1 above average, and the 5.1″ in Jay, only 0.3″ above average. The average of all eight stations in December was 8.8″, 4.6″ higher than normal.
Through all of 2023, the eight FAWN stations averaged 58.9″, 0.9″ above normal. The wettest location was Monticello with a whopping 75.5″, 20.6″ higher than normal. That is quite a bit different than the + 3.64″ reported for the county average by NOAA in the previous map. DeFuniak was the driest location in 2023 with only 43.2″ recorded, -16.9″ below normal for Walton County. That was a 32.5″ difference in rainfall in a single year between the high and low rainfall stations.
–
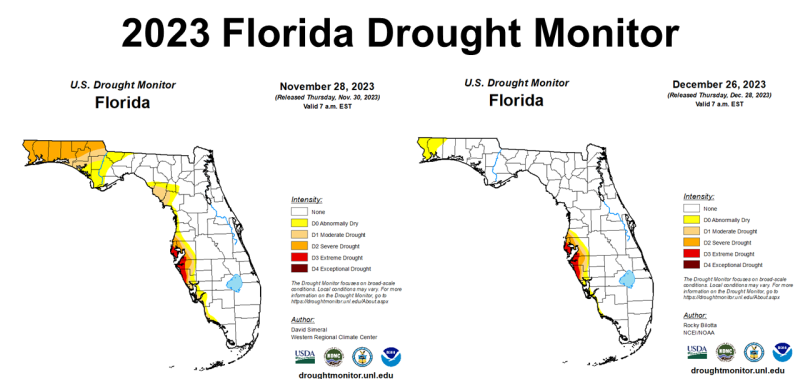
December rainfall brought positive change in the drought situation across the Panhandle. By the end of the month, only Escambia and Santa Rosa Counties were in the Abnormally Dry Category.
–
Temperatures
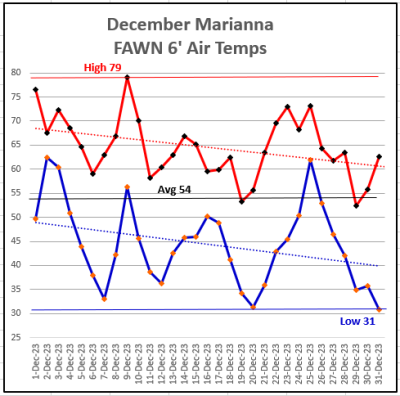 Temperatures in December were mild and moderate with a high of 79° on December 9th, and a low of 31° on December 20th and 31st. The average temperature for December was 54°.
–
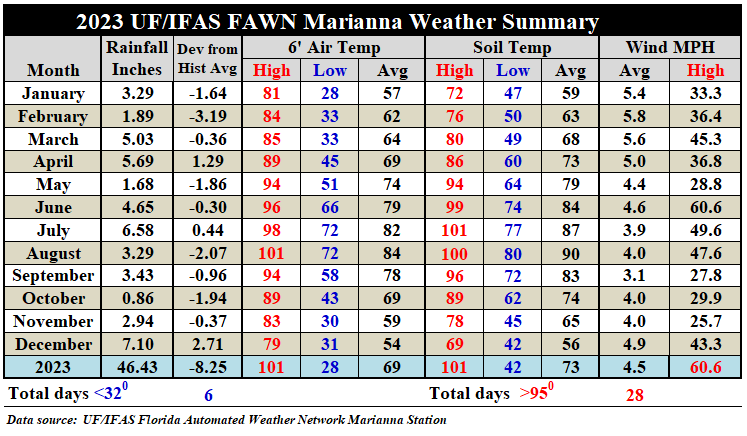
When compared to November, the average air temperature dropped 5° from 59° to 54° in December. The average soil temperature dropped 9° from 65° in November to 56° in December. Wind speeds increased slightly in December from a 4 to 4.9 MPH average, but the top gust recorded was 43.3 MPH in December, as compared to 25.7 MPH in November.
For the year, the Marianna FAWN station average 5′ air temperature was 69°. There were only 6 days in 2023 with low temperatures below 32°, but there were 28 days with high temperatures above 95°. The high for the year was 101° in August and the low was 28° in January.
–
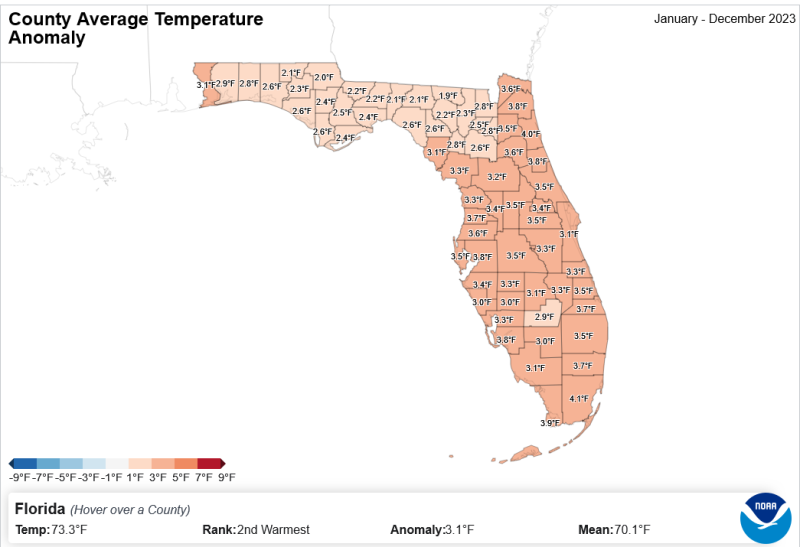
The map above provides the variation in average air temperature in 2023 to county historical annual averages. According to NOAA, the 73.3° Florida average temperature in 2023 was the 2nd warmest on record for the entire state. Dade County was 4.1° higher than average, while Hamilton County was 1.9° above average. In the Panhandle, Escambia was the warmest at 3.1° above normal.
–
–
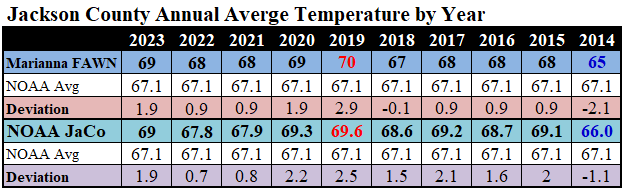
The 69° average air temperature at the FAWN station in Marianna matches the county average reported by NOAA, and was 1.9° warmer than historic average, but not as warm as the 70° in 2019, but warmer than the low of 65° in 2014. Looking at the past decade the general trend showed a warming of 3°.
–
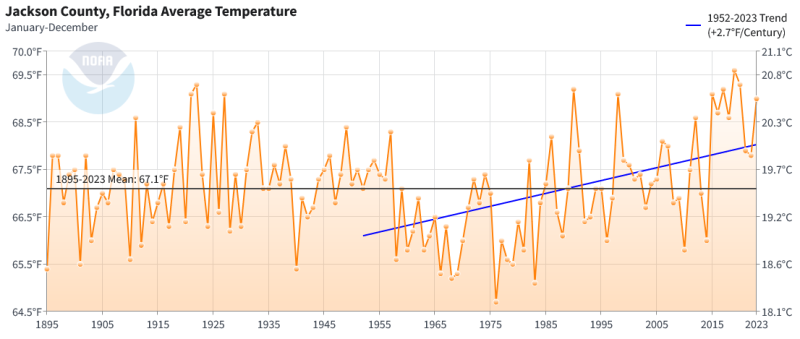
The chart above from NOAA’s Climate at a Glance County Time Series shows the average air temperatures for Jackson County from 1895 to 2023. The North Florida Research Center at Marianna has weather records from 1952 to 2023, so I added the trend line from that time forward. You can clearly see the sharp rise in average temperatures over that time span from a cool decade in the 50s to a much warmer decade in from 2013-2023.
–
1st Quarter 2024 Outlook
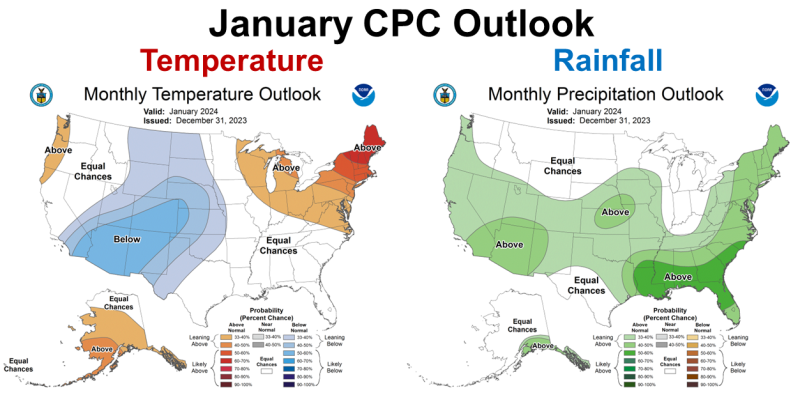
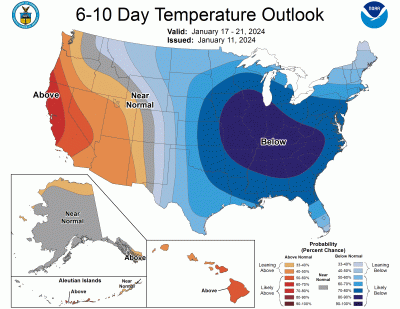 The Climate Prediction Center (CPC) outlook for January 2024 (above) shows the expectation of an above average rainfall month. El Niño is at full strength and pushing front after front through Florida. For the month of January, the CPC made no predictions for temperature. However their more recent January 11 short-term forecast for the next 10 days (right) shows much colder weather coming. So while the entire month of January may be closer to average, the weather next week is expected to be well below average in the Eastern U.S.
–
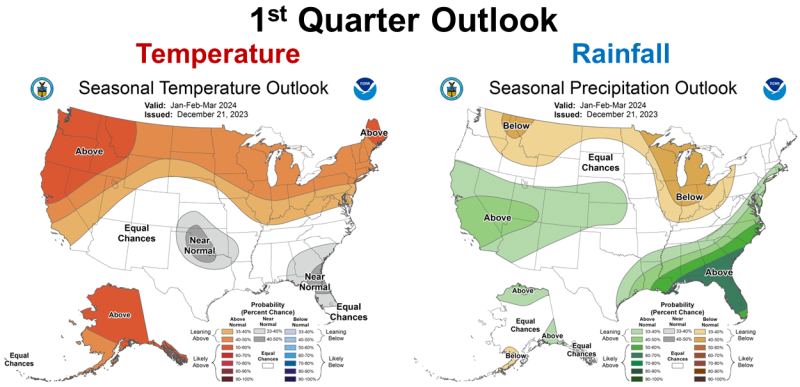
The 3-month CPC Outlook for January through March 2024 shows the expectation of near average temperatures with a high expectation of above average precipitation across the Southeast. El Niño is expected to affect the climate in this region through at least March.
–
Source: Climate.gov
El Niño Advisory
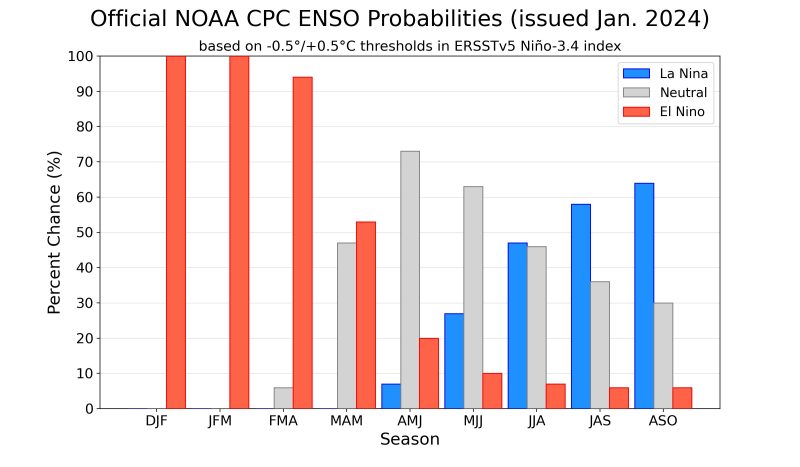
The Climate Prediction Center updated their El Niño Advisory this week that included the probability table above for each ENSO phase. The current El Niño is strong but there are signs that it may be starting to weaken. The influence on our local climate from El Niño is likely to continue for the next several months, with a transition back to ENSO Neutral likely in the late spring or early summer, with a strong possibility of La Niña in the fall of 2024. It has been fairly common in the past for a La Niña winter to follow an El Niño winter.
Above-average sea surface temperatures (SST) persisted across the equatorial Pacific Ocean, with the largest anomalies observed in the central and east-central Pacific. …Collectively, the coupled ocean-atmosphere system reflected a strong and mature El Niño. The most recent IRI plume indicates El Niño will gradually weaken and then transition to ENSO-neutral during spring 2024. Some state-of the-art dynamical climate models suggest a transition to ENSO-neutral as soon as March-May 2024. The forecast team, however, delays this timing and strongly favors a transition to ENSO-neutral in April-June 2024. There are also increasing odds of La Niña in the seasons following a shift to ENSO-neutral. It is typical for El Niño to peak in December/early January, but despite weakening, its impacts on the United States could last through April . In summary, El Niño is expected to continue for the next several months, with ENSO-neutral favored during April-June 2024 (73% chance). Climate Prediction Center – January 11, 2024
—
El Nino is firmly entrenched in place and is likely to be near peak strength right now. It is expected to weaken gradually over the next few months and then swing towards the opposite La Nina phase by late summer. If we are in a La Nina then, that will make another active tropical season in the Atlantic more likely. Pam Knox, UGA Agricultural Climatologist
–
What does this mean for Panhandle farmers and ranchers?
2023 was a tough year for many farmers and ranchers in the Panhandle with a hot and dry summer and fall, but it was not the same across all of Northwest Florida. The Eastern Time Zone Counties had more consistent rainfall. 2024 has started off wet with almost weekly fronts moving through. The El Niño ENSO influence is strong at the start of 2024 and is expected to gradually weaken over the next four months, but ENSO neutral will likely not come until planting time for cotton and peanuts in April and May. Planting moisture should not be an issue in 2024, but wet fields could be an issue for farm equipment. Cold weather is expected soon, but the long-term outlook should be near average temperatures. El Niño winter storms are strong as farmers were reminded with recent tornadoes tearing up homes, businesses, and farms in several counties. If you had damage on your farm, be sure to report it to your local FSA Office to help them build a case for their emergency programs. A La Niña is possible to close out the growing season, but it is way to early to predict this accurately. La Niña could mean more tropical storms and a drier than average fall to end the year. That could add up to strong crop yields, so 2024 might be a much better year than 2023. Let’s all hope so. We will keep watching to see what 2024 brings.
–
Download the complete daily weather history from the FAWN Station in Jackson County, and the monthly rainfall records from the eight FAWN Stations in the Panhandle.
2023 Jackson Co Weather Summary
–
You can access previous weather summaries from 2010 – 2022 under the Annual Weather Data Summaries section at the bottom the the following web page:
Jackson County Weather Data
demayo@ufl.edu - 850-482-9620
Follow me on Twitter
@UFCowman
- Friday Feature:Capitalizing on Good Cow-Calf Management - May 3, 2024
- 1st Quarter 2024 Weather Summary & Planting Season Outlook - April 26, 2024
- Friday Feature:Peanut Season Kicks Off at McArthur Farms - April 26, 2024