by Dana Stephens | Nov 17, 2025
What are PFAS?
PFAS are per- and polyfluoroalkyl substances. PFAS is a class of chemicals found in various industrial and consumer goods. For instance, you may find them in food packaging, textiles, cosmetics, and frequently in aqueous film-forming foams (AFFFs) used to extinguish fires. PFAS chemicals are known for repelling grease, water, and stains, making them widely used in various applications. These chemicals are stable and persistent, earning them the nickname “forever chemicals” because they do not readily biodegrade, or break down easily in the environment.
Numerous researchers suggested PFAS are abundant in aquatic systems and toxic to a range of aquatic organisms, with additional concerns of bioaccumulation of PFAS. PFAS accumulate in sediments and aquatic organisms, which pose health risks to wildlife and humans through the food chain. Research suggests linkages of PFAS to disruption of endocrine function, reproduction, and development in aquatic organisms. Research suggests similar linkages of PFAS to humans, like increased cancer risk, immune system suppression, endocrine and reproductive disruption, and child developmental concerns.
The United States Geological Survey (USGS) estimated that at least 45% of the United States’ tap water has one or more PFAS chemicals (Smalling et al. 2023). At least one PFAS was identified in 60% of public wells and 20% of domestic wells supplying drinking water in the eastern United States (McMahon et al. 2022).
Have PFAS been found in Santa Rosa County drinking water and surface waters?
Measured PFAS in Florida and Santa Rosa County Drinking Waters
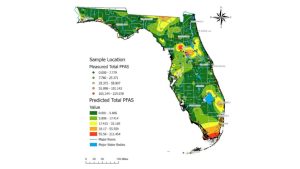
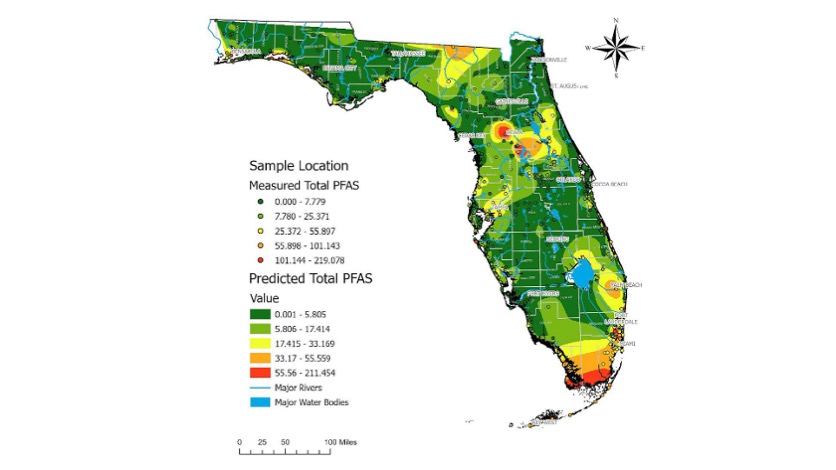
Figure 1. Map with measured total PFAS in drinking water samples across a gradient of low concentrations (green dots) to medium concentrations (yellow dots) to higher concentrations (red dots). Shaded map colors are the predicted total PFAS using estimated values of PFAS concentrations from low (green) to high (red). Data, figure, and result interpolation from Sinkway et al. 2024.
A team of researchers completed a comprehensive statewide assessment of PFAS in Florida drinking water (Sinkway et al. 2024). The team collected 448 drinking water samples across all 67 Florida counties. The drinking water samples were analyzed for 31 PFAS, where 19 PFAS were found in at least one drinking water sample. The top five most frequently detected PFAS across Florida were 6:2 fluorotelomer sulfonate (6:2 FTS) (in 84% of the samples analyzed), Perfluorooctanoic acid (PFOA) (65%), linear perfluorooctane sulfonate (PFOS) (65%), branched PFOS (64%), and perfluorobutane sulfonic acid (PFBS).
A total of 107 taps had PFOA or PFOS concentrations above 4 ng/L (ppt), where the maximum total PFAS concentration in a tap was 219 ng/L. A maximum contaminant level for PFOA and PFOS of 4 ng/L was implemented by the United States Environmental Protection Agency National Primary Drinking Water Regulation as of May 14, 2025 (USEPA, 2025). Overall, 8% of the drinking water samples analyzed exceeded 4 ng/L for PFOA and 16% for PFOS. The average total PFAS in city water was 15.6 ng/L, and in well water was 4.5 ng/L across Florida.
Santa Rosa County was not ranked in the 12 Florida counties with the highest maximum and average total PFAS concentrations (ng/L) or the lowest maximum and average total PFAS concentrations (ng/L) in drinking water (Table 1). Santa Rosa ranked 34th for the highest maximum total PFAS concentration and 35th for the highest average total PFAS concentration among the 67 Florida counties. Among the 25 drinking water samples collected, the maximum total PFAS concentration measured was 15 ng/L with an average total PFAS of 4.8 ng/L among the drinking water samples.

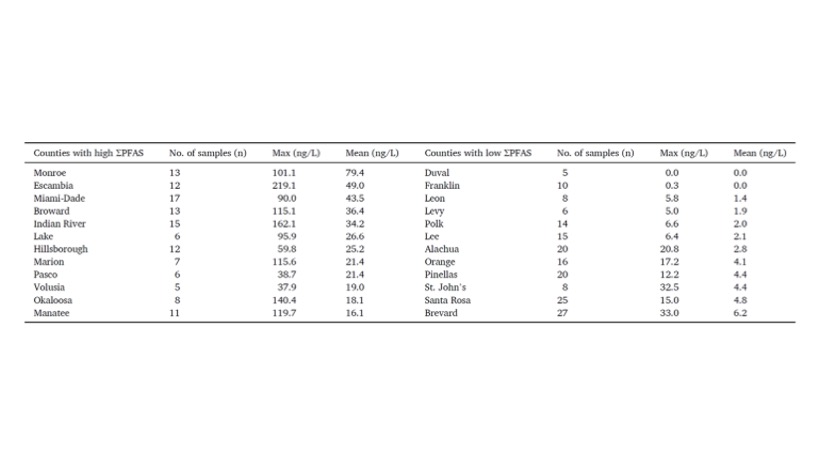
Table 1. The 12 Florida counties with highest and lowest total PFAS drinking water concentrations (ng/L). Data, figure, and result interpolation from Sinkway et al. 2024.
Measured PFAS in Florida and Santa Rosa County Surface Waters
A team of researchers completed a comprehensive statewide assessment of PFAS in Florida surface waters (Camacho et al. 2024). A network of citizen scientists collected 2,323 surface water samples across the 67 Florida counties. These surface water samples were analyzed for 50 PFAS, with 33 PFAS being detected in at least one surface water sample across Florida. The top five most frequently detected PFAS were perfluorooctanoic acid (PFOA) (94% of the samples), perfluorobutane sulfonic acid (PFBS) (65%), perfluorohexanoic acid (PFHxA) (61%), perfluorononanoic acid (PFNA) (54%), and perfluorooctane sulfonate (PFOS) (53%).
There were 915 surface water samples (39%) with PFOA concentrations above 4 ng/L and 920 samples (40%) with PFOS above 4 ng/L. All counties had at least one sample with PFOA, 96% had PFNA, 93% had PFBS, 91% had PFOS, and 82% of counties had PFHxA. The average PFAS detected among counties ranged from 2 ng/L of PFNA to 10 ng/L of PFOS. The maximum PFAS detected among counties ranged from 81 ng/L of PFOA to 1135 ng/L of PFOS.

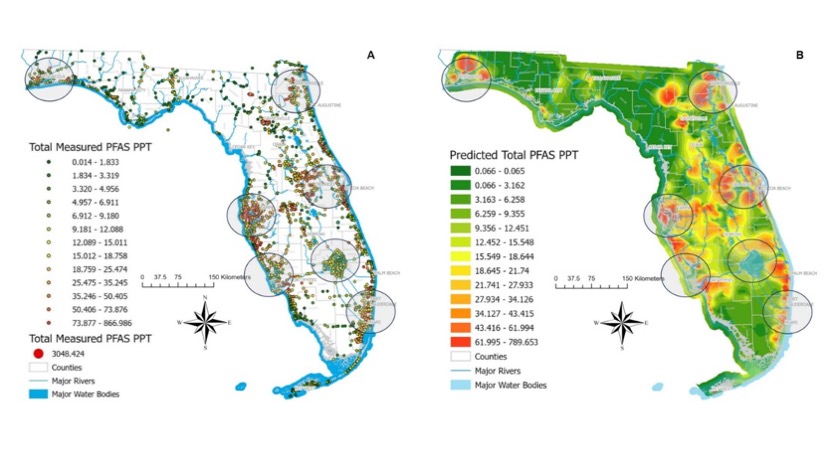
Figure 2. Surface water sampled sites with detected PFAS, where the dots’ color represents the total PFAS concentration measured. Map B shows predicted PFAS levels based on measured total PFAS concentrations in surface water samples. Note that these values do not represent predicted PFAS concentrations on land. Data, figure, and result interpolation from Camacho et al. 2024.
A total of 36 surface water samples were collected in Santa Rosa County (Figure 2). Santa Rosa County ranked 31stamong Florida counties with 7 surface water samples (7 samples out of 36 total or 19%) with PFOA above 4 ng/L. Santa Rosa County ranked 26th for the number of samples with 8 samples (22%) above 4 ng/L for PFOS. The average total PFAS concentration detected in a surface water sample was 6 ng/L, while the maximum total PFAS concentration detected in a sample was 29 ng/L.
Dr. Bowden, with the University of Florida’s College of Veterinary Medicine and Chemistry Department, led the PFAS research shared here. Dr. Bowden has extensive information on the Bowden Lab website (https://www.bowdenlaboratory.com/dr-bowden.html), including an interactive map of all the PFAS surface water samples collected in Florida. Select Okaloosa County under the filter section to see the surface water samples and learn more about the PFAS information for each sample collected in Okaloosa County (https://www.bowdenlaboratory.com/florida-surface-water.html).
What does this mean for Santa Rosa County?
PFAS have been detected in drinking water and surface waters in Santa Rosa County. Although not the highest concentrations across the state, there were drinking and surface water samples exceeding USEPA’s 4 ng/L contaminant level standard. Understanding what PFAS are and joining in educational conversations about PFAS helps our community. Efforts that support continued sampling and extended monitoring also increase our understanding of PFAS concentrations in Santa Rosa County’s drinking and surface waters. If you want to learn more about PFAS or join community scientists’ efforts to expand PFAS water monitoring, please contact Dana Stephens, Florida Sea Grant Extension Agent with the UF/IFAS Okaloosa County Extension Office.
References
Camacho, C.G., et al. 2024. Statewide surveillance and mapping of PFAS in Florida surface waters. American Chemical Society, 4: 434-4355. https://doi.org/10.1021/acsestwater
United States Environmental Protection Agency (USEPA). 2025. Per- and polyfluoroalkyl substances (PFAS) final PFAS national primary drinking water regulation. https://www.epa.gov/sdwa/and-polyfluoroalkyl-substances-pfas
McMahon, P.B., Tokranov, A.K., and Bexfield, L.M. 2022. Perfluoroalkyl and polyfluoroalkyl substances in groundwater used as a source of drinking water in the Eastern United States. Environmental Science and Technology 56(4): 2279-2288. https://doi.org/10.1021/acs.est.1c04795
Skinkway, T.D., et al. 2024. Crowdsourcing citizens for statewide mapping of per- and polyfluoroalkyl substances (PFAS) in Florida drinking water. Science of the Total Environment, 926: 1-9. https://doi.org/10.1016/j.scitotenv.2024.171932
by Dana Stephens | Nov 17, 2025
What are PFAS?
PFAS are per- and polyfluoroalkyl substances. PFAS is a class of chemicals found in various industrial and consumer goods. For instance, you may find them in food packaging, textiles, cosmetics, and frequently in aqueous film-forming foams (AFFFs) used to extinguish fires. PFAS chemicals are known for repelling grease, water, and stains, making them widely used in various applications. These chemicals are stable and persistent, earning them the nickname “forever chemicals” because they do not readily biodegrade, or break down easily in the environment.
Numerous researchers suggested PFAS are abundant in aquatic systems and toxic to a range of aquatic organisms, with additional concerns of bioaccumulation of PFAS. PFAS accumulate in sediments and aquatic organisms, which pose health risks to wildlife and humans through the food chain. Research suggests linkages of PFAS to disruption of endocrine function, reproduction, and development in aquatic organisms. Research suggests similar linkages of PFAS to humans, like increased cancer risk, immune system suppression, endocrine and reproductive disruption, and child developmental concerns.
The United States Geological Survey (USGS) estimated that at least 45% of the United States’ tap water has one or more PFAS chemicals (Smalling et al. 2023). At least one PFAS was identified in 60% of public wells and 20% of domestic wells supplying drinking water in the eastern United States (McMahon et al. 2022).
Have PFAS been found in Walton County drinking water and surface waters?
Measured PFAS in Florida and Walton County Drinking Waters
Figure 1. Map with measured total PFAS in drinking water samples across a gradient of low concentrations (green dots) to medium concentrations (yellow dots) to higher concentrations (red dots). Shaded map colors are the predicted total PFAS using estimated values of PFAS concentrations from low (green) to high (red). Data, figure, and result interpolation from Sinkway et al. 2024.
A team of researchers completed a comprehensive statewide assessment of PFAS in Florida drinking water (Sinkway et al. 2024). The team collected 448 drinking water samples across all 67 Florida counties. The drinking water samples were analyzed for 31 PFAS, where 19 PFAS were found in at least one drinking water sample. The top five most frequently detected PFAS across Florida were 6:2 fluorotelomer sulfonate (6:2 FTS) (in 84% of the samples analyzed), Perfluorooctanoic acid (PFOA) (65%), linear perfluorooctane sulfonate (PFOS) (65%), branched PFOS (64%), and perfluorobutane sulfonic acid (PFBS).
A total of 107 taps had PFOA or PFOS concentrations above 4 ng/L (ppt), where the maximum total PFAS concentration in a tap was 219 ng/L. A maximum contaminant level for PFOA and PFOS of 4 ng/L was implemented by the United States Environmental Protection Agency National Primary Drinking Water Regulation as of May 14, 2025 (USEPA, 2025). Overall, 8% of the drinking water samples analyzed exceeded 4 ng/L for PFOA and 16% for PFOS. The average total PFAS in city water was 15.6 ng/L, and in well water was 4.5 ng/L across Florida.
Walton County was not ranked in the 12 Florida counties with the highest maximum and average total PFAS concentrations (ng/L) in drinking water (Table 1). Walton County was not included in the rankings of Florida counties with the lowest maximum and average total PFAS concentrations (ng/L) in drinking water as the total number of samples (n=3) was below the required 5 total number sample requirement (Table 1). Among the three drinking water samples collected, the maximum PFAS concentration measured was 0 ng/L with an average of 0 ng/L. Walton County had no drinking water samples exceeding the 4 ng/L standard for PFOA.
Table 1. The 12 Florida counties with highest and lowest total PFAS drinking water concentrations (ng/L). Data, figure, and result interpolation from Sinkway et al. 2024.
Measured PFAS in Florida and Walton County Surface Waters
A team of researchers completed a comprehensive statewide assessment of PFAS in Florida surface waters (Camacho et al. 2024). A network of citizen scientists collected 2,323 surface water samples across the 67 Florida counties. These surface water samples were analyzed for 50 PFAS, with 33 PFAS being detected in at least one surface water sample across Florida. The top five most frequently detected PFAS were perfluorooctanoic acid (PFOA) (94% of the samples), perfluorobutane sulfonic acid (PFBS) (65%), perfluorohexanoic acid (PFHxA) (61%), perfluorononanoic acid (PFNA) (54%), and perfluorooctane sulfonate (PFOS) (53%).
There were 915 surface water samples (39%) with PFOA concentrations above 4 ng/L and 920 samples (40%) with PFOS above 4 ng/L. All counties had at least one sample with PFOA, 96% had PFNA, 93% had PFBS, 91% had PFOS, and 82% of counties had PFHxA. The average PFAS detected among counties ranged from 2 ng/L of PFNA to 10 ng/L of PFOS. The maximum PFAS detected among counties ranged from 81 ng/L of PFOA to 1135 ng/L of PFOS.
Figure 2. Surface water sampled sites with detected PFAS, where the dots’ color represents the total PFAS concentration measured. Map B shows predicted PFAS levels based on measured total PFAS concentrations in surface water samples. Note that these values do not represent predicted PFAS concentrations on land. Data, figure, and result interpolation from Camacho et al. 2024.
A total of 18 surface water samples were collected in Walton County (Figure 2). Walton County ranked 51st among Florida counties with one surface water sample (one sample out of 18 total or 5%) with PFOA above 4 ng/L. Walton County ranked 42nd for the number of samples with two samples (11%) above 4 ng/L for PFOS. The average total PFAS concentration detected in a surface water sample was 6 ng/L, while the maximum total PFAS concentration detected in a sample was 29 ng/L.
Dr. Bowden, with the University of Florida’s College of Veterinary Medicine and Chemistry Department, led the PFAS research shared here. Dr. Bowden has extensive information on the Bowden Lab website (https://www.bowdenlaboratory.com/dr-bowden.html), including an interactive map of all the PFAS surface water samples collected in Florida. Select Okaloosa County under the filter section to see the surface water samples and learn more about the PFAS information for each sample collected in Okaloosa County (https://www.bowdenlaboratory.com/florida-surface-water.html).
What does this mean for Walton County?
PFAS were not detected in drinking waters in Walton County. However, the sample size, or the number of samples, was small with three total samples collected and analyzed. PFAS were detected in surface waters in Walton County. Although not the highest concentrations or most frequent identified in Florida, there were surface water samples above USEPA’s 4 ng/L contaminant level standard for PFOA and PFOS.
Understanding what PFAS are and joining in educational conversations about PFAS helps the Walton County community. Efforts that support continued sampling and extended monitoring also increase our understanding of PFAS concentrations in Walton County’s drinking and surface waters. If you want to learn more about PFAS or join community scientists’ efforts to expand PFAS water monitoring, please contact Dana Stephens, Florida Sea Grant Extension Agent with the UF/IFAS Okaloosa County Extension Office.
References
Camacho, C.G., et al. 2024. Statewide surveillance and mapping of PFAS in Florida surface waters. American Chemical Society, 4: 434-4355. https://doi.org/10.1021/acsestwater
United States Environmental Protection Agency (USEPA). 2025. Per- and polyfluoroalkyl substances (PFAS) final PFAS national primary drinking water regulation. https://www.epa.gov/sdwa/and-polyfluoroalkyl-substances-pfas
McMahon, P.B., Tokranov, A.K., and Bexfield, L.M. 2022. Perfluoroalkyl and polyfluoroalkyl substances in groundwater used as a source of drinking water in the Eastern United States. Environmental Science and Technology 56(4): 2279-2288. https://doi.org/10.1021/acs.est.1c04795
Skinkway, T.D., et al. 2024. Crowdsourcing citizens for statewide mapping of per- and polyfluoroalkyl substances (PFAS) in Florida drinking water. Science of the Total Environment, 926: 1-9. https://doi.org/10.1016/j.scitotenv.2024.171932
by Dana Stephens | Nov 17, 2025
What are PFAS?
PFAS are per- and polyfluoroalkyl substances. PFAS is a class of chemicals found in various industrial and consumer goods. For instance, you may find them in food packaging, textiles, cosmetics, and frequently in aqueous film-forming foams (AFFFs) used to extinguish fires. PFAS chemicals are known for repelling grease, water, and stains, making them widely used in various applications. These chemicals are stable and persistent, earning them the nickname “forever chemicals” because they do not readily biodegrade, or break down easily in the environment.
Numerous researchers suggested PFAS are abundant in aquatic systems and toxic to a range of aquatic organisms, with additional concerns of bioaccumulation of PFAS. PFAS accumulate in sediments and aquatic organisms, which pose health risks to wildlife and humans through the food chain. Research suggests linkages of PFAS to disruption of endocrine function, reproduction, and development in aquatic organisms. Research suggests similar linkages of PFAS to humans, like increased cancer risk, immune system suppression, endocrine and reproductive disruption, and child developmental concerns.
The United States Geological Survey (USGS) estimated that at least 45% of the United States’ tap water has one or more PFAS chemicals (Smalling et al. 2023). At least one PFAS was identified in 60% of public wells and 20% of domestic wells supplying drinking water in the eastern United States (McMahon et al. 2022).
Have PFAS been found in Escambia County drinking water and surface waters?
Measured PFAS in Florida and Escambia County Drinking Waters
Figure 1. Map with measured total PFAS in drinking water samples across a gradient of low concentrations (green dots) to medium concentrations (yellow dots) to higher concentrations (red dots). Shaded map colors are the predicted total PFAS using estimated values of PFAS concentrations from low (green) to high (red). Data, figure, and result interpolation from Sinkway et al. 2024.
A team of researchers completed a comprehensive statewide assessment of PFAS in Florida drinking water (Sinkway et al. 2024). The team collected 448 drinking water samples across all 67 Florida counties. The drinking water samples were analyzed for 31 PFAS, where 19 PFAS were found in at least one drinking water sample. The top five most frequently detected PFAS across Florida were 6:2 fluorotelomer sulfonate (6:2 FTS) (in 84% of the samples analyzed), Perfluorooctanoic acid (PFOA) (65%), linear perfluorooctane sulfonate (PFOS) (65%), branched PFOS (64%), and perfluorobutane sulfonic acid (PFBS).
A total of 107 taps had PFOA or PFOS concentrations above 4 ng/L (ppt), where the maximum total PFAS concentration in a tap was 219 ng/L. A maximum contaminant level for PFOA and PFOS of 4 ng/L was implemented by the United States Environmental Protection Agency National Primary Drinking Water Regulation as of May 14, 2025 (USEPA, 2025). Overall, 8% of the drinking water samples analyzed exceeded 4 ng/L for PFOA and 16% for PFOS. The average total PFAS in city water was 15.6 ng/L, and in well water was 4.5 ng/L across Florida.
Escambia County ranked 2nd among the 67 Florida counties for the highest maximum and average total PFAS concentrations (ng/L) or the lowest maximum and average total PFAS concentrations (ng/L) in drinking water (Table 1). Among the 12 drinking water samples collected, the maximum total PFAS concentration measured was 219 ng/L, with an average total PFAS of 49 ng/L among the drinking water samples.
Table 1. The 12 Florida counties with highest and lowest total PFAS drinking water concentrations (ng/L). Data, figure, and result interpolation from Sinkway et al. 2024.
Measured PFAS in Florida and Escambia County Surface Waters
A team of researchers completed a comprehensive statewide assessment of PFAS in Florida surface waters (Camacho et al. 2024). A network of citizen scientists collected 2,323 surface water samples across the 67 Florida counties. These surface water samples were analyzed for 50 PFAS, with 33 PFAS detected in at least one surface water sample across Florida. The top five most frequently detected PFAS were perfluorooctanoic acid (PFOA) (94% of the samples), perfluorobutane sulfonic acid (PFBS) (65%), perfluorohexanoic acid (PFHxA) (61%), perfluorononanoic acid (PFNA) (54%), and perfluorooctane sulfonate (PFOS) (53%).
There were 915 surface water samples (39%) with PFOA concentrations above 4 ng/L and 920 samples (40%) with PFOS above 4 ng/L (Figure 2). All counties had at least one sample with PFOA, 96% had PFNA, 93% had PFBS, 91% had PFOS, and 82% of counties had PFHxA. The average PFAS detected among counties ranged from 2 ng/L of PFNA to 10 ng/L of PFOS. The maximum PFAS detected among counties ranged from 81 ng/L of PFOA to 1135 ng/L of PFOS.
Figure 2. Surface water sampled sites with detected PFAS, where the dots’ color represents the total PFAS concentration measured. Map B shows predicted PFAS levels based on measured total PFAS concentrations in surface water samples. Note that these values do not represent predicted PFAS concentrations on land. Data, figure, and result interpolation from Camacho et al. 2024.
A total of 52 surface water samples were collected in Escambia County. Escambia County ranked 22nd among Florida counties with 14 surface water samples (14 samples out of 52 total or 27%) with PFOA above 4 ng/L. Escambia County ranked 27th for the number of samples, with 7 samples (13%) above 4 ng/L for PFOS. The average total PFAS concentration detected in a surface water sample was 12 ng/L, while the maximum total PFAS concentration detected in a sample was 118 ng/L.
Dr. Bowden, with the University of Florida’s College of Veterinary Medicine and Chemistry Department, led the PFAS research shared here. Dr. Bowden has extensive information on the Bowden Lab website (https://www.bowdenlaboratory.com/dr-bowden.html), including an interactive map of all the PFAS surface water samples collected in Florida. Select Okaloosa County under the filter section to see the surface water samples and learn more about the PFAS information for each sample collected in Okaloosa County (https://www.bowdenlaboratory.com/florida-surface-water.html).
What does this mean for Escambia County?
PFAS were detected in drinking water and surface waters in Escambia County. There were drinking and surface water samples exceeding USEPA’s 4 ng/L contaminant level standard, notably in the 12 collected drinking water samples. Understanding what PFAS are and joining in educational conversations about PFAS helps our community. Efforts that support continued sampling and extended monitoring also increase our understanding of PFAS concentrations in Escambia County’s drinking and surface waters. If you want to learn more about PFAS or join community scientists’ efforts to expand PFAS water monitoring, please contact Dana Stephens, Florida Sea Grant Extension Agent with the UF/IFAS Okaloosa County Extension Office.
References
Camacho, C.G., et al. 2024. Statewide surveillance and mapping of PFAS in Florida surface waters. American Chemical Society, 4: 434-4355. https://doi.org/10.1021/acsestwater
United States Environmental Protection Agency (USEPA). 2025. Per- and polyfluoroalkyl substances (PFAS) final PFAS national primary drinking water regulation. https://www.epa.gov/sdwa/and-polyfluoroalkyl-substances-pfas
McMahon, P.B., Tokranov, A.K., and Bexfield, L.M. 2022. Perfluoroalkyl and polyfluoroalkyl substances in groundwater used as a source of drinking water in the Eastern United States. Environmental Science and Technology 56(4): 2279-2288. https://doi.org/10.1021/acs.est.1c04795
Skinkway, T.D., et al. 2024. Crowdsourcing citizens for statewide mapping of per- and polyfluoroalkyl substances (PFAS) in Florida drinking water. Science of the Total Environment, 926: 1-9. https://doi.org/10.1016/j.scitotenv.2024.171932
by Dana Stephens | Jul 7, 2025
PFAS—have you heard of them? Do you know what they are, or is it more of a term thrown around without much context?
PFAS are per- and polyfluoroalkyl substances. PFAS is a class of chemicals found in various industrial and consumer goods. For instance, you may find them in food packaging, textiles, cosmetics, and frequently in aqueous film-forming foams (AFFFs) used to extinguish fires. PFAS chemicals are known for repelling grease, water, and stains, making them widely used in various applications. These chemicals are stable and persistent, earning them the nickname “forever chemicals” because they do not readily biodegrade, or break down easily in the environment.
Numerous researchers suggested PFAS are abundant in aquatic systems and toxic to a range of aquatic organisms, with additional concerns of bioaccumulation of PFAS. PFAS accumulate in sediments and aquatic organisms, which pose health risks to wildlife and humans through the food chain. Research suggests linkages of PFAS to disruption of endocrine function, reproduction, and development in aquatic organisms. Research suggests similar linkages of PFAS to humans, like increased cancer risk, immune system suppression, endocrine and reproductive disruption, and child developmental concerns.
The United States Geological Survey (USGS) estimated at least 45% of the United States’ tap water has one or more PFAS chemicals (Smalling et al. 2023). At least one PFAS was identified in 60% of public wells and 20% of domestic wells supplying drinking water in the eastern United States (McMahon et al. 2022).
Have PFAS been found in Okaloosa County drinking water and surface waters?
Measured PFAS in Florida and Okaloosa County Drinking Waters
Figure 1. Map with measured total PFAS samples across a gradient of low concentrations (green dots) to medium concentrations (yellow dots) to higher concentrations (red dots). Shaded map colors are the predicted total PFAS using estimated values of PFAS concentrations from low (green) to high (red). Data, figure, and result interpolation from Sinkway et al. 2024.
A team of researchers completed a comprehensive statewide assessment of PFAS in Florida drinking water (Sinkway et al. 2024). The team collected 448 drinking water samples across all 67 Florida counties. The drinking water samples were analyzed for 31 PFAS, where 19 PFAS were found in at least one drinking water sample. The top five most frequently detected PFAS were 6:2 fluorotelomer sulfonate (6:2 FTS) (in 84% of the samples analyzed), Perfluorooctanoic acid (PFOA) (65%), linear perfluorooctane sulfonate (PFOS) (65%), branched PFOS (64%), and perfluorobutane sulfonic acid (PFBS).
A total of 107 taps had PFOA or PFOS concentrations above 4 ng/L (ppt), where the maximum total PFAS concentration in a tap was 219 ng/L (Click on link for higher resolution–Figure 1). The maximum contaminant level for PFOA and PFOS is 4 ng/L, legally enforced by the United States Environmental Protection Agency National Primary Drinking Water Regulation as of May 14, 2025 (USEPA, 2025). Overall, 8% of the drinking water samples analyzed exceeded 4 ng/L for PFOA and 16% for PFOS. The average total PFAS in city water was 15.6 ng/L, and in well water was 4.5 ng/L.
Table 1. Top average 12 Florida counties with highest and lowest total PFAS concentrations (ng/L). Data, figure, and result interpolation from Sinkway et al. 2024.
Okaloosa County had the 11th highest total PFAS (ng/L) concentration among the 67 Florida counties (Click on link for higher resolution–Table 1). Among the eight drinking water samples collected, the maximum PFAS concentration measured was 140 ng/L, and the lowest was 18 mg/L. Okaloosa County had one drinking water sample that exceeded the 4 ng/L standard for PFOA. There were no drinking water samples that exceeded 4 ng/L for PFOS.
Measured PFAS in Florida and Okaloosa County Surface Waters
A team of researchers completed a comprehensive statewide assessment of PFAS in Florida surface waters (Camacho et al. 2024). A network of citizen scientists collected 2,323 surface water samples across the 67 Florida counties. These surface water samples were analyzed for 50 PFAS, with 33 PFAS being detected in at least one surface water sample. The top five most frequently detected PFAS were perfluorooctanoic acid (PFOA) (94% of the samples), perfluorobutane sulfonic acid (PFBS) (65%), perfluorohexanoic acid (PFHxA) (61%), perfluorononanoic acid (PFNA) (54%), and perfluorooctane sulfonate (PFOS) (53%).
Figure 2. Map A contains all surface water sampled sites with detected PFAS, where the dots’ color represents the total PFAS concentration measured. Map B shows predicted PFAS levels based on measured total PFAS concentrations in surface water samples. Note that these values do not represent predicted PFAS concentrations on land. Data, figure, and result interpolation from Camacho et al. 2024.
There were 915 (39%) surface water samples with PFOA concentrations above 4 ng/L and 920 (40%) samples with PFOS above 4 ng/L (Click on link for higher resolution–Figure 2). All counties had at least one sample with PFOA, 96% had PFNA, 93% had PFBS, 91% had PFOS, and 82% of counties had PFHxA. The average PFAS detected among counties ranged from 2 ng/L of PFNA to 10 ng/L of PFOS. The maximum PFAS detected among counties ranged from 81 ng/L of PFOA to 1135 ng/L of PFOS. Figure 2
Okaloosa County ranked 27th among Florida counties due to 10 (20%) surface water samples with PFOA above 4 ng/L. Okaloosa County ranked 9th for the number of samples (38 total samples or 78% of the samples) above 4 ng/L for PFOS. A total of 49 surface water samples were collected in Okaloosa County. The average total PFAS concentration detected in a surface water sample was 31 ng/L, while the maximum total PFAS concentration detected in a sample was 185 ng/L.
Dr. Bowden, with the University of Florida’s College of Veterinary Medicine and Chemistry Department, led the PFAS research shared here. Dr. Bowden has extensive information on the Bowden Lab website (https://www.bowdenlaboratory.com/dr-bowden.html), including an interactive map of all the PFAS surface water samples collected in Florida. Select Okaloosa County under the filter section to see the surface water samples and learn more about the PFAS information for each sample collected in Okaloosa County (https://www.bowdenlaboratory.com/florida-surface-water.html).Figure 2 Table 1
What does this mean for Okaloosa County?
PFAS have been detected in drinking water and surface waters in Okaloosa County. Although not the highest concentrations or most frequent identified in Florida, there were drinking and surface water samples above USEPA’s 4 ng/L contaminant level standard. Understanding what PFAS are and joining in educational conversations about PFAS helps our community. Efforts that support continued sampling and extended monitoring also increase our understanding of PFAS concentrations in Okaloosa County’s drinking and surface waters. If you want to learn more about PFAS or join community scientists’ efforts to expand PFAS water monitoring, please contact Dana Stephens at the UF/IFAS Okaloosa County Extension Office.
References
Camacho, C.G., et al. 2024. Statewide surveillance and mapping of PFAS in Florida surface waters. American Chemical Society, 4: 434-4355. https://doi.org/10.1021/acsestwater
United States Environmental Protection Agency (USEPA). 2025. Per- and polyfluoroalkyl substances (PFAS) final PFAS national primary drinking water regulation. https://www.epa.gov/sdwa/and-polyfluoroalkyl-substances-pfas
McMahon, P.B., Tokranov, A.K., and Bexfield, L.M. 2022. Perfluoroalkyl and polyfluoroalkyl substances in groundwater used as a source of drinking water in the Eastern United States. Environmental Science and Technology 56(4): 2279-2288. https://doi.org/10.1021/acs.est.1c04795
Skinkway, T.D., et al. 2024. Crowdsourcing citizens for statewide mapping of per- and polyfluoroalkyl substances (PFAS) in Florida drinking water. Science of the Total Environment, 926: 1-9. https://doi.org/10.1016/j.scitotenv.2024.171932
by Dana Stephens | Jun 6, 2025
Li onfish slayers, divers, fisherfolks, and ocean lovers joined for an exhilarating 2025 lionfish tournament and awareness festival last weekend at Harborwalk in Destin, Florida.
The Emerald Coast Open is the largest lionfish tournament in the world. Lionfish are venomous marine fishes native to the South Pacific and Indian Oceans, or the Indo-Pacific region. Lionfish found along the southeastern United States coast, including the Emerald Coast of Florida, are not native. Lionfish are considered invasive species in the southeastern United States. With few natural predators and an ability to outcompete native species, lionfish can cause damaging impacts to native fishes, crustaceans, and the oceanic ecosystem overall.
The Emerald Coast Open and numerous partners, including Florida Sea Grant, support the lionfish tournament as an effort to reduce the number of li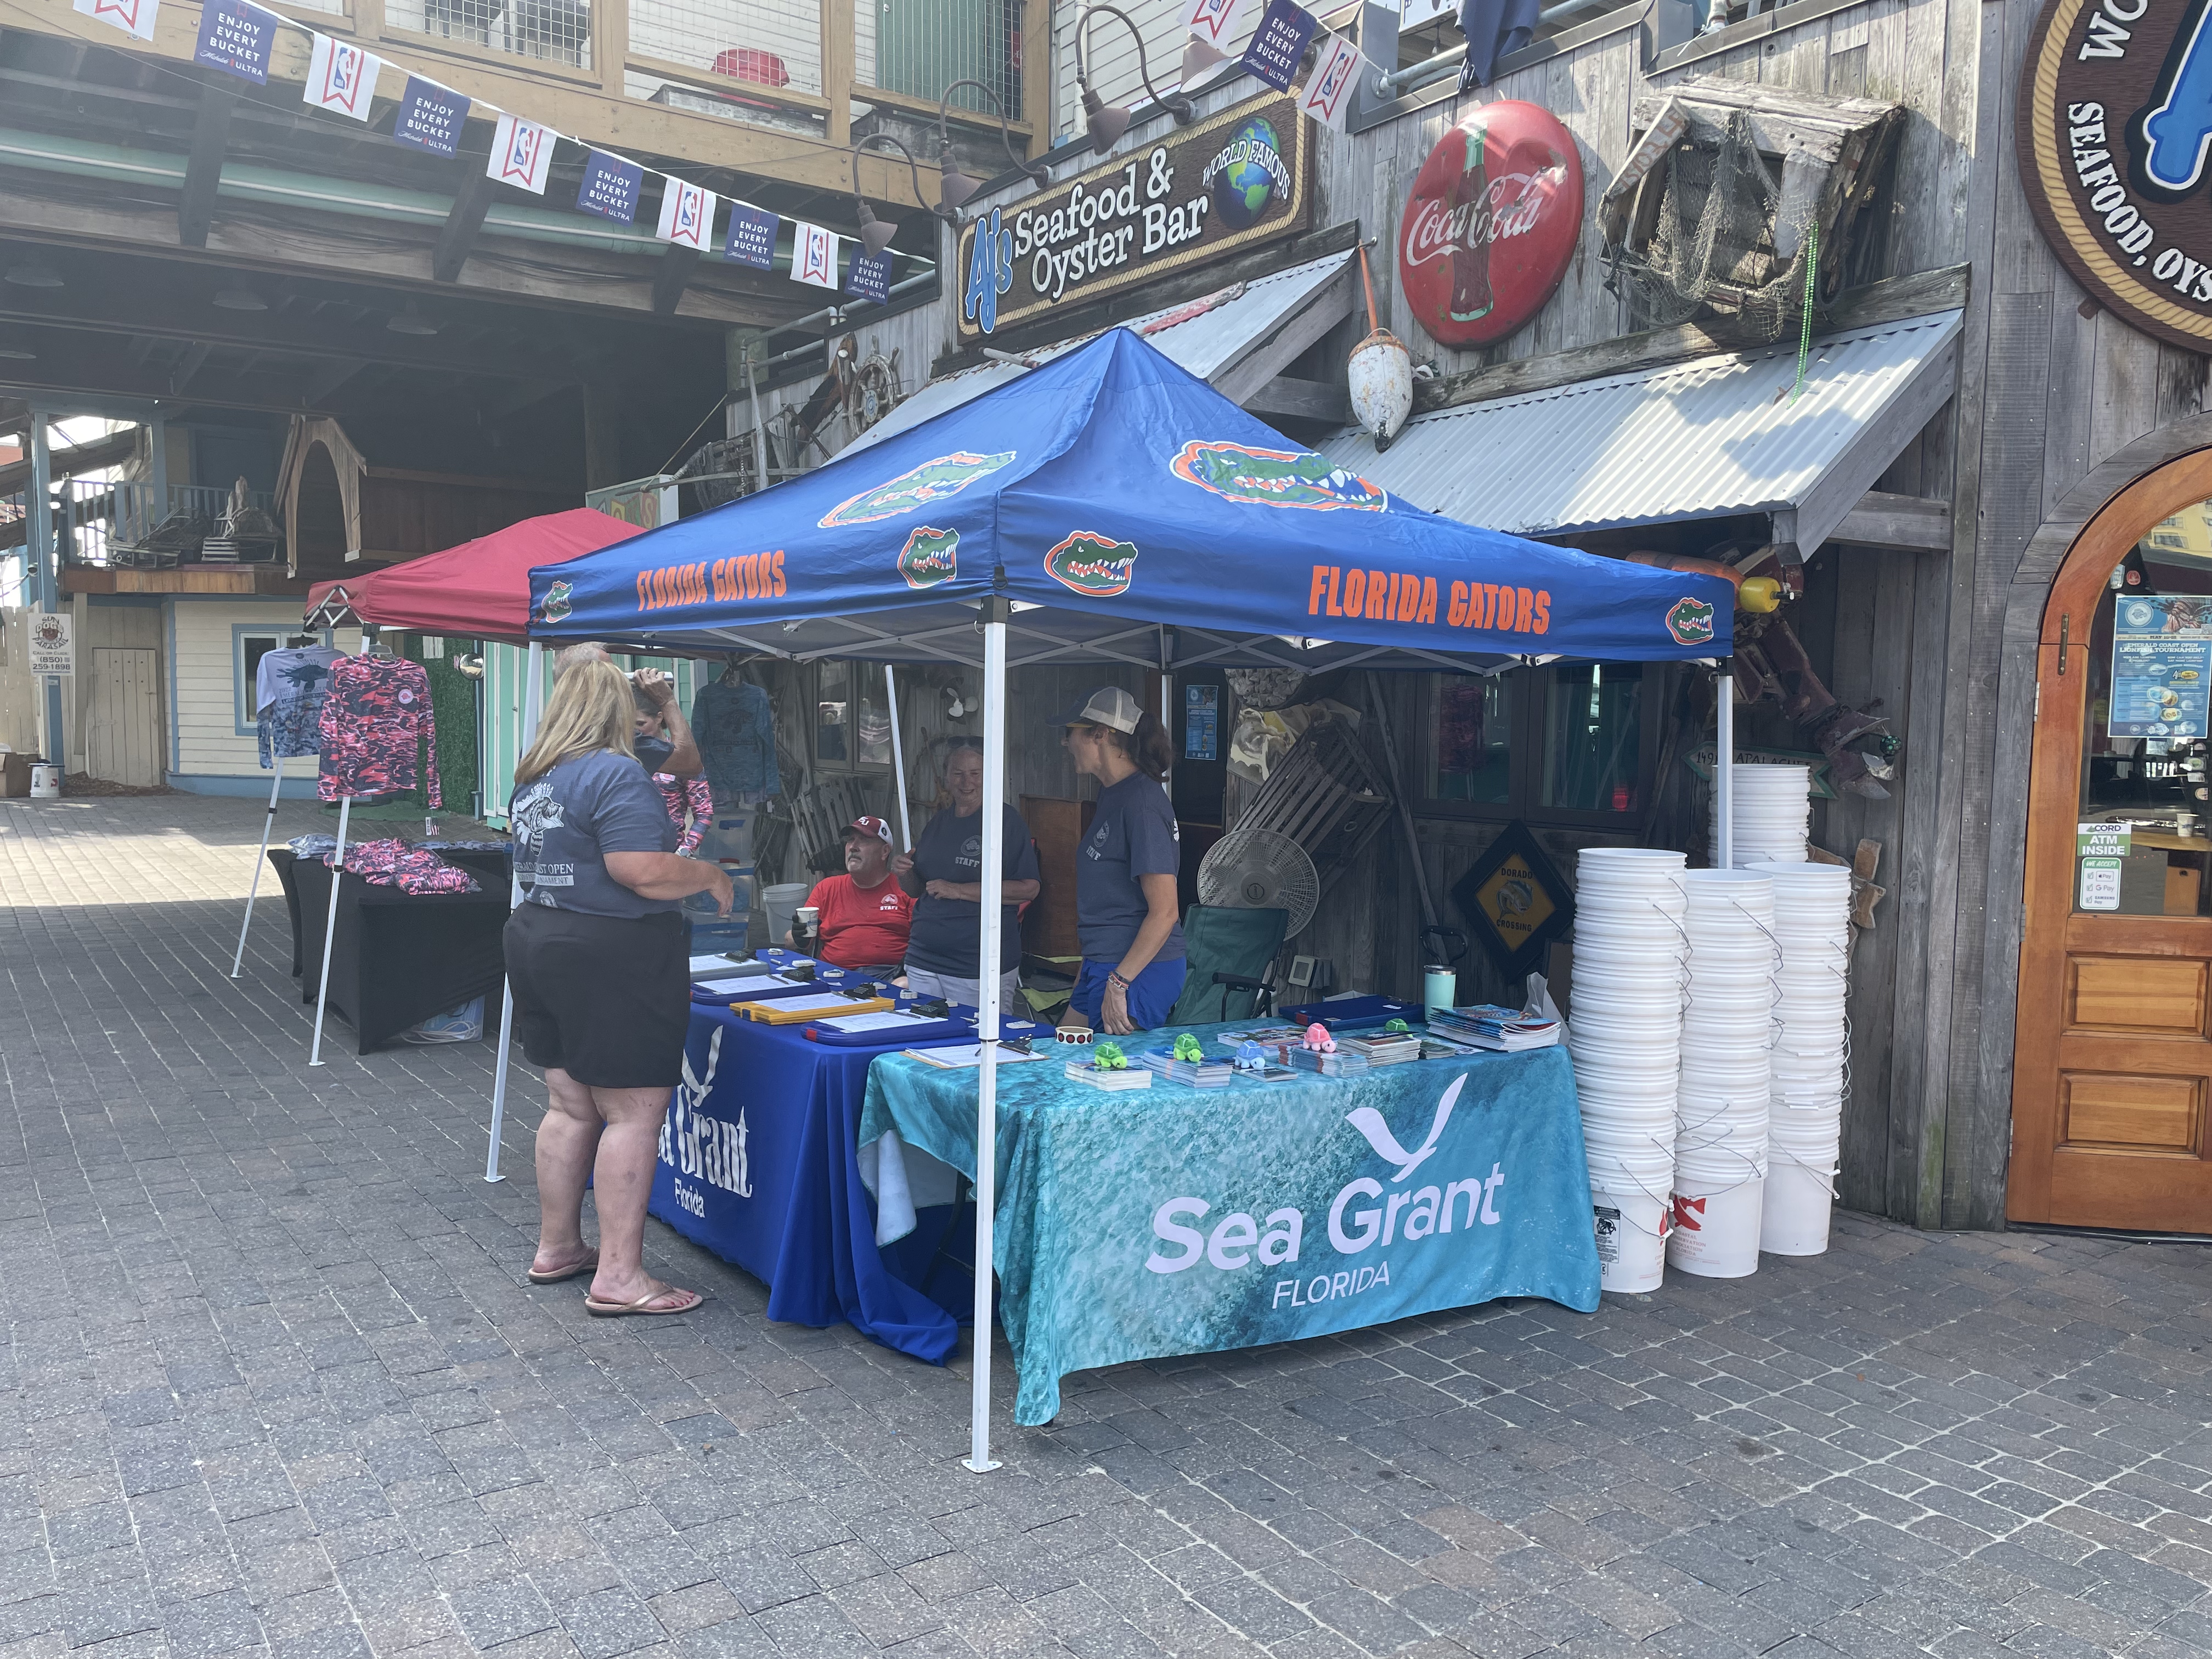 onfish along the Emerald Coast while educating and having fun. Amazing Emerald Coast volunteers (there were 35 this year) processed the lionfish—counting, weighing, and measuring. The lionfish are sold to buyers like restaurant owners who make delicious lionfish dishes, additionally spreading education about lionfish and lionfish as a yummy food source.
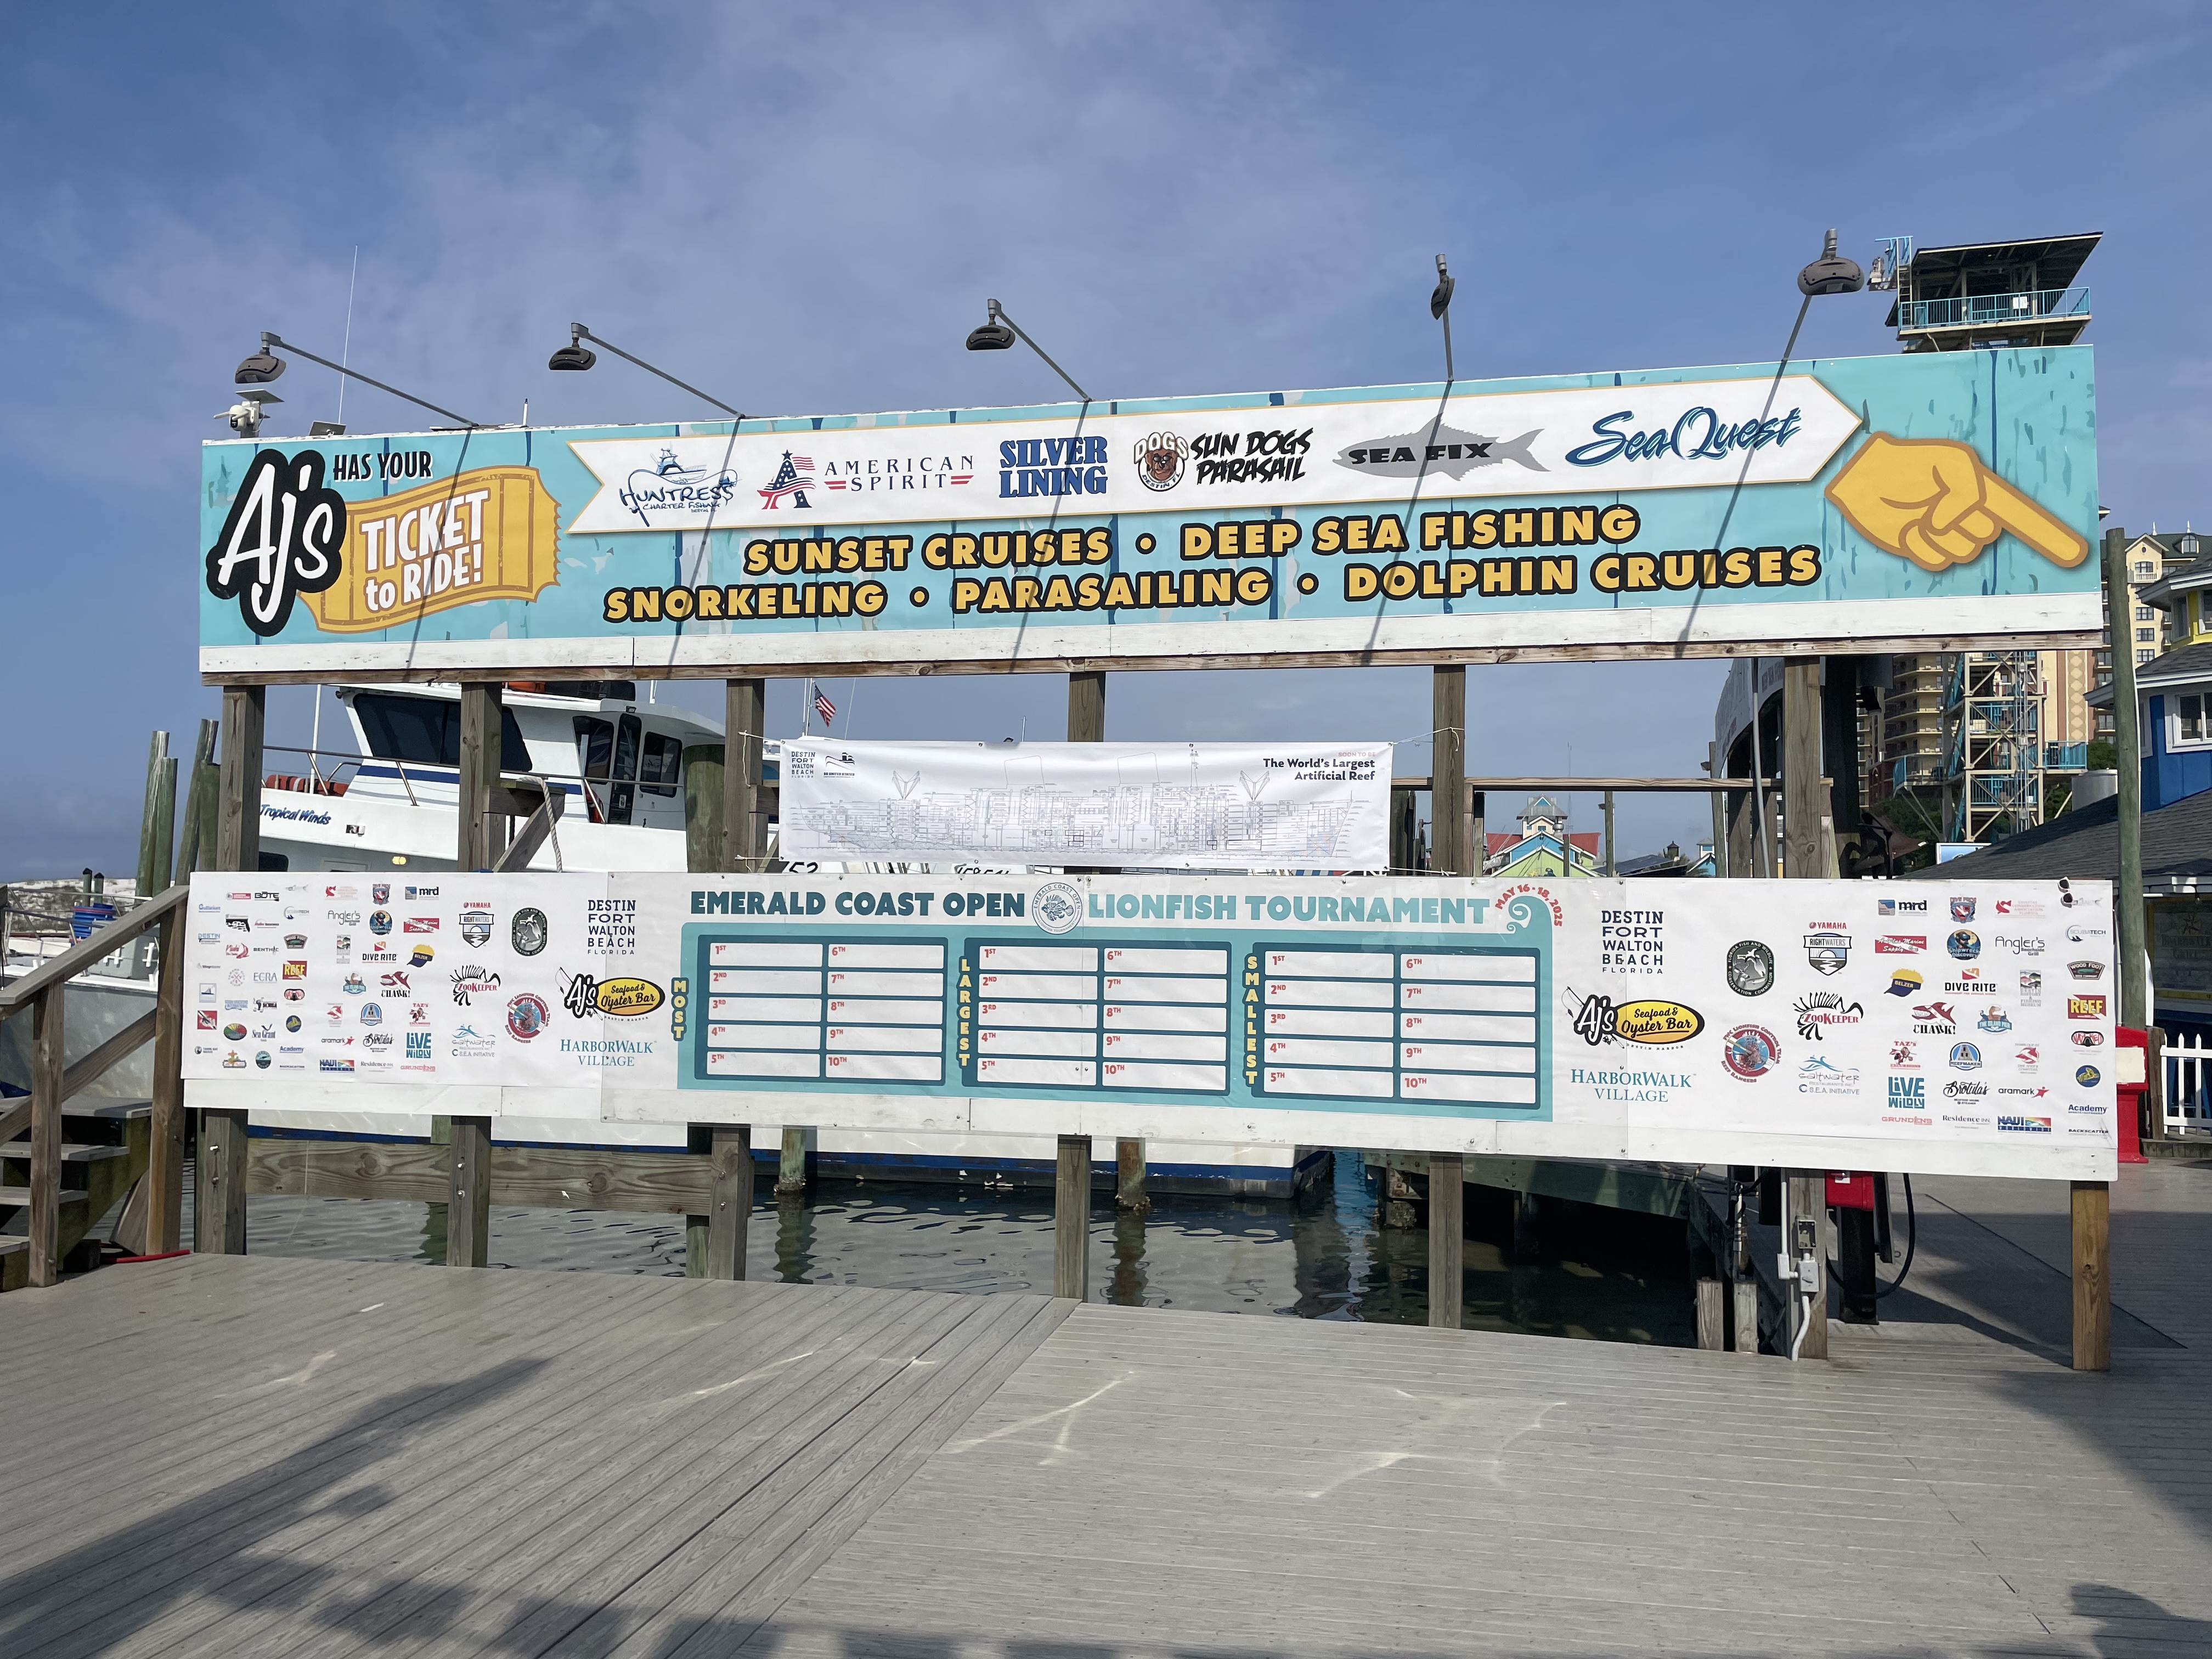
This year was a HUGE success! There were 7,180 lionfish brough in by 143 participants during the pre-tournament and an additional 13,322 lionfish during the main tournament. This means there was a total of 20,502 lionfish were removed from our local waters during the 2025 Emerald Coast Open!
Emerald Coast Open award categories included: most lionfish, biggest lionfish, smallest lionfish, guess the lionfish contest total, and restaurant week. Winners received $65,000 in cash prizes along with participant raffle for amazing prizes worth over $60,000. Winners for each category are listed here and on the Emerald Coast Open’s website and Facebook page.
 \
\
M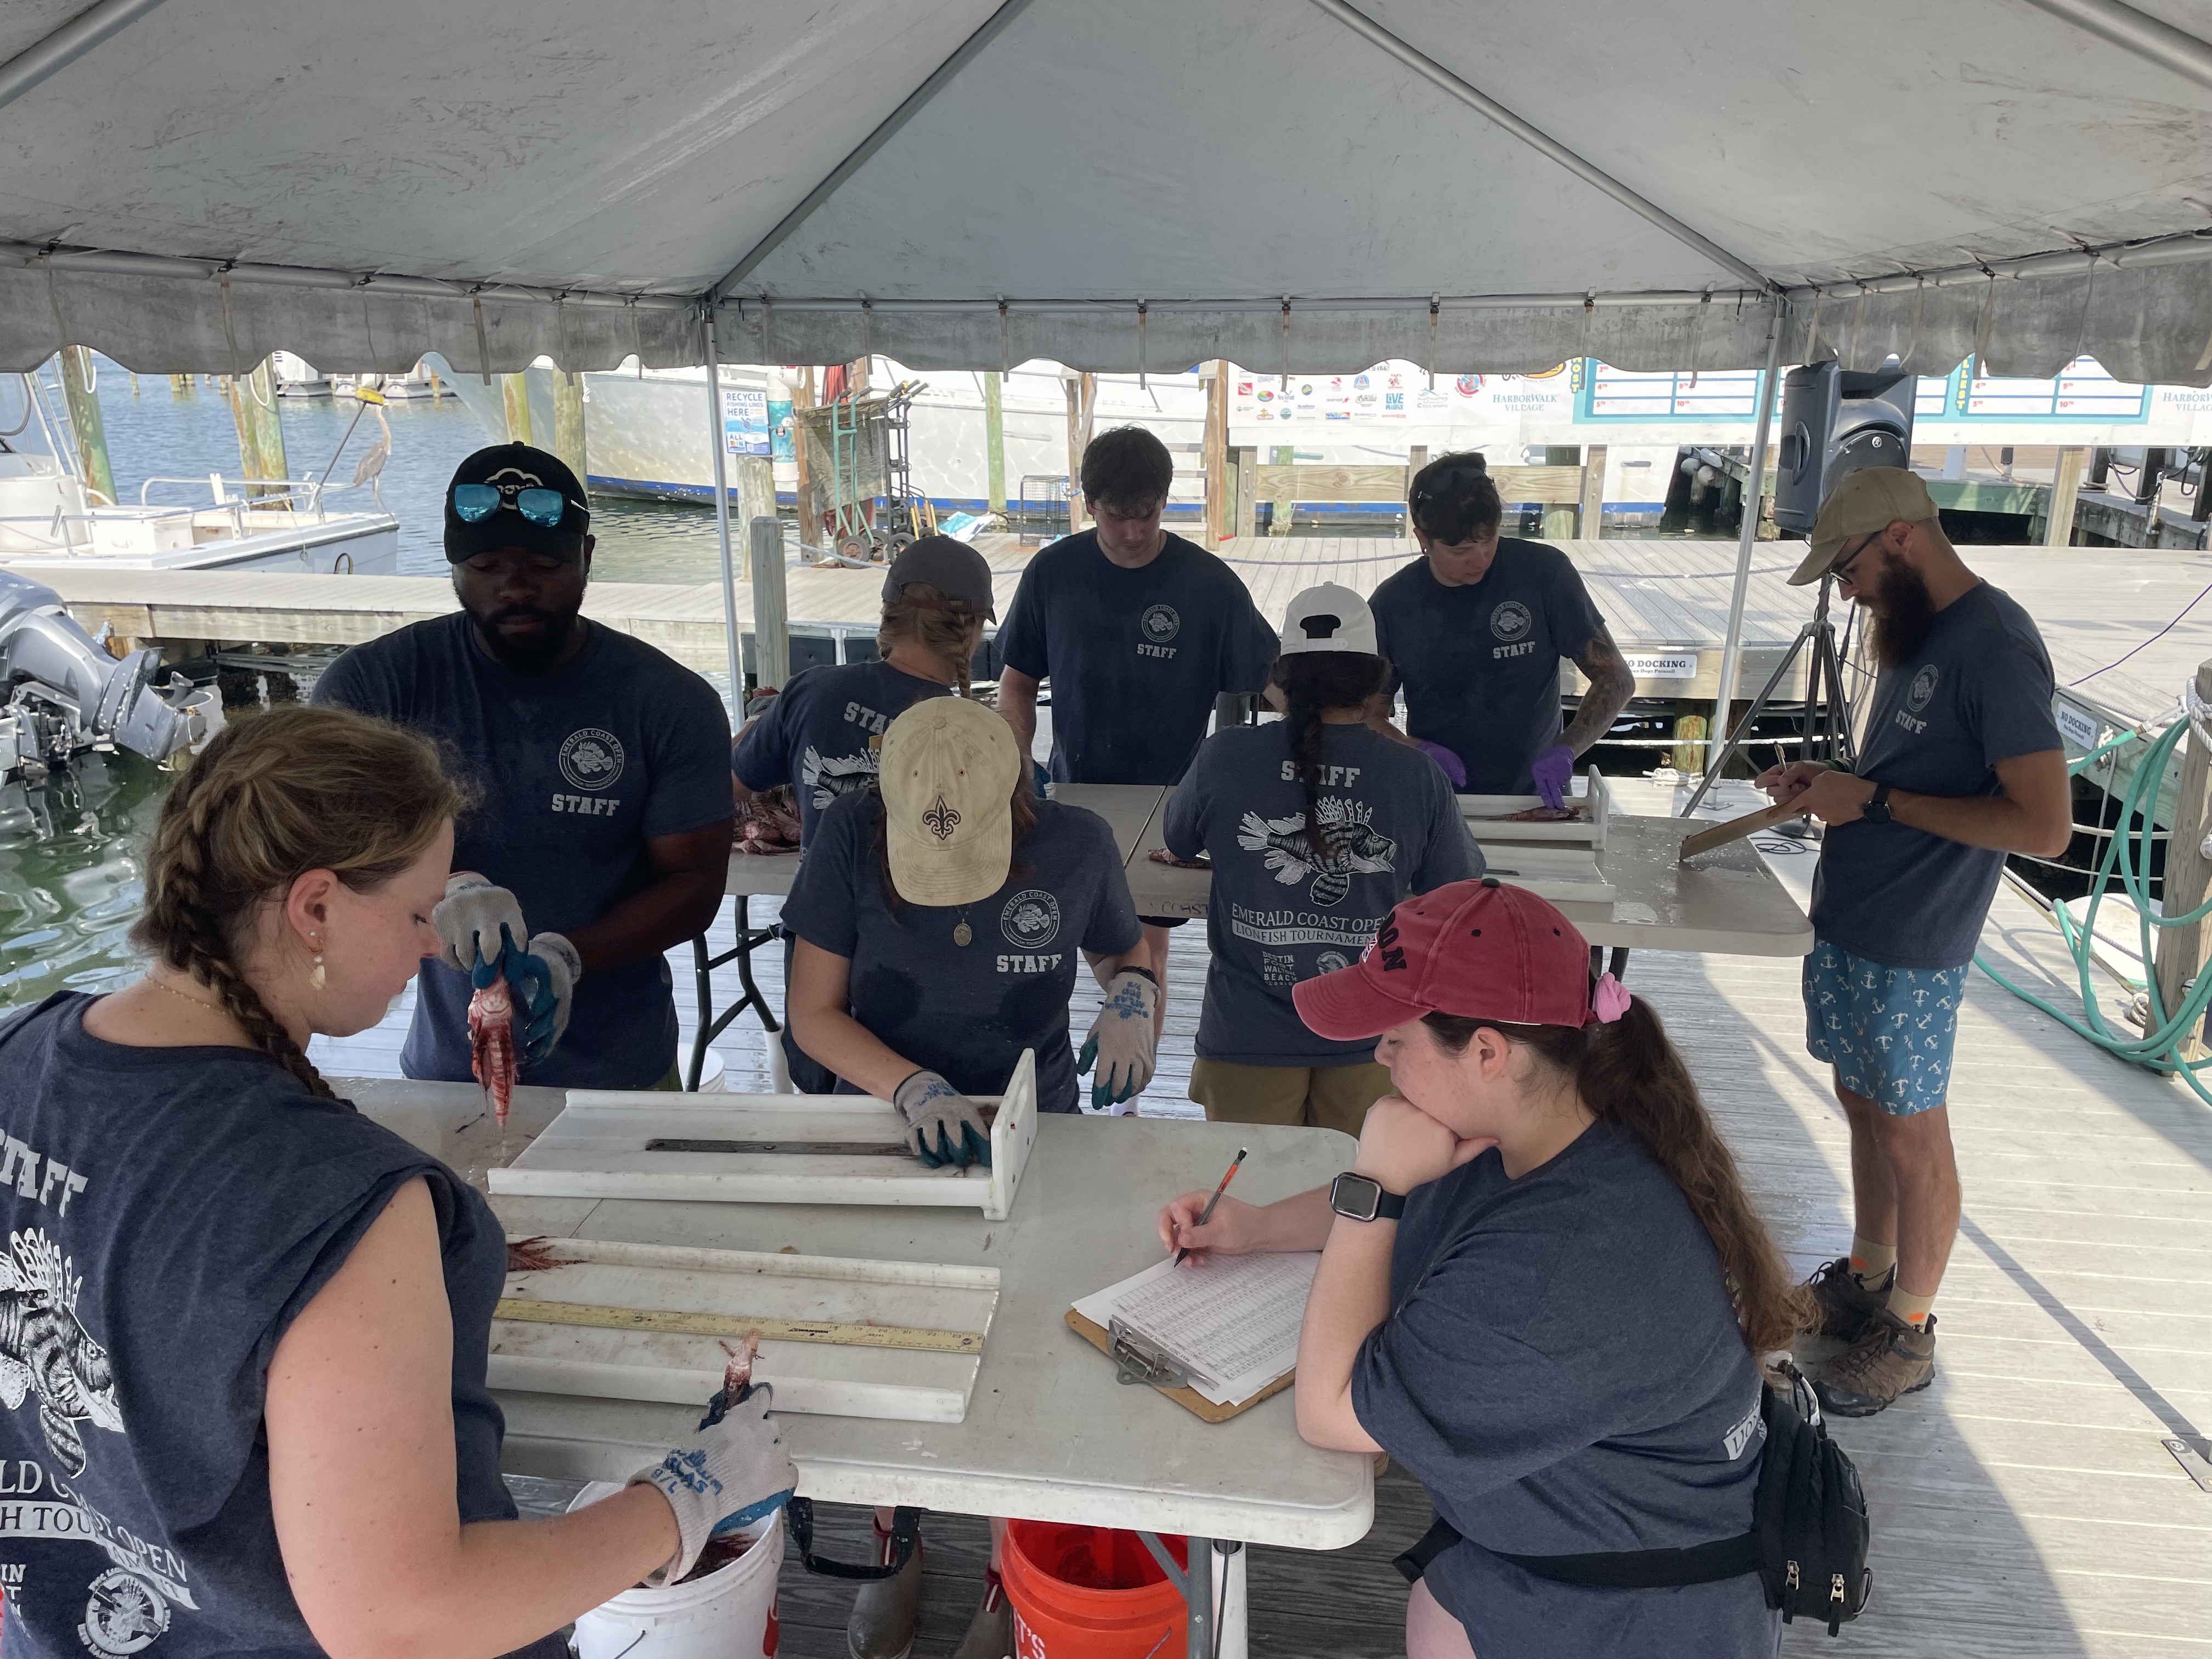 ost Lionfish
1st– DWM1- 2038 lionfish
2nd– Reef Madness- 1256 lionfish
3rd – Shark Quest- 1034 lionfish
4th – Sea Meat- 1029 lionfish
5th – Rubber Duck- 965 lionfish
6th – Covered in Blood- 909 lionfish
7th – In the Clouds- 817 lionfish
8th– DWM Spinal Tap- 695 lionfish
9th– Zookeeper Slayers- 477 lionfish
10th-Black Flag- 457 lionfish
Largest Lionfish
1st– In the Clouds- 17.2 inches
2nd– All Riled Up- 17.1 inches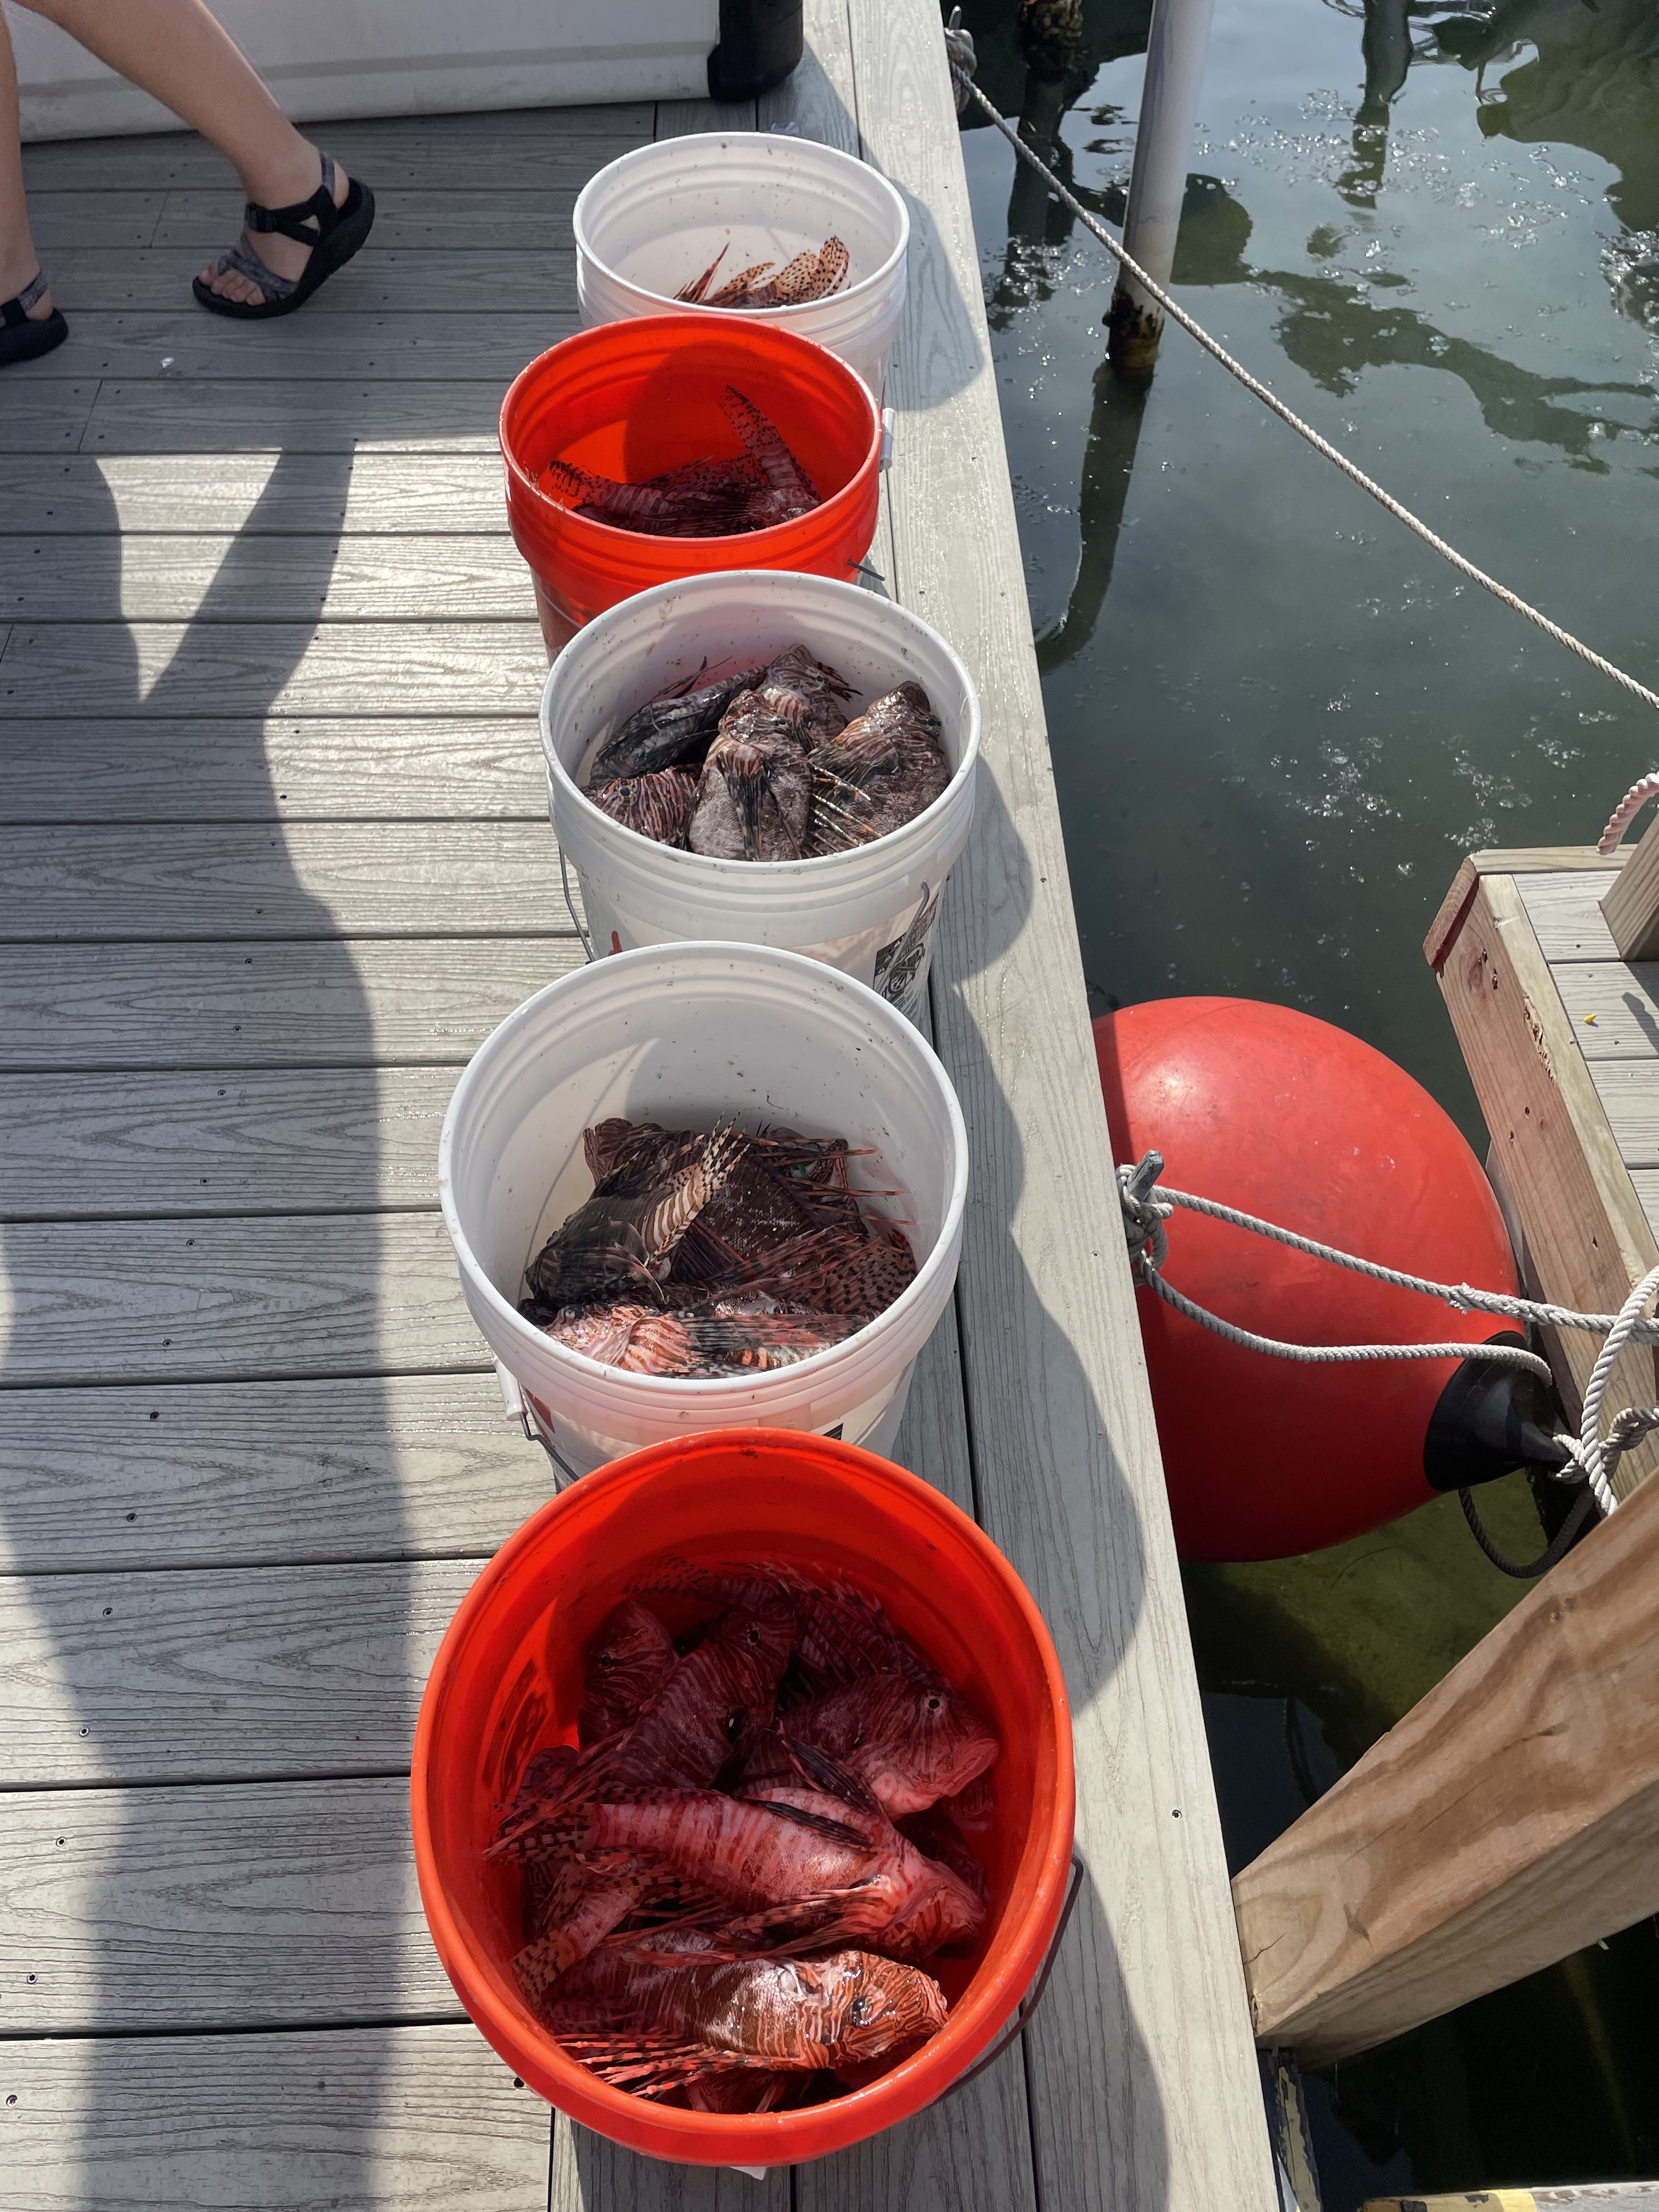
3rd – Off the Deep End- 16.9 inches
4th – Pilot Plunder and Pillage- 16.7 inches
5th – Fin Reapers- 16.6 inches
6th – Hookshott- 16.5 inches
7th – Down N Out- 16.4 inches
8th– Opted Out- 16.3 inches
9th– Tie- Covered in Blood- 16.2 inches
10th-Tie- Rum Fish- 16.2 inches
Smallest Lionfish
1st– Looking Back- 2.87 inches
2nd– Todd’s Team- 3.11 inches
3rd – Tie- In the Clouds- 3.14 inches
4th – Tie- Blue Bucket- 3.14 inches
5th – All Riled Up- 3.38 inches
6th – DWM1- 3.54 inches
7th – Smokediver- 3.62 inches
8th– Shark Quest- 3.66 inches
9th– Tie- Zookeeper Slayers- 3.74 inches
10th-Tie- Off the Deep End- 3.74 inches
Guess Lionfish Total
Carole Donaldson- Guessed 13,300, which was 22 less than the actual 13,322 total
Restaurant Week
1st– La Paz
2nd– Bitterroot
3rd– Beach Walk Café