by Dana Stephens | Jul 7, 2025
PFAS—have you heard of them? Do you know what they are, or is it more of a term thrown around without much context?
PFAS are per- and polyfluoroalkyl substances. PFAS is a class of chemicals found in various industrial and consumer goods. For instance, you may find them in food packaging, textiles, cosmetics, and frequently in aqueous film-forming foams (AFFFs) used to extinguish fires. PFAS chemicals are known for repelling grease, water, and stains, making them widely used in various applications. These chemicals are stable and persistent, earning them the nickname “forever chemicals” because they do not readily biodegrade, or break down easily in the environment.
Numerous researchers suggested PFAS are abundant in aquatic systems and toxic to a range of aquatic organisms, with additional concerns of bioaccumulation of PFAS. PFAS accumulate in sediments and aquatic organisms, which pose health risks to wildlife and humans through the food chain. Research suggests linkages of PFAS to disruption of endocrine function, reproduction, and development in aquatic organisms. Research suggests similar linkages of PFAS to humans, like increased cancer risk, immune system suppression, endocrine and reproductive disruption, and child developmental concerns.
The United States Geological Survey (USGS) estimated at least 45% of the United States’ tap water has one or more PFAS chemicals (Smalling et al. 2023). At least one PFAS was identified in 60% of public wells and 20% of domestic wells supplying drinking water in the eastern United States (McMahon et al. 2022).
Have PFAS been found in Okaloosa County drinking water and surface waters?
Measured PFAS in Florida and Okaloosa County Drinking Waters
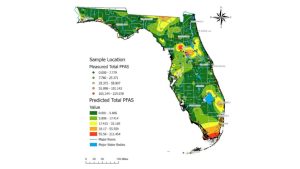
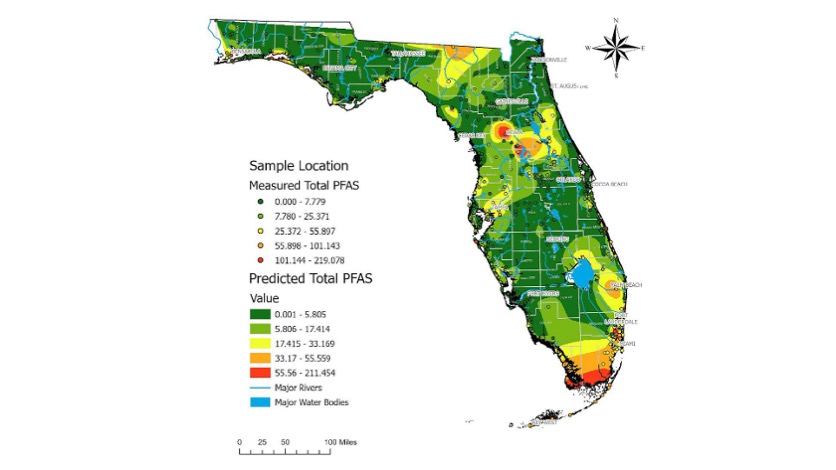
Figure 1. Map with measured total PFAS samples across a gradient of low concentrations (green dots) to medium concentrations (yellow dots) to higher concentrations (red dots). Shaded map colors are the predicted total PFAS using estimated values of PFAS concentrations from low (green) to high (red). Data, figure, and result interpolation from Sinkway et al. 2024.
A team of researchers completed a comprehensive statewide assessment of PFAS in Florida drinking water (Sinkway et al. 2024). The team collected 448 drinking water samples across all 67 Florida counties. The drinking water samples were analyzed for 31 PFAS, where 19 PFAS were found in at least one drinking water sample. The top five most frequently detected PFAS were 6:2 fluorotelomer sulfonate (6:2 FTS) (in 84% of the samples analyzed), Perfluorooctanoic acid (PFOA) (65%), linear perfluorooctane sulfonate (PFOS) (65%), branched PFOS (64%), and perfluorobutane sulfonic acid (PFBS).
A total of 107 taps had PFOA or PFOS concentrations above 4 ng/L (ppt), where the maximum total PFAS concentration in a tap was 219 ng/L (Click on link for higher resolution–Figure 1). The maximum contaminant level for PFOA and PFOS is 4 ng/L, legally enforced by the United States Environmental Protection Agency National Primary Drinking Water Regulation as of May 14, 2025 (USEPA, 2025). Overall, 8% of the drinking water samples analyzed exceeded 4 ng/L for PFOA and 16% for PFOS. The average total PFAS in city water was 15.6 ng/L, and in well water was 4.5 ng/L.

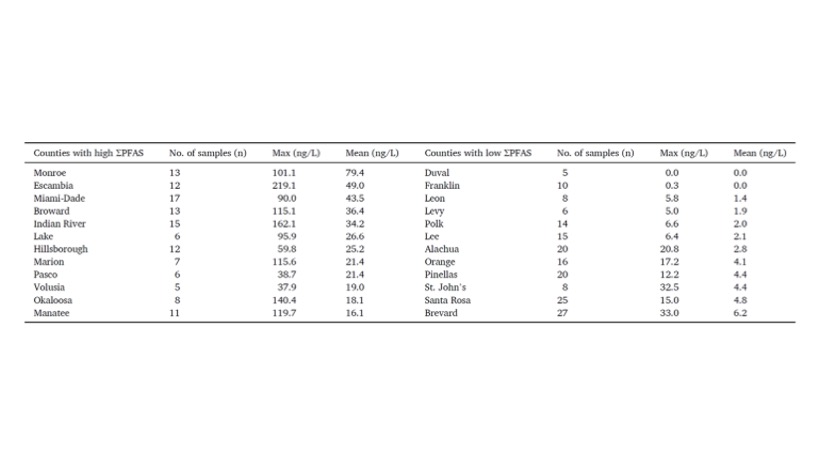
Table 1. Top average 12 Florida counties with highest and lowest total PFAS concentrations (ng/L). Data, figure, and result interpolation from Sinkway et al. 2024.
Okaloosa County had the 11th highest total PFAS (ng/L) concentration among the 67 Florida counties (Click on link for higher resolution–Table 1). Among the eight drinking water samples collected, the maximum PFAS concentration measured was 140 ng/L, and the lowest was 18 mg/L. Okaloosa County had one drinking water sample that exceeded the 4 ng/L standard for PFOA. There were no drinking water samples that exceeded 4 ng/L for PFOS.
Measured PFAS in Florida and Okaloosa County Surface Waters
A team of researchers completed a comprehensive statewide assessment of PFAS in Florida surface waters (Camacho et al. 2024). A network of citizen scientists collected 2,323 surface water samples across the 67 Florida counties. These surface water samples were analyzed for 50 PFAS, with 33 PFAS being detected in at least one surface water sample. The top five most frequently detected PFAS were perfluorooctanoic acid (PFOA) (94% of the samples), perfluorobutane sulfonic acid (PFBS) (65%), perfluorohexanoic acid (PFHxA) (61%), perfluorononanoic acid (PFNA) (54%), and perfluorooctane sulfonate (PFOS) (53%).

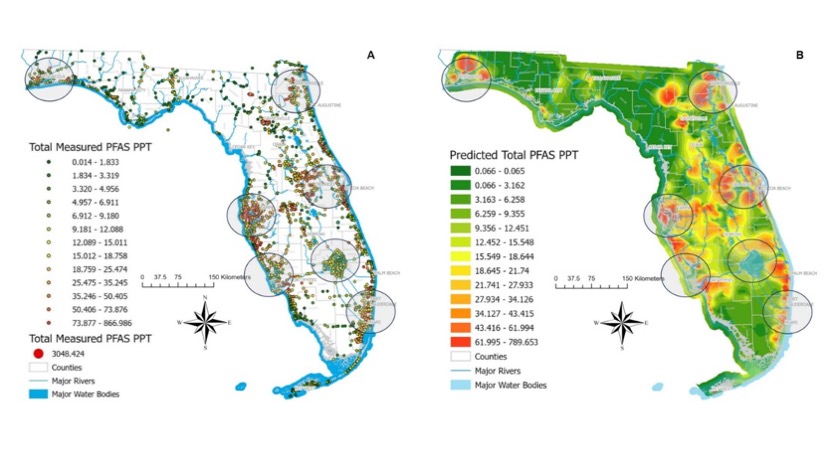
Figure 2. Map A contains all surface water sampled sites with detected PFAS, where the dots’ color represents the total PFAS concentration measured. Map B shows predicted PFAS levels based on measured total PFAS concentrations in surface water samples. Note that these values do not represent predicted PFAS concentrations on land. Data, figure, and result interpolation from Camacho et al. 2024.
There were 915 (39%) surface water samples with PFOA concentrations above 4 ng/L and 920 (40%) samples with PFOS above 4 ng/L (Click on link for higher resolution–Figure 2). All counties had at least one sample with PFOA, 96% had PFNA, 93% had PFBS, 91% had PFOS, and 82% of counties had PFHxA. The average PFAS detected among counties ranged from 2 ng/L of PFNA to 10 ng/L of PFOS. The maximum PFAS detected among counties ranged from 81 ng/L of PFOA to 1135 ng/L of PFOS. Figure 2
Okaloosa County ranked 27th among Florida counties due to 10 (20%) surface water samples with PFOA above 4 ng/L. Okaloosa County ranked 9th for the number of samples (38 total samples or 78% of the samples) above 4 ng/L for PFOS. A total of 49 surface water samples were collected in Okaloosa County. The average total PFAS concentration detected in a surface water sample was 31 ng/L, while the maximum total PFAS concentration detected in a sample was 185 ng/L.
Dr. Bowden, with the University of Florida’s College of Veterinary Medicine and Chemistry Department, led the PFAS research shared here. Dr. Bowden has extensive information on the Bowden Lab website (https://www.bowdenlaboratory.com/dr-bowden.html), including an interactive map of all the PFAS surface water samples collected in Florida. Select Okaloosa County under the filter section to see the surface water samples and learn more about the PFAS information for each sample collected in Okaloosa County (https://www.bowdenlaboratory.com/florida-surface-water.html).Figure 2 Table 1
What does this mean for Okaloosa County?
PFAS have been detected in drinking water and surface waters in Okaloosa County. Although not the highest concentrations or most frequent identified in Florida, there were drinking and surface water samples above USEPA’s 4 ng/L contaminant level standard. Understanding what PFAS are and joining in educational conversations about PFAS helps our community. Efforts that support continued sampling and extended monitoring also increase our understanding of PFAS concentrations in Okaloosa County’s drinking and surface waters. If you want to learn more about PFAS or join community scientists’ efforts to expand PFAS water monitoring, please contact Dana Stephens at the UF/IFAS Okaloosa County Extension Office.
References
Camacho, C.G., et al. 2024. Statewide surveillance and mapping of PFAS in Florida surface waters. American Chemical Society, 4: 434-4355. https://doi.org/10.1021/acsestwater
United States Environmental Protection Agency (USEPA). 2025. Per- and polyfluoroalkyl substances (PFAS) final PFAS national primary drinking water regulation. https://www.epa.gov/sdwa/and-polyfluoroalkyl-substances-pfas
McMahon, P.B., Tokranov, A.K., and Bexfield, L.M. 2022. Perfluoroalkyl and polyfluoroalkyl substances in groundwater used as a source of drinking water in the Eastern United States. Environmental Science and Technology 56(4): 2279-2288. https://doi.org/10.1021/acs.est.1c04795
Skinkway, T.D., et al. 2024. Crowdsourcing citizens for statewide mapping of per- and polyfluoroalkyl substances (PFAS) in Florida drinking water. Science of the Total Environment, 926: 1-9. https://doi.org/10.1016/j.scitotenv.2024.171932
by Laura Tiu | Jun 6, 2025
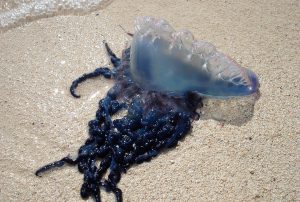
The colonial Portuguese man-of-war.
Photo: NOAA
I love summer; going to the beach, snorkeling, kayaking and grilling in the backyard. But summer comes with its own share of challenges. One of my least favorite summer guests is bugs. The list of bugs I dislike is long, but I’d like to focus on a few that like to torment us all.
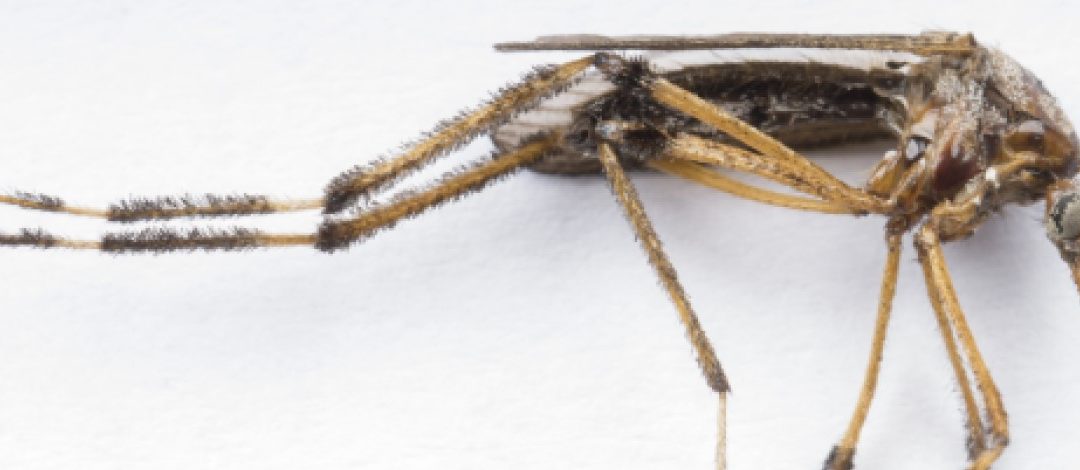
Mosquitos are one of summer’s bad actors. Mosquito lay their eggs and their larvae mature in both manmade and natural water-holding containers such as bird baths, plants, bucket, used tire and holes in trees. Some mosquitos just bite while others carry disease. The easiest way to get rid of mosquitos is to get rid of any water-holding containers in the area.
Ants, in particular fire ants, are another unwelcome summer arrival. This invasive species is aggressive, and their painful stings can injure both humans and animals. Fire ant nests look like large mounds of dirt and typically have multiple openings. You must kill the queen to completely eliminate a colony. Even if the queen is killed, surviving ants may inhabit the mound or make a new mound until they die off. Some treatments that may work to get rid of these pests include baits, pesticides and boiling water.
Many biting flies, yellow flies are my least favorite, persistently attack man and animals to obtain a blood meal. Like mosquitoes, it is the female fly that is responsible for inflicting a bite. These biting flies like shady areas under bushes and trees and wait for their victim to pass by. They typically attack during daylight hours, a few hours after sunrise and two hours before sunset. Currently there are no adequate means for managing populations. Traps are sometimes effective in small areas such as yards, camping sites, and swimming pools.
In the water, jellyfish are the most common summer pest. While not bugs, their reputation for stinging people puts them in a similar category with the above-mentioned pests. Sea lice, actually the larval form of the thimble jellyfish, is a common near shore pest, while Portuguese Man-O-War and the box jellyfish can give a very painful sting. Another type, comb jellies, are not true jellyfish and do not sting. I you get stung, rinse the sting site with large amounts of household vinegar, or jelly-fish-free ocean water, for at least 30 seconds. Do not rub sand or apply any pressure to the area or scrape the sting site.
The University of Florida – IFAS has several good publications with information about these pests and more detail on how to manage them. Check out these publications if you, like me, have had your fill of summer pests.
Florida Container Mosquitos: https://edis.ifas.ufl.edu/publication/IN1315
Ant Control – https://sfyl.ifas.ufl.edu/lawn-and-garden/sustainable-fire-ant-control/
Yellow Flies – https://edis.ifas.ufl.edu/publication/IN595
Jellyfish – http://nwdistrict.ifas.ufl.edu/nat/tag/jellyfish/
by Rick O'Connor | May 12, 2025
When I began working with terrapins 20 years ago, very few people in the Florida panhandle knew what they were – unless they had moved here from the Mid-Atlantic states. Since we initiated the Panhandle Terrapin Project in 2005 many more now have heard of this brackish water turtle.
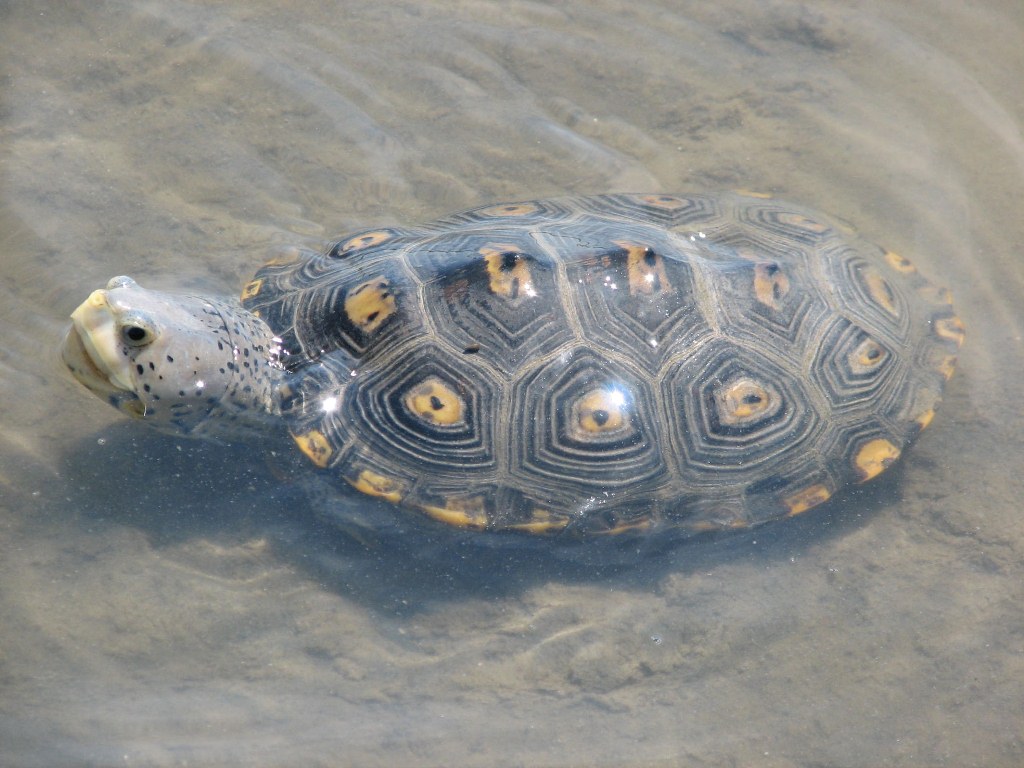
Ornate Diamondback Terrapin (photo: Dr. John Himes)
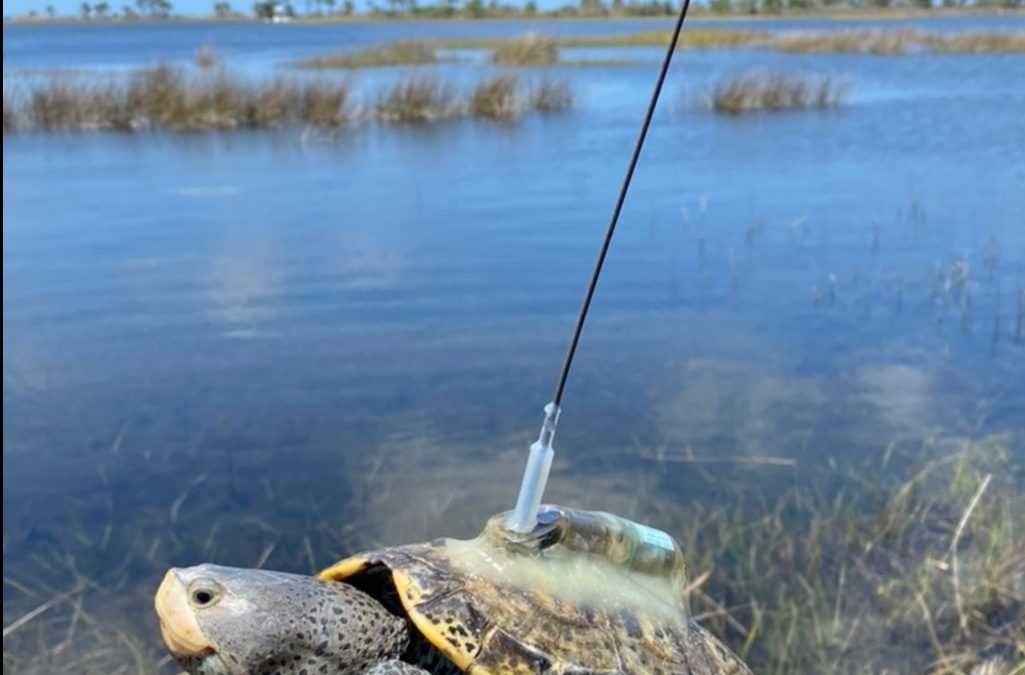
Diamondback terrapins are relatively small (10 inch) turtles that inhabit brackish environments such as salt marshes along our bays, bayous, and lagoons. They have light colored skin, often white, and raised concentric rings on the scales of their shells which give them a “diamond-backed” appearance. Some of them have dark shells, others will have orange spots on their shells.
The first objective for the project was to determine whether terrapins existed here, there was no scientific literature that suggested they did. We found our first terrapin in 2007, and this was in Santa Rosa County. We have since had at least one verified record in every panhandle county – diamondback terrapins do exist here.
The second objective was to locate their nesting beaches. Terrapins live in coastal wetlands but need high-dry sandy beaches to lay their eggs. Volunteers began searching for such and have been able to locate nesting beaches in Escambia, Santa Rosa, Okaloosa, Bay, and Gulf counties. We continue to search in the other counties, and for additional ones in the counties mentioned above. Once a nesting beach has been identified, volunteers conduct weekly nesting surveys, providing data which can help calculate the relative abundance of terrapins in the area.
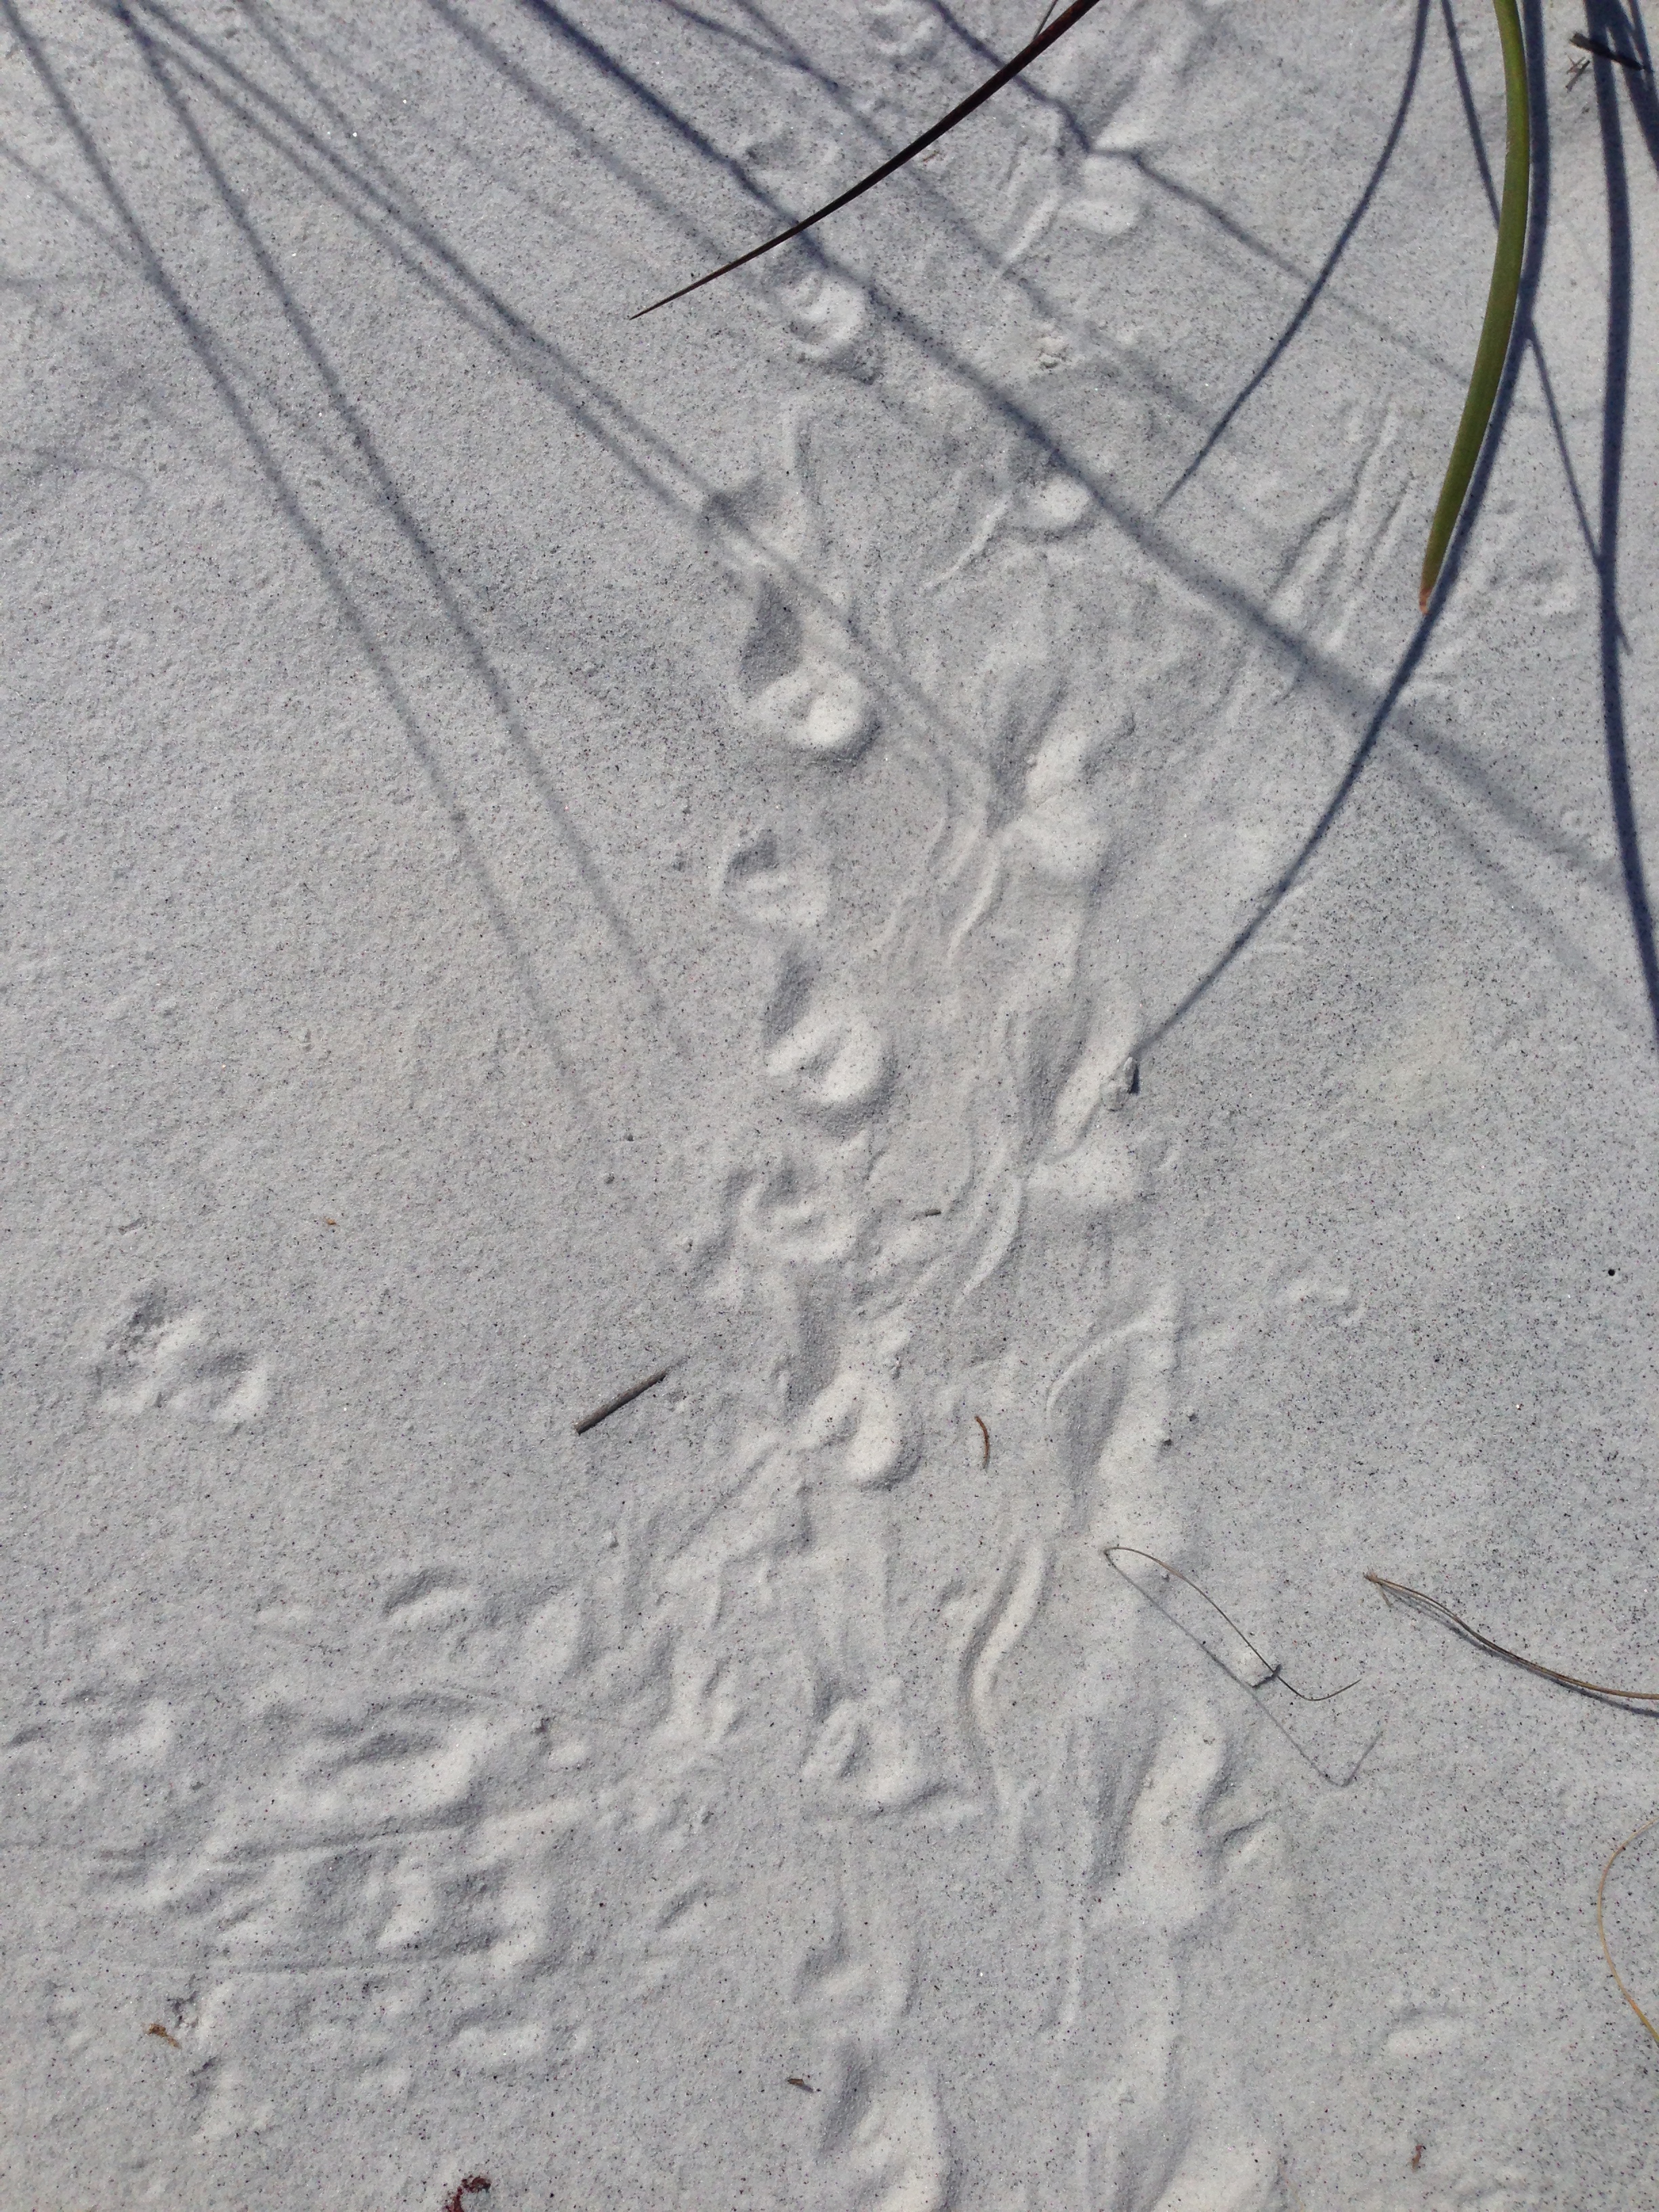
Tracks of a diamondback terrapin.
Photo: Terry Taylor
The third objective is to tag captured terrapins to determine their population, where they move and how they use habitat. We initially captured terrapins using modified traps and marking them using a file notching system. We then partnered with a research team from the U.S. Geological Survey and now include passive integrated transponder tags (PIT tags) that help identify individuals, satellite tags that can be detected from satellites and track their movements, and recently acoustic tags which can also track movement.
The fourth objective is to collect tissue samples for genetic studies. This information will be used to help determine which subspecies of terrapins are living in the Florida panhandle.
As we move into the summer season, more people will be recreating in our bays and coastal waterways. If you happen to see a terrapin, or maybe small turtle tracks on the beach, we would like you to contact us and let us know. You can contact me at roc1@ufl.edu. Terrapins are protected in Florida and Alabama, so you are not allowed to keep them. If you are interested in joining our volunteer team, contact me at the email address provided.
by Dana Stephens | Apr 11, 2025
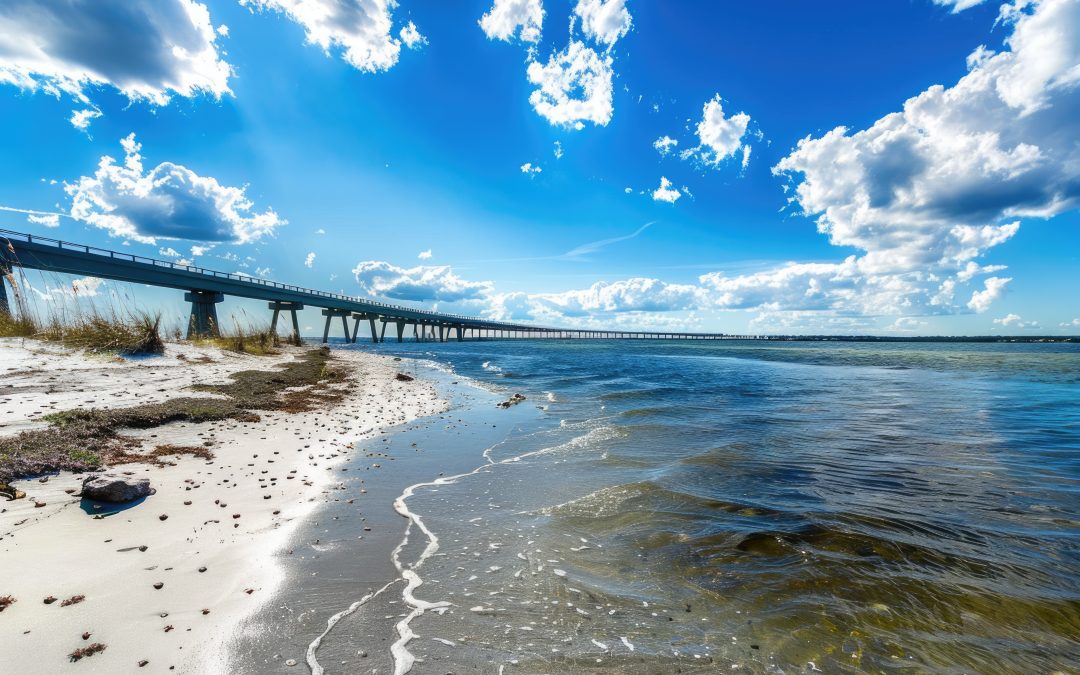
Okaloosa Waterwatch is an opportunity to explore water quality data in selected locations spanning the Okaloosa County portion of the Choctawhatchee Bay.
A site is selected each month, and available water quality data are summarized and explained. The purpose is to understand water quality and the condition of our waters. Thanks to the Choctawhatchee Basin Alliance (CBA), water quality data has been collected frequently (monthly) for many years.
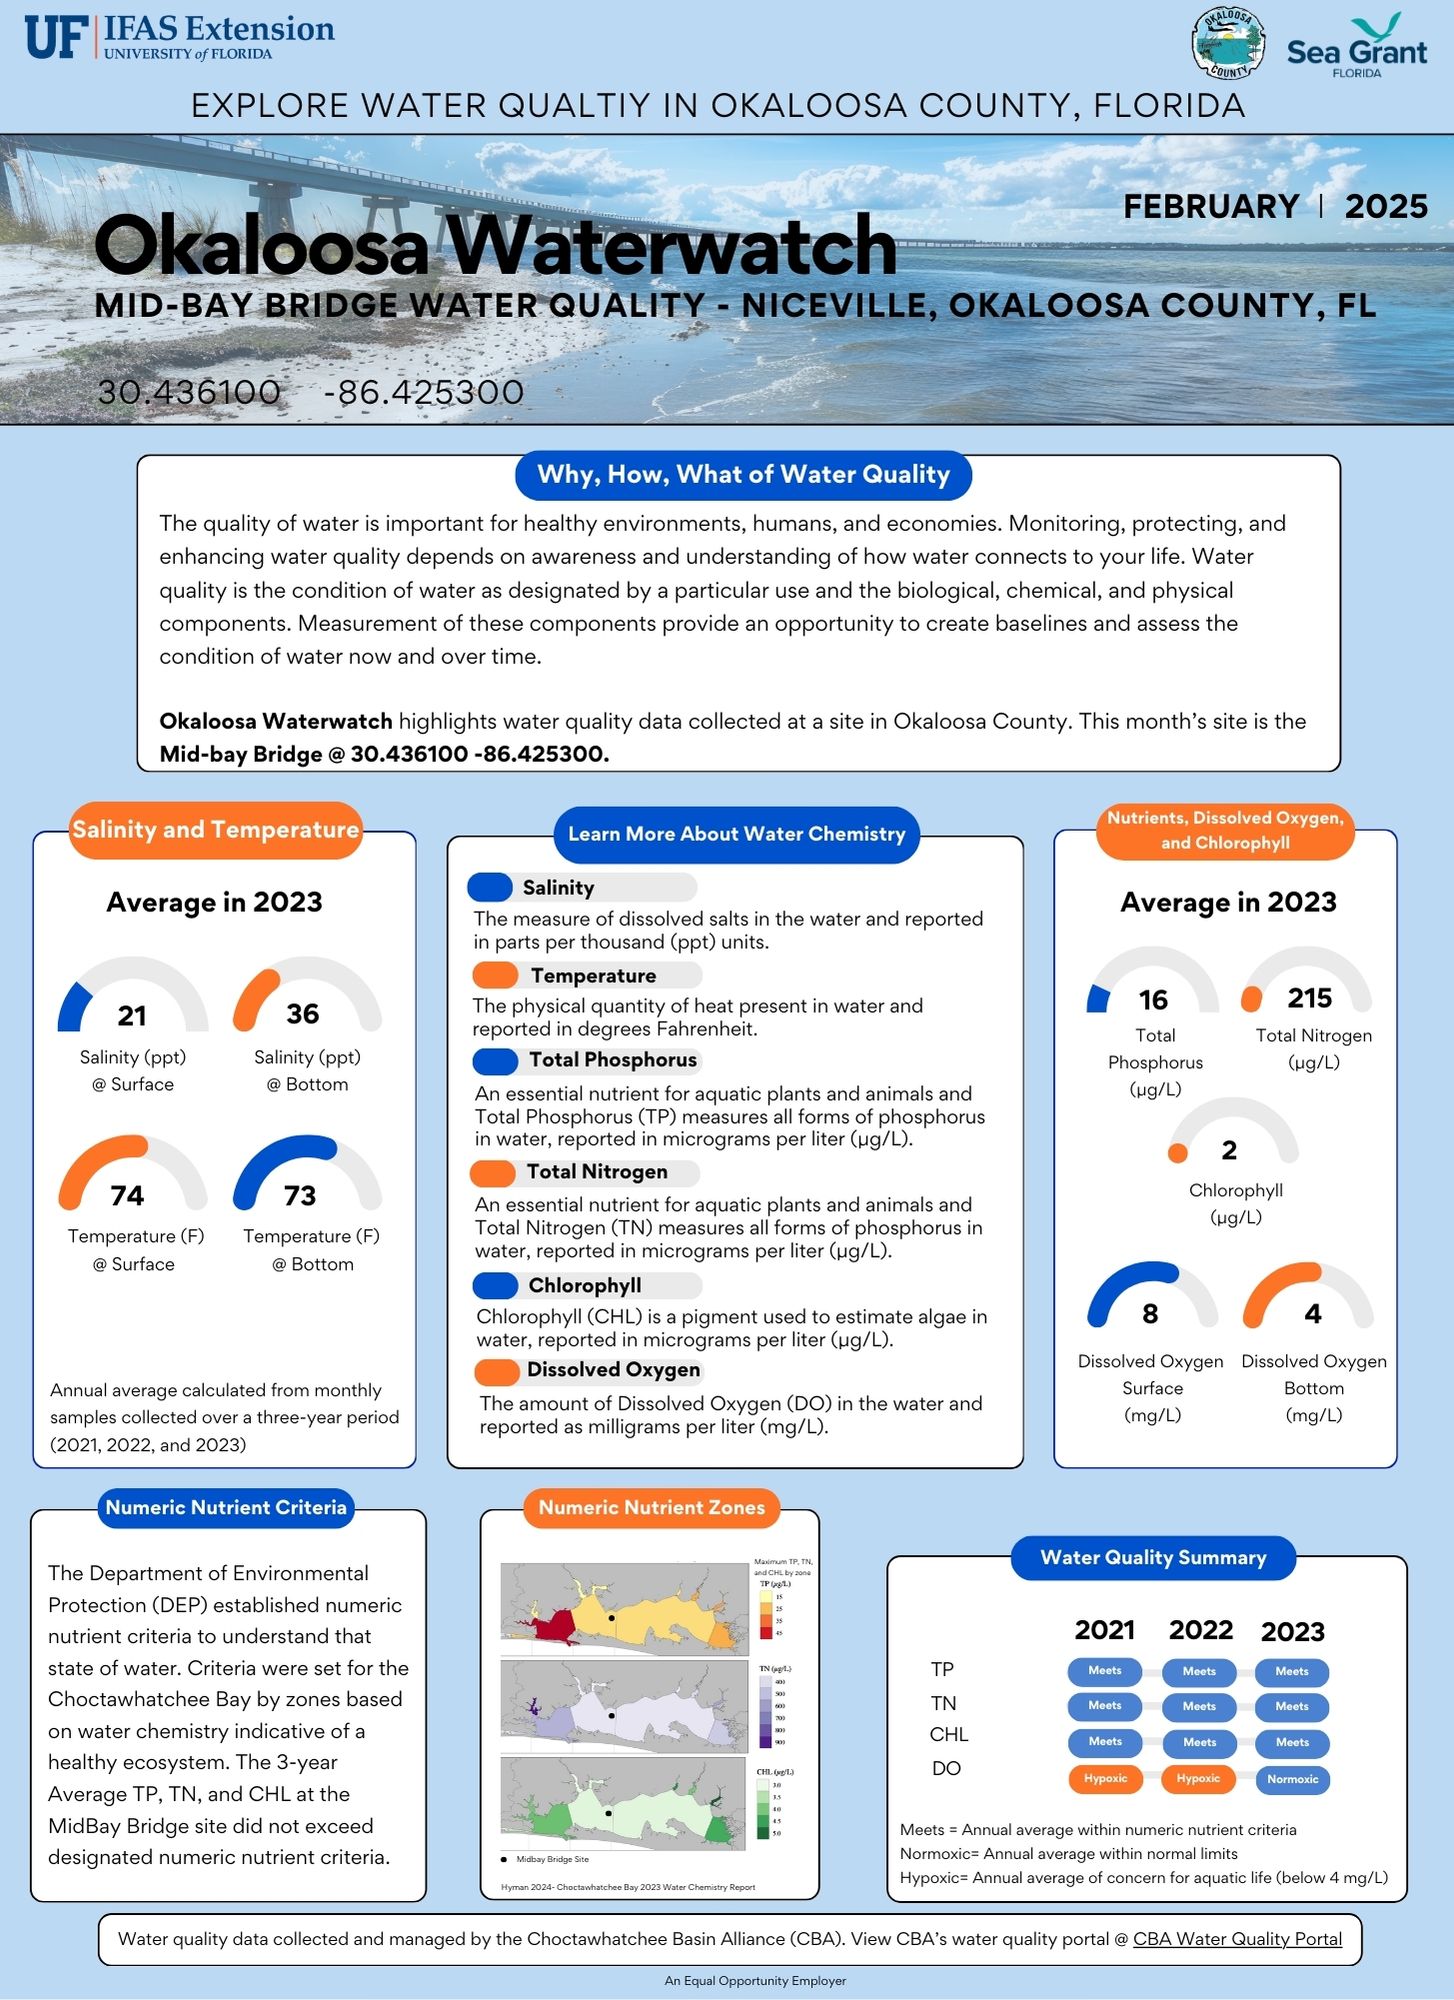
Below are the February and March Okaloosa Waterwatch water quality summaries. February highlights the mid-bay bridge (Niceville) location, and March highlights the entrance to Rocky Bayou (Niceville) location.
Check out the Okalooas Waterwatch YouTube channel for a personalized audio review of the water quality summaries. The YouTube channel is Okaloosa Waterwatch (@OkaloosaWaterwatch) or navigate directly using this link: https://www.youtube.com/channel/UCGPVMsyMiTU5BT9xyrFhuYQ
Please contact Dana Stephens, UF/IFAS Okaloosa County Sea Grant Extension Agent, for more information or to learn more about water quality in Okaloosa County. Email is dlbigham@ufl.edu and office phone is 850-689-5850.
Okaloosa Waterwatch February 2025 (PDF Link)
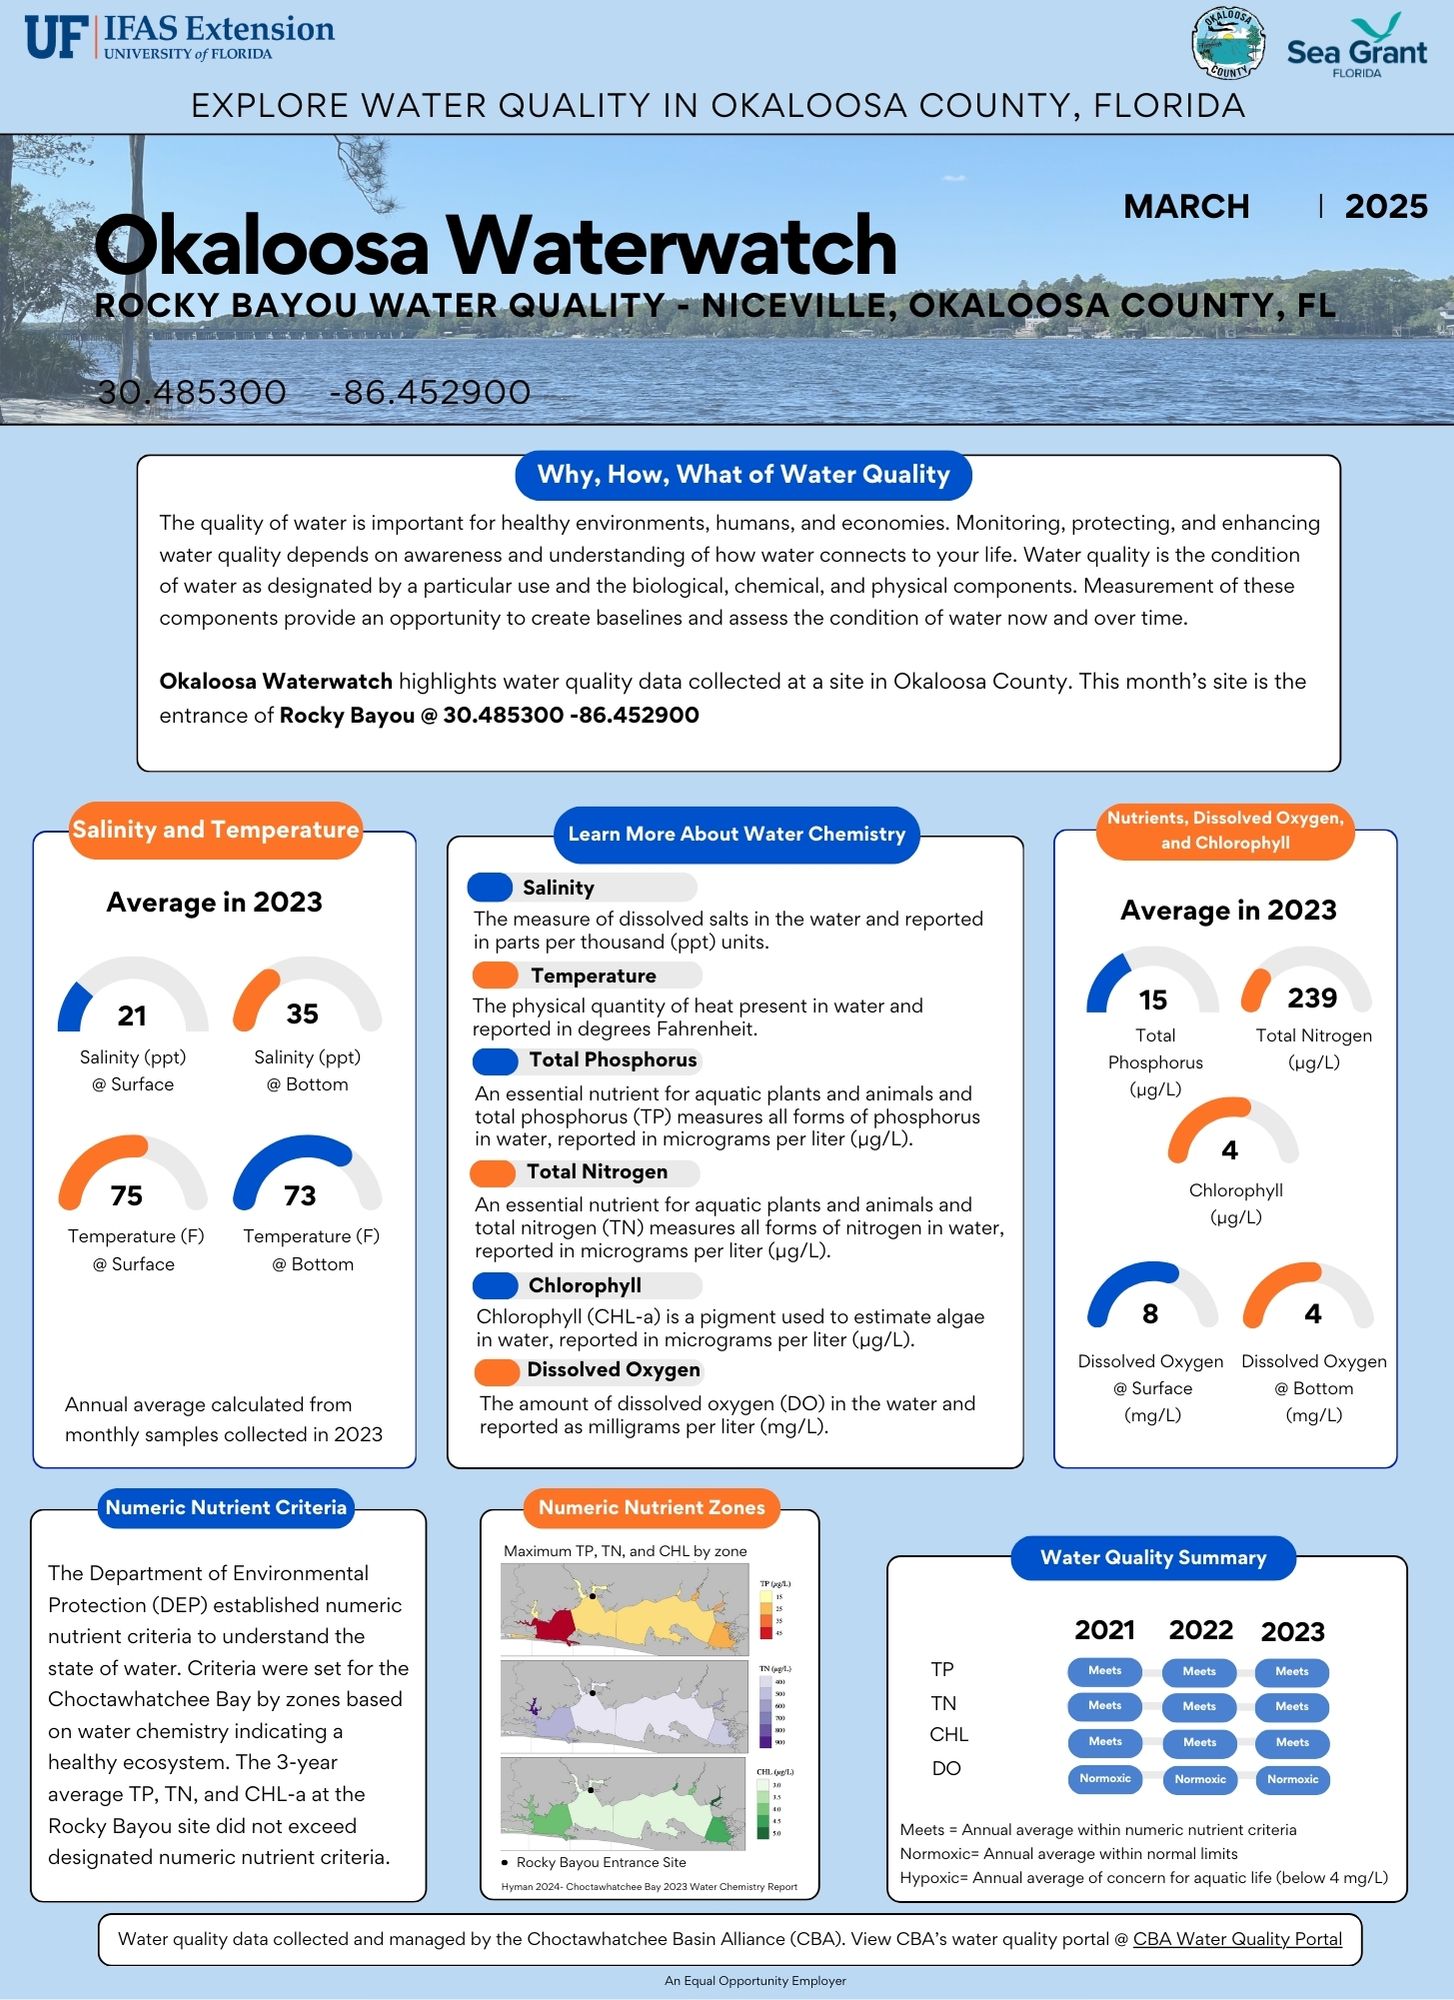
Okaloosa Waterwatch March 2025 (PDF Link)
by Laura Tiu | Mar 7, 2025
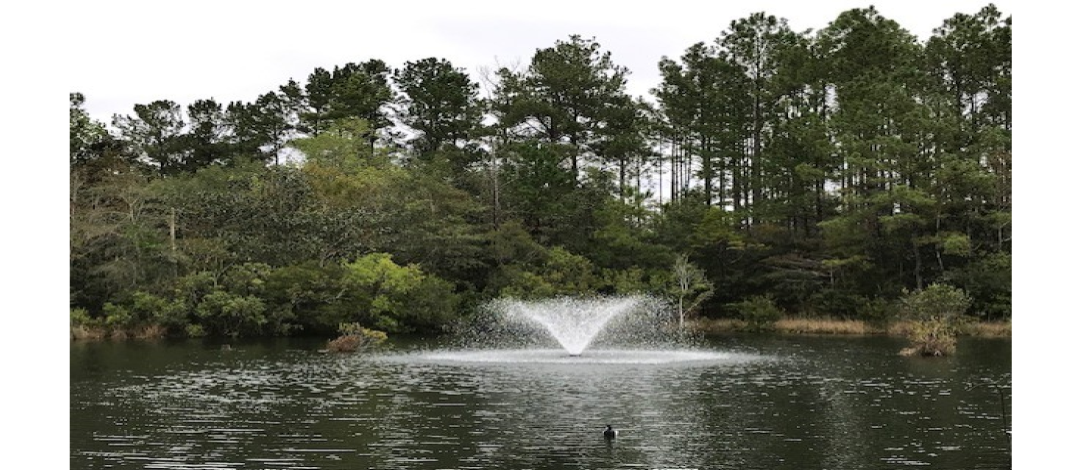
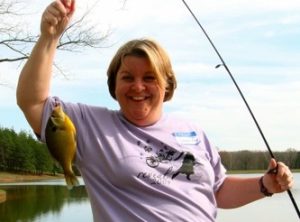 As spring approaches, I’ve been receiving more calls from local pond owners looking for advice on preparing their farm ponds for the season. Managing a pond in the Florida Panhandle can be tricky—especially when dealing with spring-fed ponds. While these ponds are often beautifully clear, their constant water turnover makes management a challenge.
If you’re wondering how to get your pond ready for spring, here are some key considerations and resources to help guide you.
Start with a Water Quality Test
The first step in assessing your pond’s health is testing the water. I always recommend that pond owners bring a pint-sized water sample in a clean jar to their local Extension Office for analysis. Keep in mind that not all offices offer this service, and public testing options are limited. However, private labs and DIY testing kits are available—though they can be costly.
The most important parameters to check are pH, alkalinity, and hardness: pH should ideally range between 6 and 9 for a healthy fish population. Local ponds often hover around 6.5, making them slightly acidic.
Alkalinity and hardness measure the water’s ability to neutralize acids and buffer against sudden pH changes. For optimal pond health, alkalinity should be at least 20 mg/L, but many local ponds fall below this level.
Improving Pond Water Quality
If your pond’s water quality is less than ideal, there are two common ways to improve it: liming and fertilization.
Applying Agricultural Lime: Properly adding agricultural lime can raise alkalinity and stabilize pH levels. However, in high-flow ponds, lime tends to wash away quickly, making this method ineffective for ponds with constant discharge.
Fertilizing to Boost Productivity: Fertilization increases phytoplankton growth, which supports the pond’s entire food web, benefiting juvenile fish and invertebrates. Unfortunately, like lime, fertilizer is quickly washed out of high-flow ponds, making it ineffective in these cases.
Making the Best of Your Pond
If your pond has a continuous discharge due to spring flow, the best approach may be to embrace its natural clarity, even if it doesn’t support a thriving fish population. However, if your pond retains water without frequent outflow, you may be able to enhance its productivity with the right amendments.
For personalized guidance, contact your local UF/IFAS Extension Office. You can also start by reviewing this helpful fact sheet: Managing Florida Ponds for Fishing. By understanding your pond’s unique characteristics, you can make informed decisions to keep it healthy and enjoyable throughout the season.
by Daniel J. Leonard | Jan 17, 2025
Over the last 10 years or so, the Florida Panhandle has gotten used to relatively warm winters, at least historically speaking. While we have experienced sharp cold snaps that were devastating to unprepared landscapes and gardens (the most recent being the late December dip down into the low to mid-teens in 2022), they haven’t lasted long and, overall, winters have been mild. Anecdotally, it seems like this winter (2024-2025) has been a return to a historical norm, with extended periods of cloudy, dreary cold; but does the data support that feeling? Let’s find out.
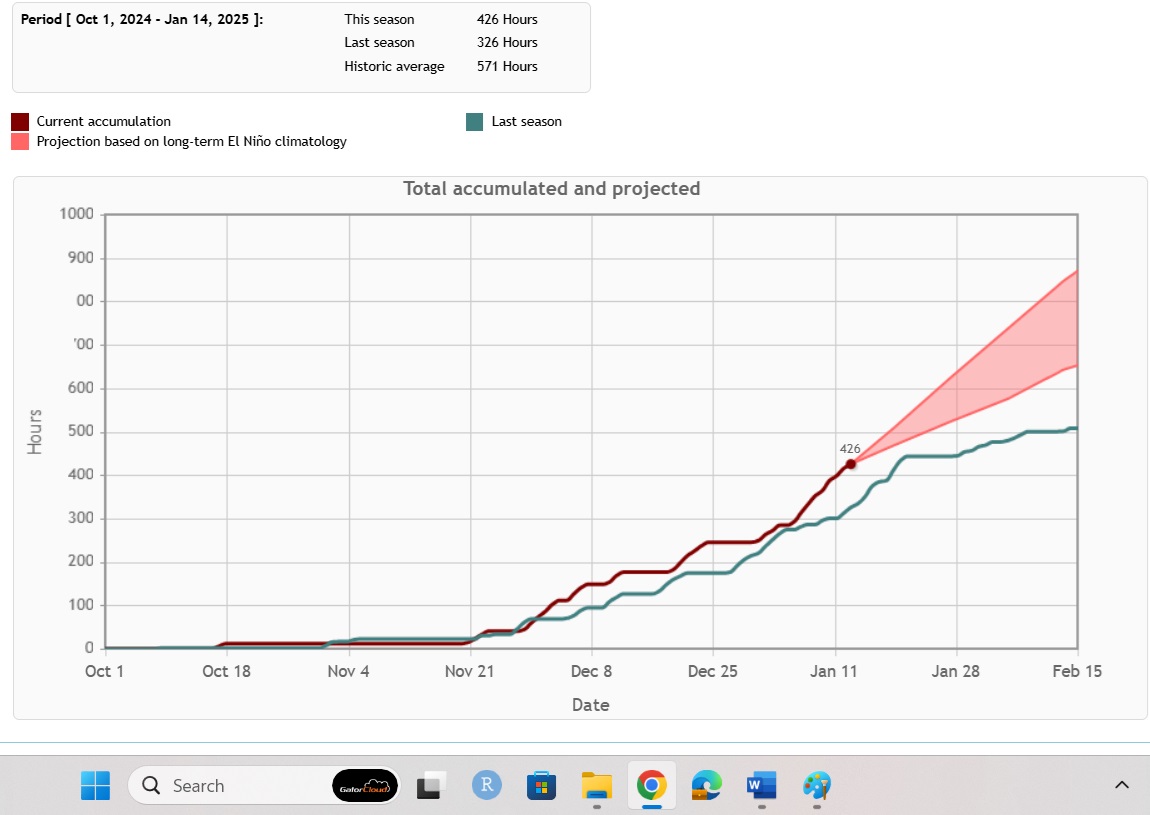
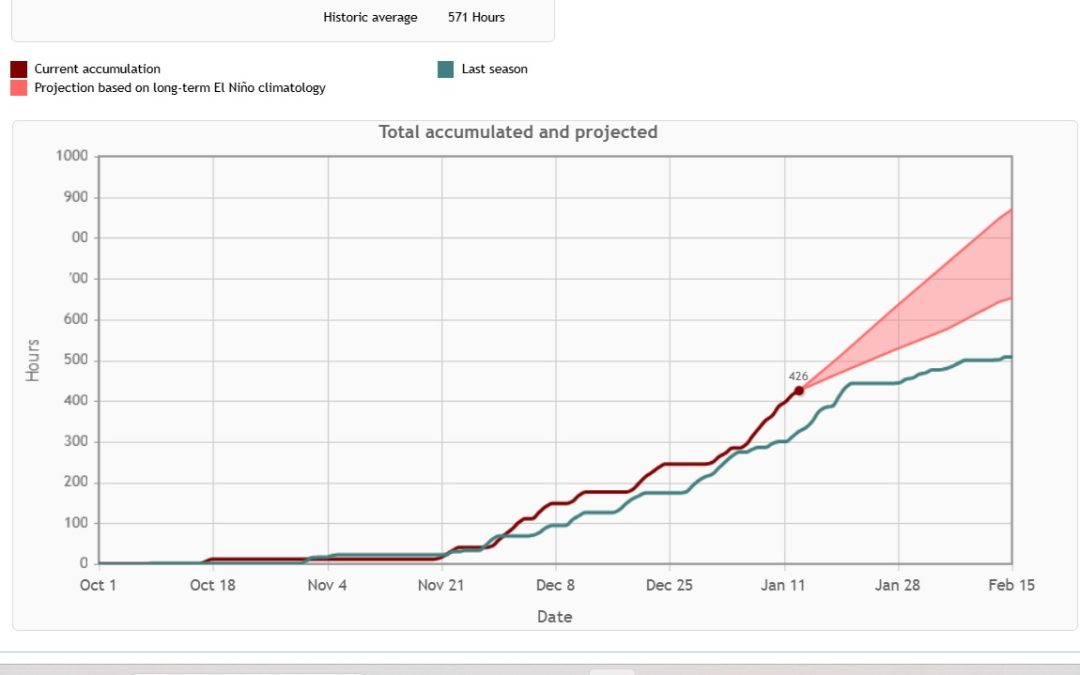
There are several ways of measuring the relative cold of one winter to the next. You could use weather station data and see what the coldest temperatures a given year received. You could track how many days the mercury dipped below freezing. You could measure the maximum temperatures and compare those year to year. However, for gardeners, commercial crop growers, and most other people, I think the most useful and intuitive comparison of winter intensity from year to year is chill hours.
A chill hour is loosely defined as an hour below 45 degrees. Chill hours play a big role in deciduous fruiting plants flowering cycle and ultimately help determine if those plants make fruit the following year or not. While that is important to fruit growers, in this article, we’re more concerned with using chill as a relative comparison of winter intensity year to year. Last winter, the Florida Automated Weather Network (FAWN) station in Marianna (the closest one to Calhoun County that observes chill hours) logged 326 hours from the period of October 1 to January 14. This winter, that same weather station has logged 426 hours in the same period of time. A little elementary school math tell us we’ve received 100 more chill hours *so far* this year than we received last year – the equivalent of four entire 24 hour days under 45 degrees! That’s pretty significant. However, the historical average over the same time period is 571 chill hours, so we are still lagging behind what the area “used” to receive.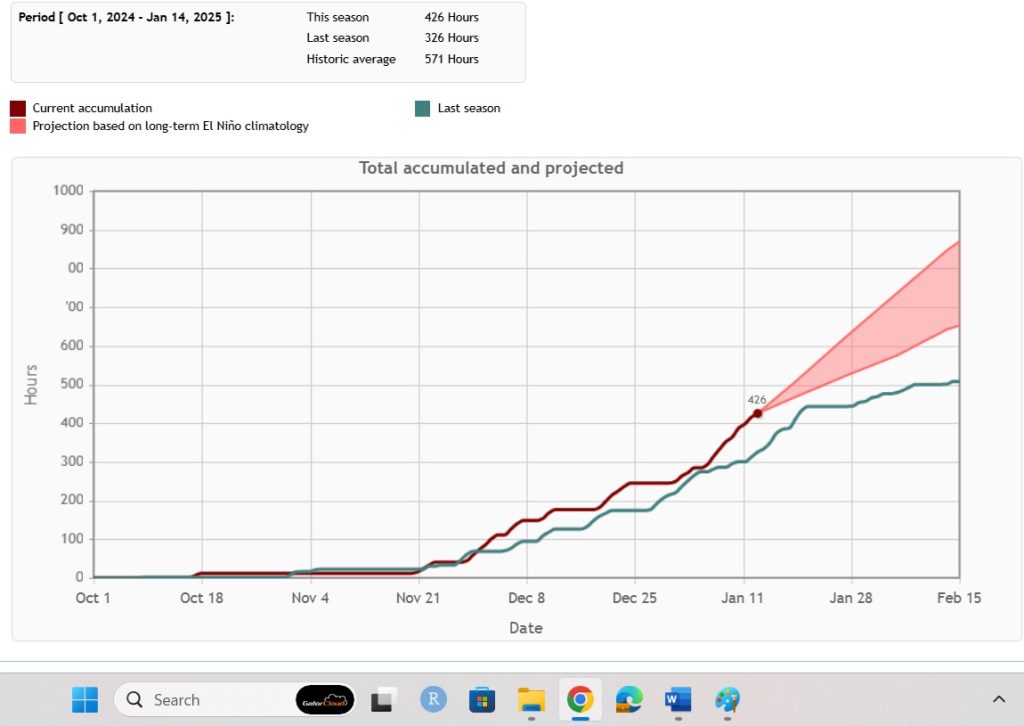
So yes, this winter has been colder than last at the time of this writing (January 16) and that isn’t even considering the extreme cold forecast for next week (week of January 20th) when you’re likely to be reading this. Things have been cold and are likely to remain that way for at least the rest of January, maybe beyond into February. However, it is important to remember that this year isn’t an outlier historically, as even this spat of recent cold finds us lagging our historical cold temperature norms a bit.
To track chill hours yourself, visit this website. For more information on our local natural resources and climate, contact your local Extension office. Bundle up out there an enjoy the coldest winter in several years!