by Rick O'Connor | Jul 19, 2025
We stated in the last article that we have plenty of water on our planet; we just do not manage it well. So, what are some ways to do this? Below we will review some ideas provided by Miller and Spoolman back in 2011 and we will add a few more.
Is Extracting More Groundwater the Answer?
Groundwater that is used to supply cities and grow food is being pumped from aquifers in some areas faster than it is renewed by precipitation. Some advantages of this method include the water is useful for drinking and irrigation, its available year-round, and there is no evaporation loss. The disadvantages include it is being depleted, sinking of land (subsidence) occurs from over pumping, some aquifers have been polluted by deep well injection of waste. The largest aquifer in the world is the Ogallala Aquifer found beneath South Dakota, Wyoming, Nebraska, Colorado, Kansas, New Mexico, Oklahoma, and Texas. It is showing signs of severe overdraft particularly near Texas and New Mexico. Methods of managing this water source would include wasting less water, restricting the number of wells allowed, planting crops and landscapes that require less water.
This is a common method used to irrigate crops across the U.S.
Photo: UF IFAS
Is Building More Dams the Answer?
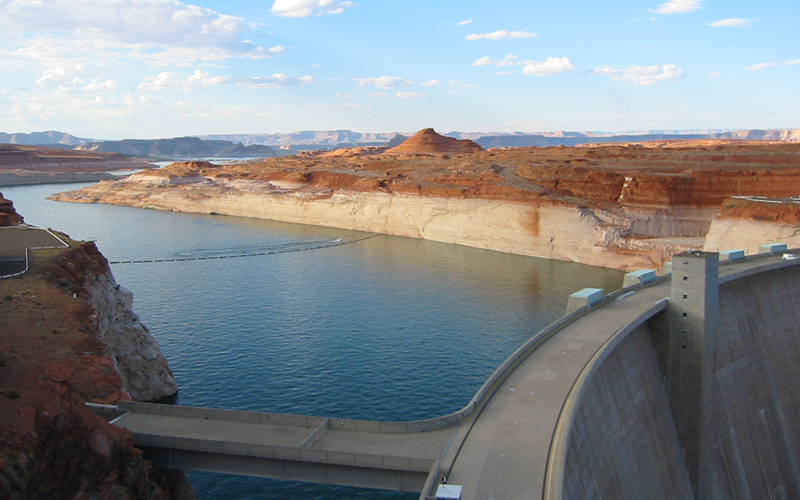
Building dam and reservoir systems has greatly increased water supplies in some areas, but it has disrupted ecosystems (causing other financial losses) and displaced people. Some positive aspects of creating reservoirs are creating a large source of water, recreational uses in these new lakes, and the dams produce low-cost electricity. But the negatives include the new lakes that flood cropland and displace people, evaporation loss of this needed resource is very high, disrupts the migration and spawning of many species of fish (some of which are economically valuable). With some current dam systems, the rivers are running dry downstream, and the lakes are shrinking. We saw this firsthand at the Glen Canyon Dam on the Colorado River in Arizona.
Glen Canyon at the Utah/Arizona border.
Photo: NOAA
Is Transferring Water from One Place to Another the Answer?
Transferring water from one place to another has greatly increased supplies in some areas, but it has also disrupted ecosystems and commercial ventures in others. One place this has been used is the California Water Project – where water from wooded northern California has been piped to the deserts of southern California. For decades battles have been fought as to how much of this water should be sent south. Southern California uses this water in large agriculture projects and for large cities like Los Angeles and San Diego. 75% of this water is used in agriculture – but often for water thirsty crops like rice and alfalfa being grown in desert conditions. Northern California contends that these water transfers reduce the ability to flush pollutants from San Fransico Bay and has reduced important fisheries. They argue that southern California could help by using better irrigation methods and crop selection. Several studies suggest that climate change will reduce the amount of water currently available in this system and they are already over pumping their ground water. In 2011 China was planning a similar project moving water from southern part of the country to the north. But will this solve our water management problems?
Is Desalination of Seawater the Answer?
There is certainly plenty of seawater – and we know how to convert seawater to freshwater – but the cost is high, and the resulting salty brine must be disposed of without harming aquatic or terrestrial ecosystems. In 2004 there were about 15,000 desalination plants around the world – that number has not increased much over the last 20 years. Most were in the Middle East. Saudi Arabia had the largest number, followed by the U.S. Almost 50% of Isarel’s water was produced from desalination. In addition to high cost and issues with what to do with the brine produced, there is the problem of adding chemicals to this water as it is being piped to reduce algae. This chemical treatment has been shown to cause severe problems for natural ecosystems.
So, How Can We Use Water More Sustainably?
We can do so by reducing water waste, raising the price of water, slowing population growth, and protecting our aquifers and habitats that store and release water.
We can reduce irrigation waste by…
- Line irrigation canals
- Irrigate at night to reduce evaporation
- Monitor soil and irrigate only when needed
- Avoid growing water thirsty crops
- Irrigate with treated urban wastewater.
We can reduce water waste by…
- Redesign manufacturing systems so they use less water
- Recycle industrial water
- Landscape our yards with plants that require little or no water
- Use drip irrigation
- Raise water prices
- Use water saving toilets, showerheads, and front-loading clothes washers
- Collect and reuse household water for irrigation of nonedible plants.
How Can We Reduce the Threat of Flooding?
We can lessen the threat of flooding by protecting more wetlands and natural vegetation in watersheds and not building in areas subject to frequent flooding. You may have noticed with the recent building trends in the Florida panhandle, this is not being considered – but should.
Other ideas in conserving and reducing problems with water management include green roofs and Florida Friendly Landscaping. You can learn more about how to protect your water resources by visiting your local county extension office.
Reference
Miller, G.T., Spoolman, S.E. 2011. Living in the Environment. Brooks/Cole Cengage Learning. Belmont CA. pp. 674.
by Rick O'Connor | Jul 7, 2025
I read a story about a group of fishermen from Central America who went to sea one day only to have their boat brake down. As they drifted in the current, they immediately went into survival mode rationing the food they had. As their food reserves became low, they would supplement with catching fish – they were fishermen. At one point they ran out of cooking fuel and so began to dismantle parts of the wooden vessel to burn for cooking. There was a point where there was no food for the day. They would go for several days without food, catching fish when they could, seabirds when they landed on the boat, and the occasional sea turtle would hold them for a while. Though they may not have been in shape to play tennis – they were alive and hoping to cross paths with an ocean tanker.
Then they drifted out of the rain belt. They had been collecting rainwater all this time but had entered a portion of the ocean where it did not rain. This changed everything. Though they could go a month without food – one source indicates you can go up to 50 days, and some up to 70 days – you can only go three days without water. The fishermen seemed to understand this. Within a couple of days, they all laid on the bow of the boat awaiting death – they knew this was the end. As luck would have it, a ship did come by and rescued all five. But it shows us the importance of water. Though we sometimes debate which resources are truly needed by humans, we must have water.

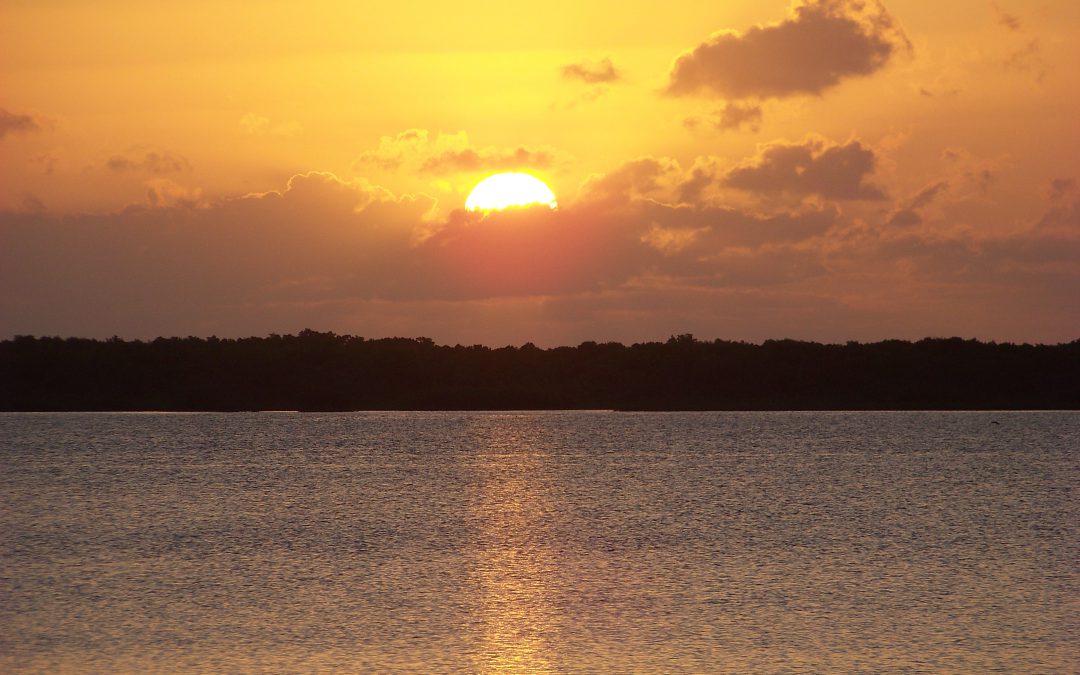
The Gulf of Mexico as seen from Pensacola Beach.
Photo: Molly O’Connor
Lucky for us we live on a planet whose surface is covered with it. Jacques Cousteau once said that the planet should have been called “aqua” for there is so little land in comparison – 70% is covered in water. But, as you know, most of the water within the hydrosphere is salt water, and this will not help. The kidneys make urine from water less salty than seawater. So, if you drink seawater, you will urinate more water than you take in and you will die of dehydration.
Only 3% of the water within the hydrosphere is freshwater and 68.7% of that is frozen in glaciers and ice caps, 31% is found as ground water, and less than 1% is found in rivers, lakes, and streams. Though we live on a planet covered in water, very little of it is in a usable form.
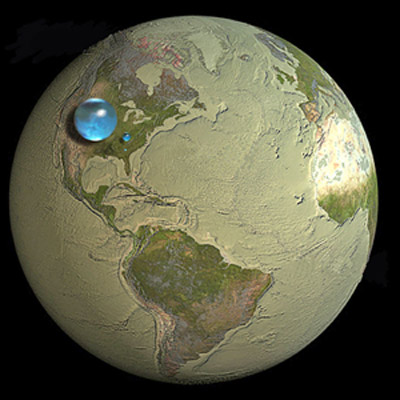
This drop represents the total amount of freshwater on the planet. The smaller drop represents freshwater available for use.
Image: U.S. Geological Survey
Humans get their needed water from ground water (aquifers) and surface water (rivers and lakes) sources. With the growing human population, we are overdrawing from both sources. I saw this firsthand while camping in Arizona. There is a place on Lake Powell called Lone Rock. You can drive to the shoreline and camp at the edge of the lake. The first year we camped there we did just that. We drove to a point where there was a slight drop from our spot to the shore of the lake. We came back to this location two years later – went to the same spot where we had camped before – and it had changed drastically. Now from this spot the slight drop was between 20-30 feet – but not to the shoreline – but rather to a hard sand terrace. This terrace extended about 100 yards toward the lake before it dropped another 20-30 feet to the shoreline. It was amazing. The first year we were there we paddled to Lone Rock (in the middle of the lake). Now you could almost walk to it. A local told me he had lived there for 18 years and had never seen it this low.
Lake Powell is the second largest reservoir in the United States. It was created by placing a damn on the Colorado River to create a water source for the people in that area. The drastic loss of water can be explained in two ways. One – a growing human population in an area with little water to begin with, and an increase withdraw of this resource. Two – reduction in rainfall due to climate change. The American southwest does not get a lot of rainfall to begin with. We explained this natural process in our fourth article in this series – Life on Land. Miller and Spoolman note in 2011 that the American southwest receives an average of 16 inches of rain a year. Despite being an arid area there are several major cities – Las Vegas, Los Angeles, Phoenix – with millions of residents who need water. Add to this the large agriculture operations who need water for their crops. Most of their water needs are met by rivers flowing from the Rocky Mountains heading to the sea. These rivers are damned to create reservoirs and the “water grab” begins. Arguments over who should get this water – farmers, residents, entertainment in Vegas – are common. The Water Wars have begun. The population continues to grow, and climate continues to change.
In the American southeast it is different. We average 48 inches of rain a year. Our area of the northern Gulf coast is even wetter. Most think of Seattle as the area with the highest rainfall in the country but in fact the three wettest cities in the U.S. in order are Mobile AL, Pensacola FL, and New Orleans LA. Pensacola historically gets around 60 inches of rain a year. But between 2010 and 2020 the average here increased to 70 inches. The climate models predict that the dry areas of the country will become drier, and the wet areas will become wetter. This certainly seems to be happening. So, locally, the issues are not drought and loss – but flooding.
The amazing thing about this is that in an area where there seems to be plenty of water, we are seeing water deficits. The large amount of precipitation is not recharging the Floridan aquifer (the source of much of our water) but rather falling on impervious surfaces (roads, parking lots, buildings). This water then causes flooding issues and our answer to this is to drain that rainwater into local surface waters and into the Gulf – not recharging the aquifer. As strange as it sounds – we are hearing about Water Wars even here. It is not that we do not have enough water – it is we do not manage it well.
In the next article we will discuss some suggestions on how we might better manage our very much needed water resources.
References
How Long Can You Go Without Food? Verywell Health. https://www.verywellhealth.com/how-long-live-without-food-1132033#:~:text=How%20long%20human%20beings%20can,someone%20can%20live%20without%20food.
Hospice No Food or Water. Oasis Hospice and Palliative Care. https://oasishospice.us/2022/05/17/hospice-no-food-or-water/.
Can Humans Drink Seawater? National Ocean Service. National Oceanic and Atmospheric Administration. https://oceanservice.noaa.gov/facts/drinksw.html.
Where is the Earth’s Water? GRACE: Tracking Water from Space. American Museum of Natural History. chrome-extension://efaidnbmnnnibpcajpcglclefindmkaj/https://www.amnh.org/content/download/154153/2561707/file/grace-passage-1-student-version.pdf.
Miller, G.T., Spoolman, S.E. 2011. Living in the Environment. Brooks/Cole Cengage Learning. Belmont CA. pp. 674.
by Dana Stephens | May 12, 2025
Spring is a time of change. Spring brings changes in our waters as well. Some of these changes are visible on top of the water and cause concern among water users and viewers. Let’s dispel some of these concerns associated with the spring season.
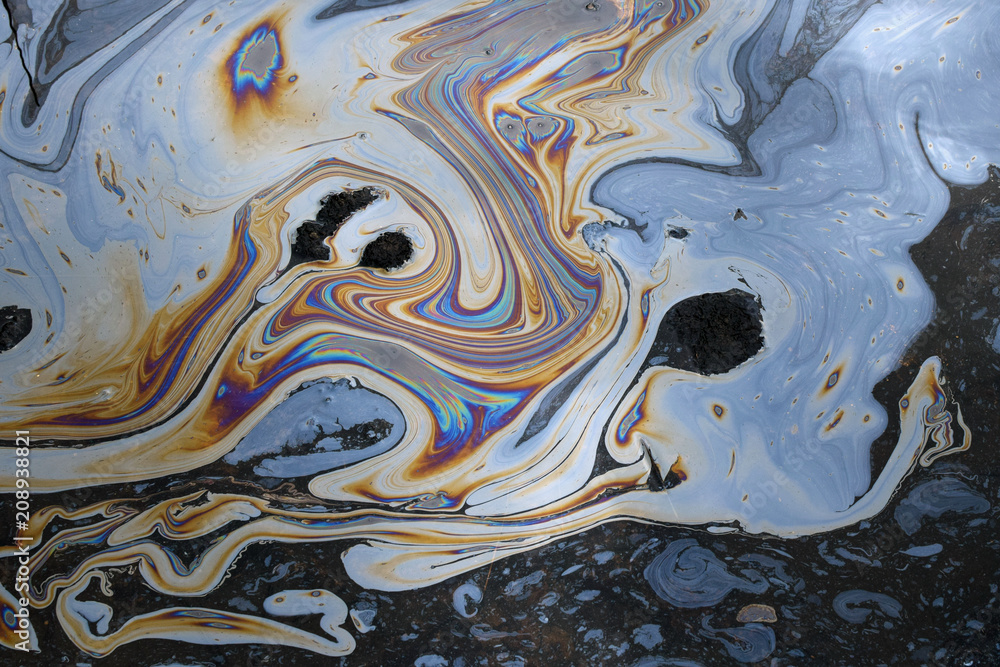
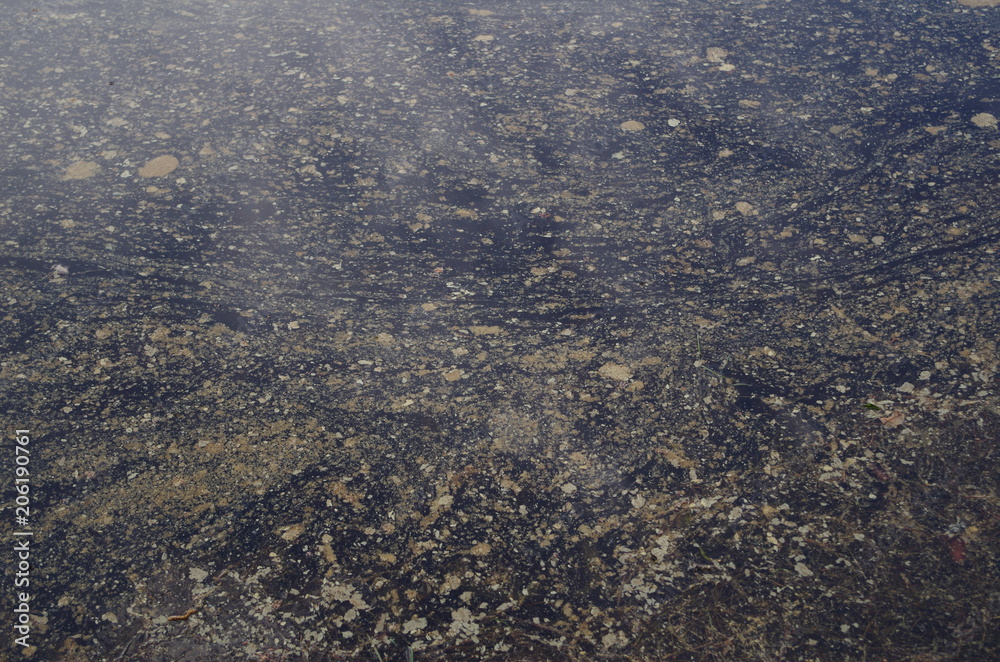
Sometimes, water users and viewers notice what appears to be oil floating on top of the water. Could this be oil? Potentially. Could this not be oil? Most likely. Plants perish, and decomposition occurs, typically during the spring and fall seasons of the year. Much of the decomposition that happens in spring is associated with the initial growth and development of plants. Bacteria living in the soils within and around the water break down the perished plants. These bacteria are decomposing the old plant material. The waste product produced from the bacteria’s decomposition of the old plant material is an oily substance. The oily sheen on the water is a waste product of bacteria. Frequently, the oil accumulates in portions of water where there is little to no water movement. As the decomposition process completes, the oily sheen should lessen over the next few days to weeks. This bacteria-produced oil from decomposition is a natural process.
Petroleum-based oil seen on water is not a natural process. Petroleum-based oil could enter water from various sources, such as but not limited to transportation spills, stormwater runoff, and improper disposal of products containing oil. Like the oily substances produced by bacteria during decomposition, petroleum-based oils will float on top of the water and accumulate where there is little to no water movement.
Here are some tips to identify the difference between oils in water:
|
Bacteria-produced Oil |
Petroleum-based Oil |
| Appearance |
Oily sheen on top of water with little to no difference in color throughout |
Oily sheen on top of water with differences in color throughout (may even appear like a rainbow) |
| Touch
(use a stick) |
When disturbed, the sheen breaks away easily with irregular patterns and does not reform. The oil will not adhere to the stick. |
When disturbed, the sheen swirls, elongates, and does reform. The oil may adhere to the stick. |
| Odor
(not always present) |
Strong organic, musty, or earthy smell. |
Volatile organic compounds (VOCs) smelling like gasoline or diesel fuel. |
Another sheen on our waters that is frequent during Florida’s springtime is pollen. Pine, tree, and weed pollen accumulate on top of water, especially in areas with little or no water movement. If the sheen on the water is yellow, orange, or sometimes white, this is most likely due to pollen. Think about how pollen shows on a car in Florida during spring…our waters can show the same to some extent.
Let’s give it a try! See if you can identify the sheens in water in each photo—answers at the bottom of the page.
Photo 1

Photo 2

Photo 3
Photo 4
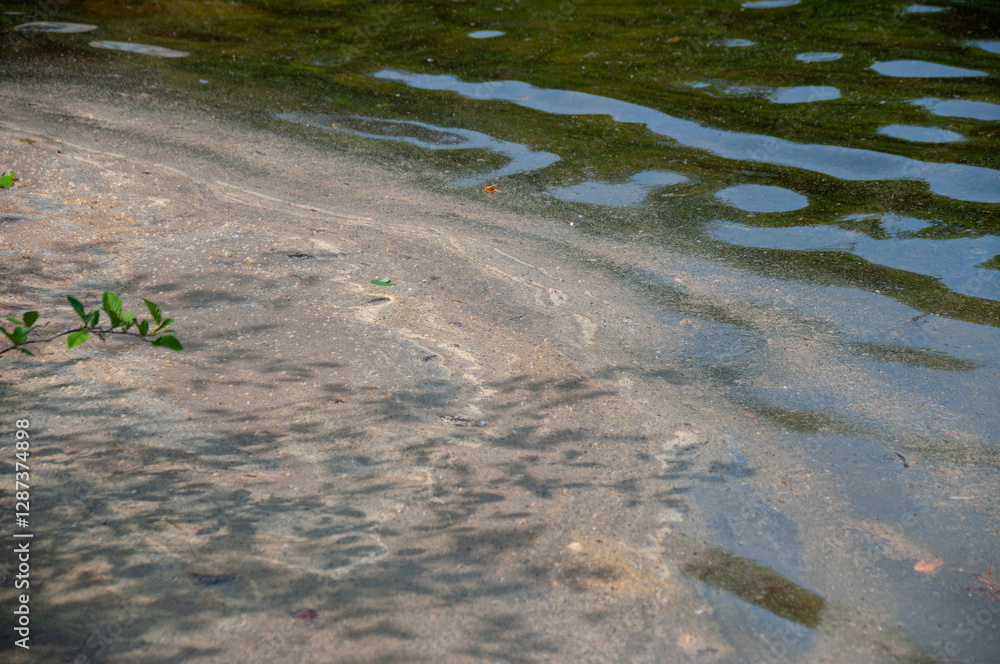
Photo 5

Photo 6
Keep Scrolling For Answers!
.
.
.
.
.
.
PHOTO ANSWERS: Photo 1: Bacteria-produced oil sheen. Photo 2: Pollen sheen. Photo 3: Petroleum-based oil sheen. Photo 4: Pollen sheen. Photo 5: Petroleum-based oil sheen. Photo 6: Mixture of bacteria-produced oil and pollen sheen. Note all photos were obtained from Adobe Stock Photos.
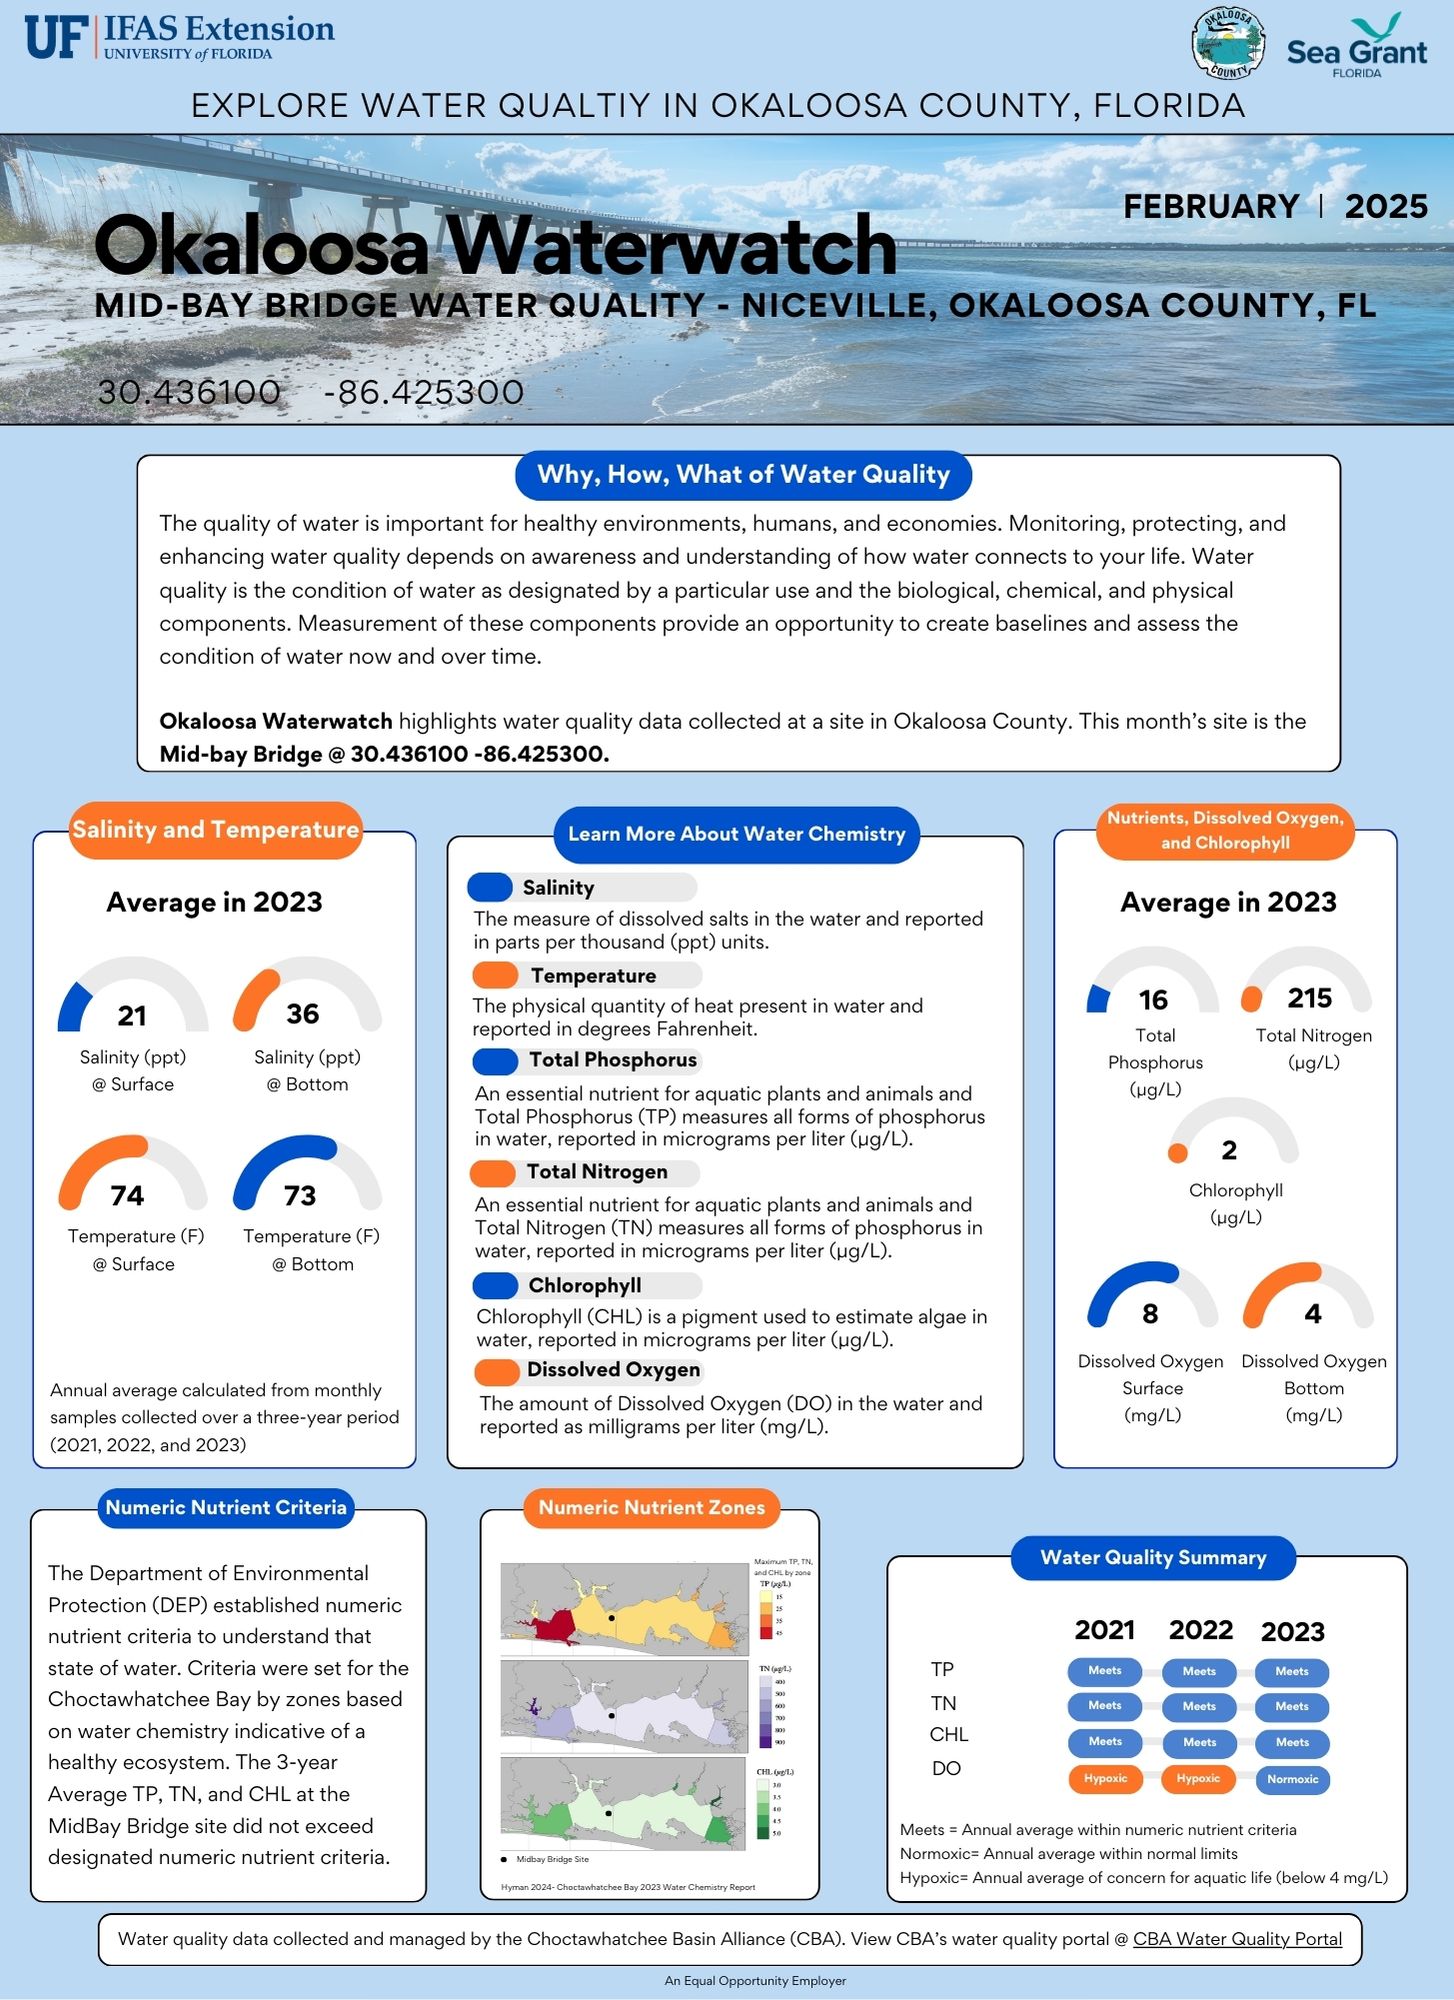
by Dana Stephens | Apr 11, 2025
Okaloosa Waterwatch is an opportunity to explore water quality data in selected locations spanning the Okaloosa County portion of the Choctawhatchee Bay.
A site is selected each month, and available water quality data are summarized and explained. The purpose is to understand water quality and the condition of our waters. Thanks to the Choctawhatchee Basin Alliance (CBA), water quality data has been collected frequently (monthly) for many years.
Below are the February and March Okaloosa Waterwatch water quality summaries. February highlights the mid-bay bridge (Niceville) location, and March highlights the entrance to Rocky Bayou (Niceville) location.
Check out the Okalooas Waterwatch YouTube channel for a personalized audio review of the water quality summaries. The YouTube channel is Okaloosa Waterwatch (@OkaloosaWaterwatch) or navigate directly using this link: https://www.youtube.com/channel/UCGPVMsyMiTU5BT9xyrFhuYQ
Please contact Dana Stephens, UF/IFAS Okaloosa County Sea Grant Extension Agent, for more information or to learn more about water quality in Okaloosa County. Email is dlbigham@ufl.edu and office phone is 850-689-5850.
Okaloosa Waterwatch February 2025 (PDF Link)
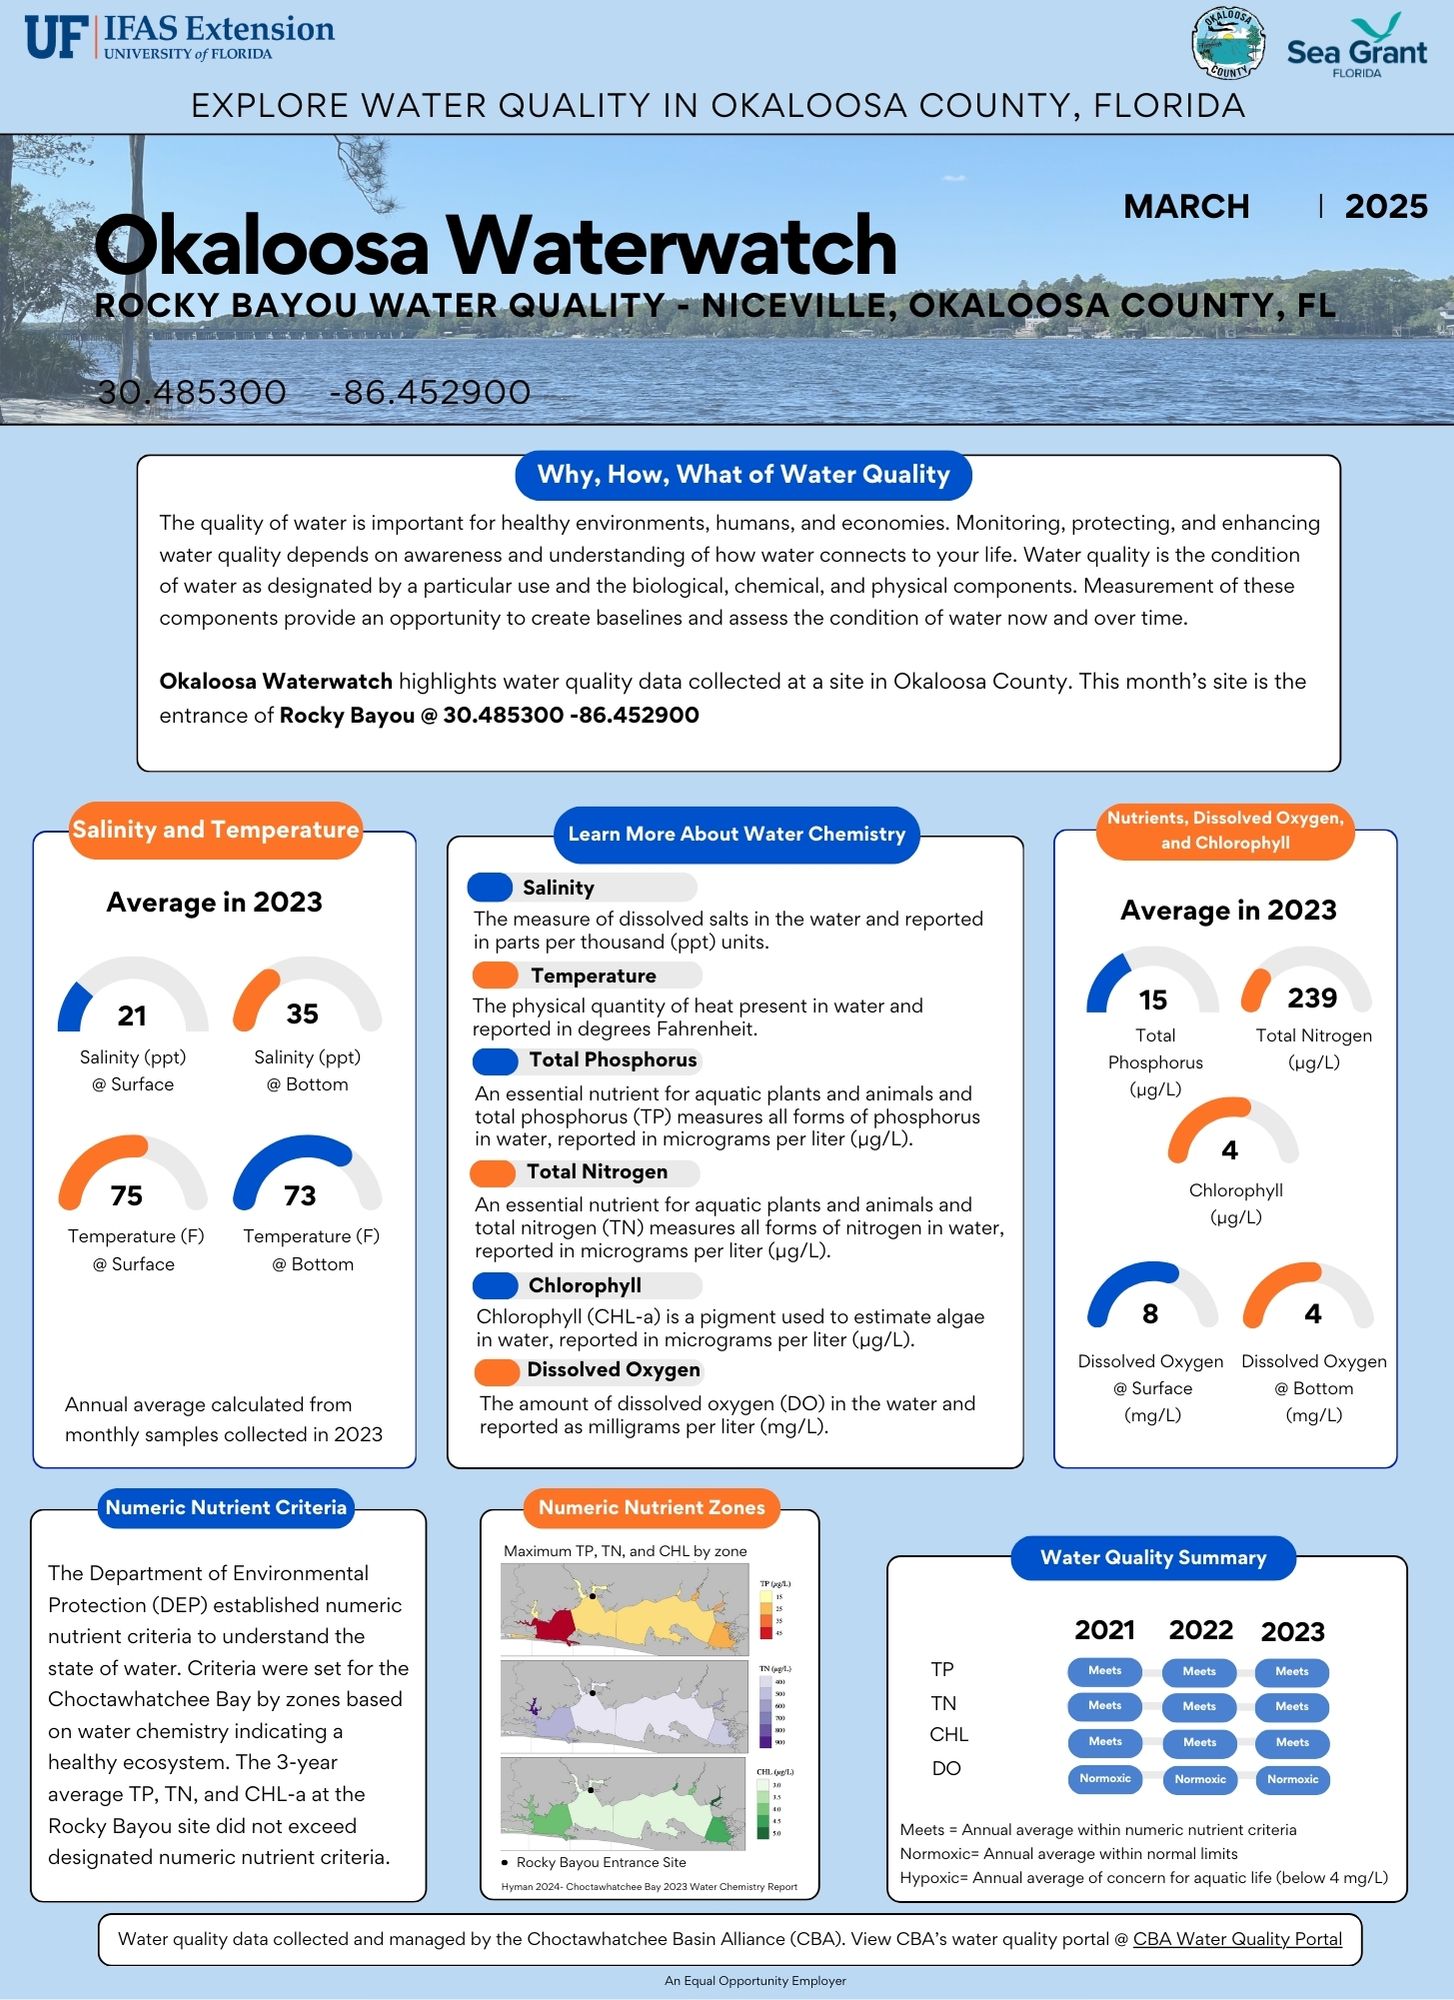
Okaloosa Waterwatch March 2025 (PDF Link)
by Dana Stephens | Aug 2, 2024
Do you know what is your watershed?
There was, is, and will be the same amount of water on planet Earth. Water is a finite resource. The United States Geologic Survey estimates Earth holds around 1,386,000,000 cubic kilometers of water. Only 330,520 cubic kilometers, less than 1% of all water on Earth, is freshwater. This freshwater is available in the soils, atmosphere, biosphere and used by humans.
We all have different connections with water. Maybe it is swimming. Maybe it is enjoyment of clean laundry. Maybe it is the iconic scenes in the 1992 Academy Award for Best Cinematography, A River Runs Through It. Yet, we all depend on water for life. How and why water moves across a landscape to sustain life is important to us all.

Watersheds in the Continental United States (usgs.gov)
Water located on land is called surface water. Water located underground is called groundwater. A watershed is the area of land where surface water and groundwater drain to a common place. Watersheds vary in size from as small as the size of your foot to as large as the watersheds spanning the continental United States. Larger watersheds are composed of smaller watersheds linked together.
Water gradually flows from higher to lower points in a watershed. Precipitation (i.e., snow, rain and everything in between) collects and moves within the drainage area in the watershed. Not all precipitation falling on a watershed flows out of the watershed. Precipitation soaks into the soil and through porous rock moving to lower points in the watershed, returning to and replenishing water stored underground. This groundwater can return to the surface of the watershed via springs or artesian wells, if the groundwater is under enough pressure.
Water can be removed before flowing out of the watershed as well. Precipitation returns to the atmosphere through evaporation as part of the hydrologic cycle. Plants facilitate evaporation to the atmosphere through transpiration where the roots of plants absorb water from the soil and the water evaporates into the air through the leaves of the plants. Human uses of water also impact how water moves through a watershed. Drinking water supplies, industrial operations, or building dams changes the movement of water through the watershed.
Each of us lives in a watershed. There is much benefit to have healthy watersheds. Healthy watersheds are essential to support ecosystems and the services provided, such as safe drinking water, outdoor recreation, economics, and overall quality of life. There are many metrics and assessments used to measure the health of a watershed. Do you know what is the health of your watershed?
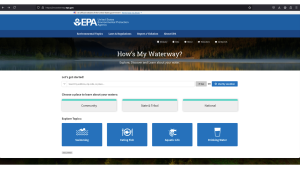
United States Environmental Protection Agency’s How’s My Watershed interactive tool (http://mywaterway.epa.gov)
The United States Environmental Protection Agency developed “How’s My Waterway” to provide the public with information about the condition of their local waters. How’s My Waterway offers three ways to explore your watershed. At the community level, you can see your watershed with details like the water quality, recreation, fish consumption, impairments, and associated plans working to remove impairments. At the state and national levels, you can find information about states/national water program(s) and specific water assessment(s) that affect your watershed.
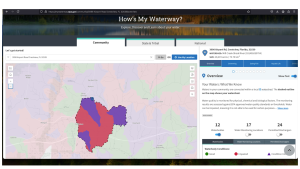
Example–watershed for Okaloosa County UF/IFAS Extension North office.
Let’s give it a try! Go to www.mywaterway.epa.gov in your web browser. Enter the desired address and select >>Go. On the left, you’ll see an interactive map outlining your watershed and the drainage basin(s) that make up the watershed. On the right, there are 10 different tabs allowing you to explore various metrics of the watershed. For example, there is a general tab reviewing the water conditions and states (i.e., good, impaired, or condition unknown) for all surface waters in the watershed. Using the arrow on the right, you can expand each water source to learn specifics about the data-determined state of the water.
Enjoy exploring your watershed! If you have questions about the interactive “How’s My Waterway,” wish to join an educational session to learn more, and/or desire accompanying curriculum, please email Dana Stephens at dlbigham@ufl.edu.
by Dana Stephens | May 3, 2024
Understanding Salinity in Northwest Florida’s Waters with a Family Activity
Dana Stephens, 4-H Agent
Salinity is the amount of total dissolved salts in water. This includes all salts not just sodium chloride, or table salt. Salinity is important in aquatic environments as many flora and fauna depend on salt and the level of dissolved salts in the water for survival. People interested in the composition of water frequently measure chemical and physical components of water. Salinity is one of the vital chemical components measured and often measured by a device determining how readily electrical conductance passes between two metal plates or electrodes. These units of electrical conductance, the estimate of total dissolved salts in water, is described in units of measurement of parts per thousand (PPT).
At the large scale, Earth processes, such as weathering of rocks, evaporation of ocean waters, and ice formation in the ocean, add salt to the aquatic environment. Earth processes, such as freshwater input from rivers, rain and snow precipitation, and ice melting, decrease the concentration of salt in the aquatic environment. Anthropogenic (human-induced) activities, such as urbanization or atmospheric deposition, can also contribute to changes in salinity.
Salinity and changes in salinity affect how water moves on Earth due to contrasts in the density of water. Water containing no dissolved salts is less dense than water containing dissolved salts. Density is weight per volume, so water with no dissolved salts (less dense) will float on top of water with dissolved salts (denser). This is why swimming in the ocean may feel easier than swimming in a lake because the denser water provides increased buoyancy.
Northwest Florida is a unique place because we have a variety of surface waters that range in salinity. There are ponds, lakes, streams, rivers, and springs, which have no to low salinity levels (0 to 0.5 PPT), and commonly referred to as freshwater systems. We house six estuaries—Perdido Bay, Pensacola/Escambia Bay, Choctawhatchee Bay, St. Andrews Bay, St. Joseph Bay, and Apalachicola Bay. Estuaries are bodies of water with freshwater input(s) (e.g., rivers) and a permanent opening to the ocean (e.g., Destin Pass in the Choctawhatchee Bay). Estuarine waters are termed brackish water (0.5 to 30 PPT) due to the dynamic changes in salinity at spatial and temporal scales. Waterbodies with an even more dynamic change in salinity are the coastal dune lakes Northwest Florida’s Walton and Bay Counties. Coastal dune lakes are waterbodies perched on sand dunes that intermittently open and close to the Gulf of Mexico. Sometimes these waterbodies are fresh and sometimes they have the same salinity as the Gulf of Mexico, like after a large storm event. Finally, the Gulf of Mexico, or ocean, has the highest salinity (> 30 PPT) among the waterbodies of Northwest Florida.
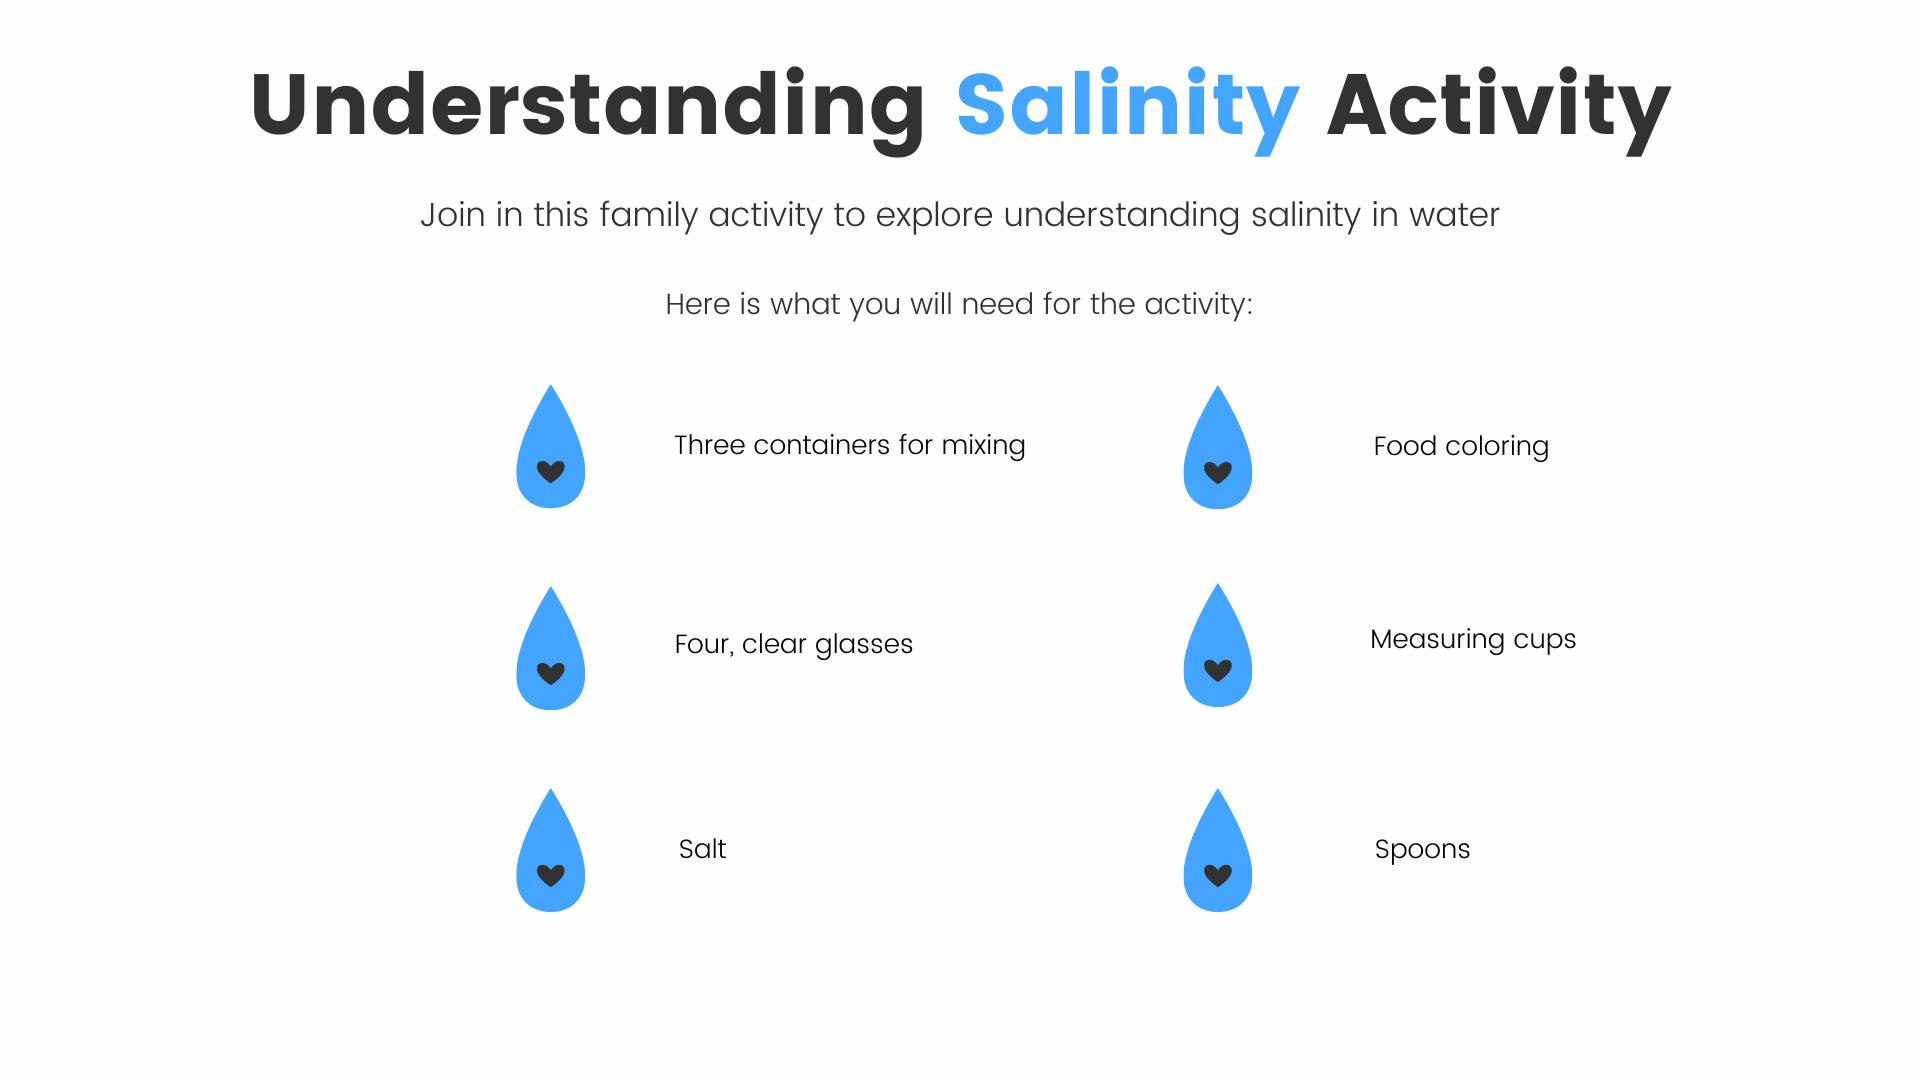
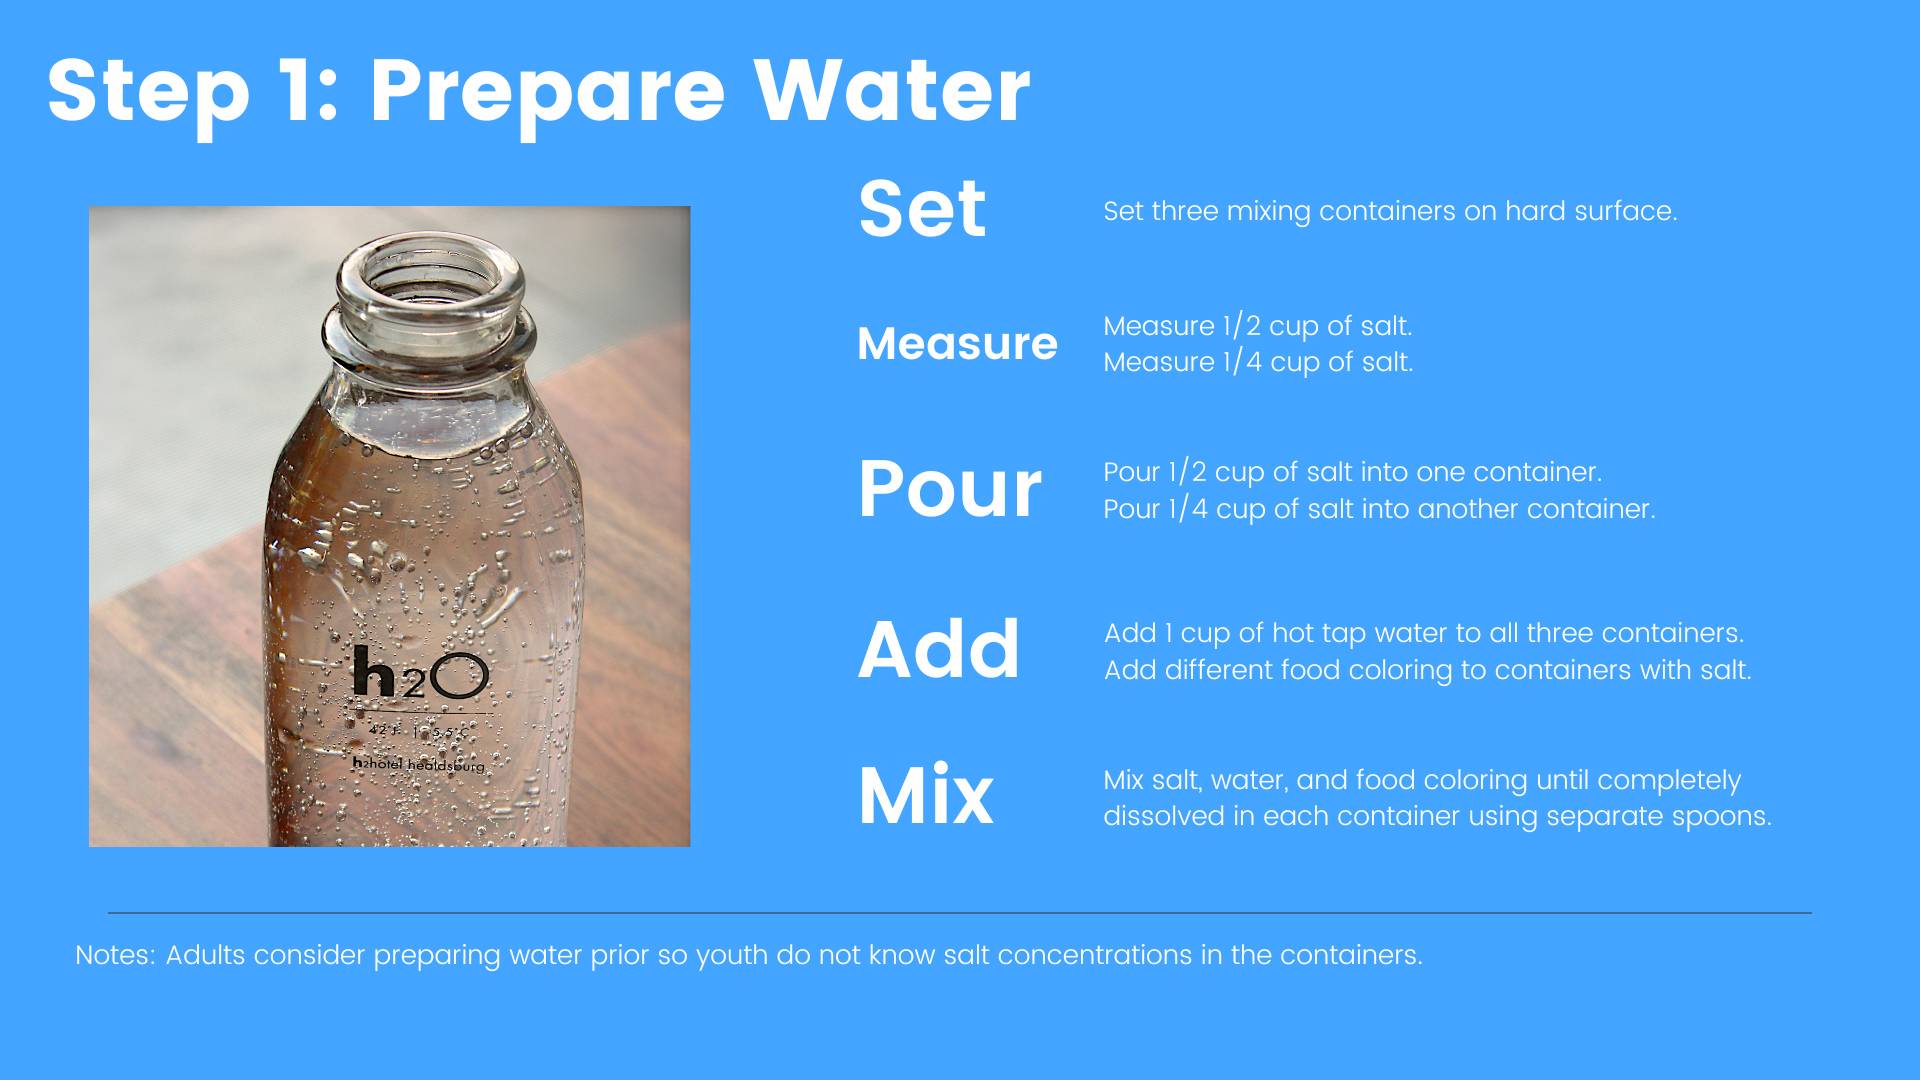
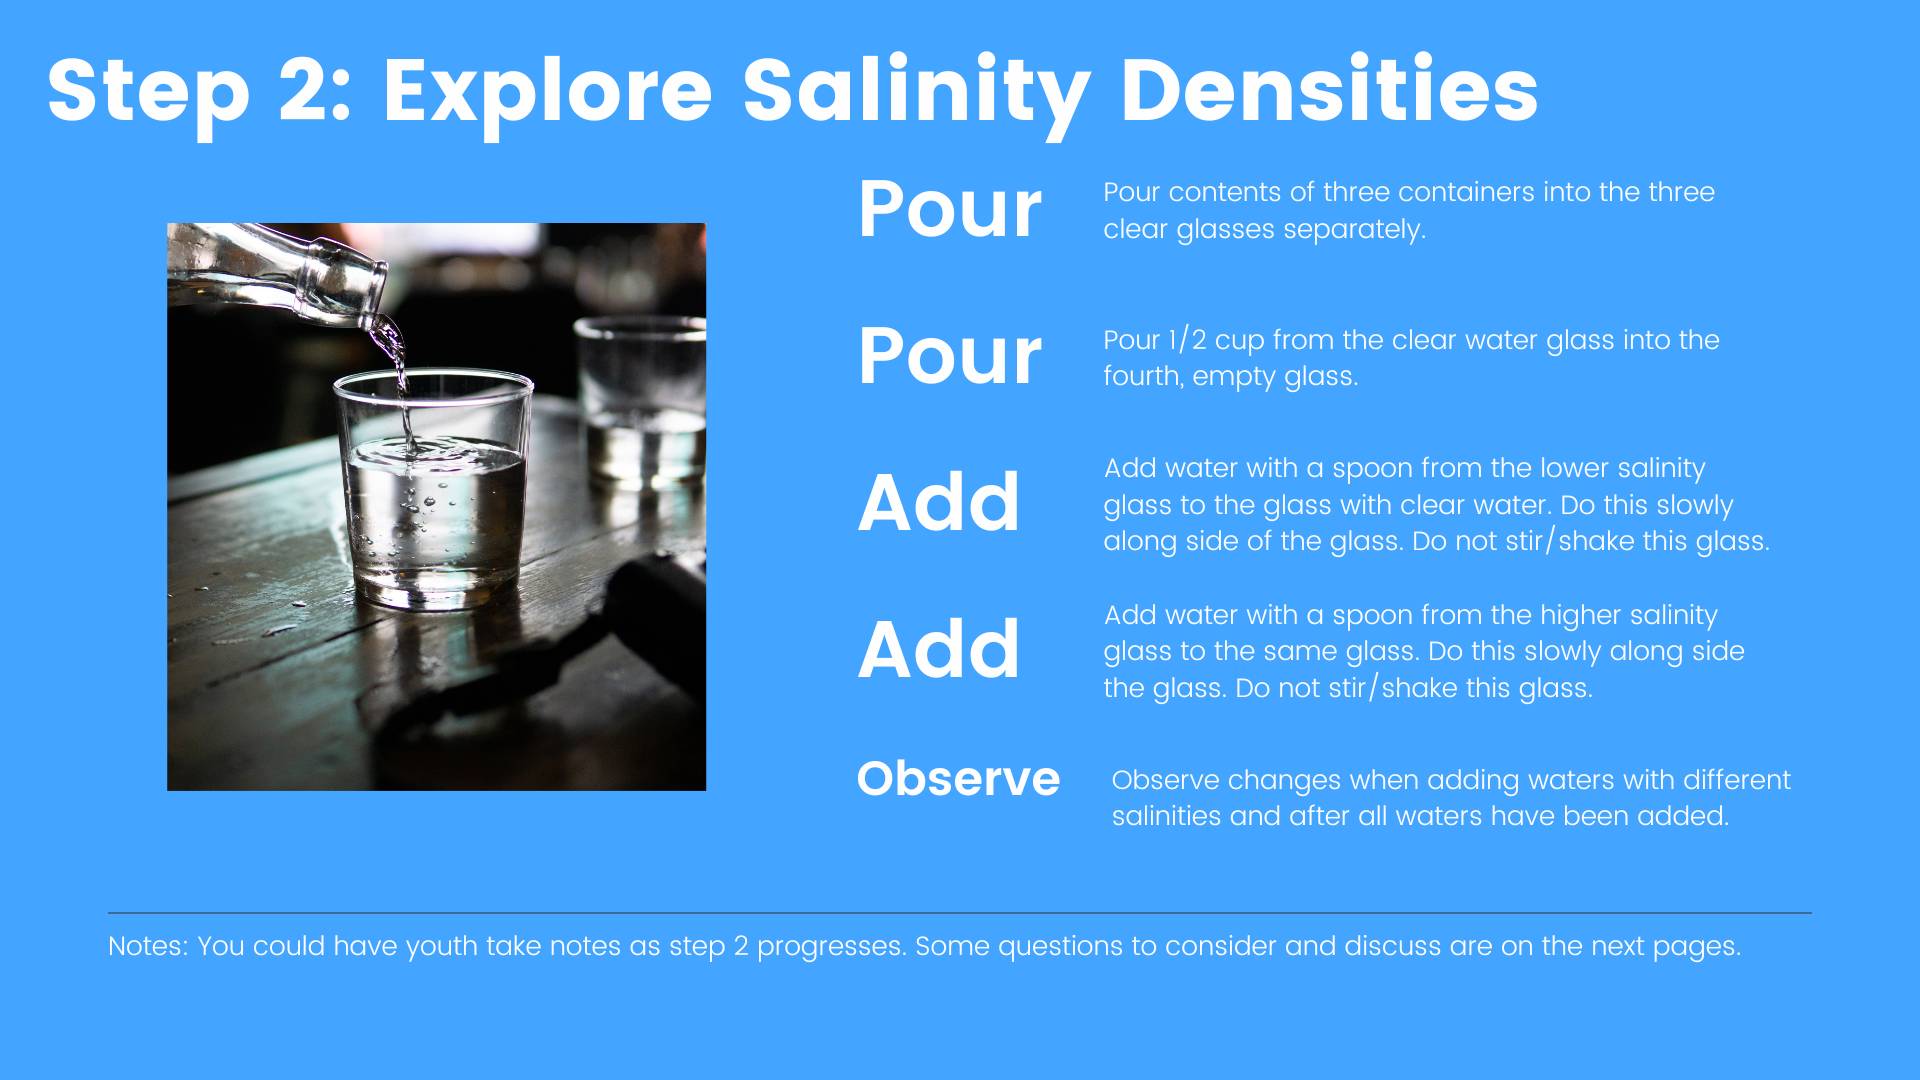
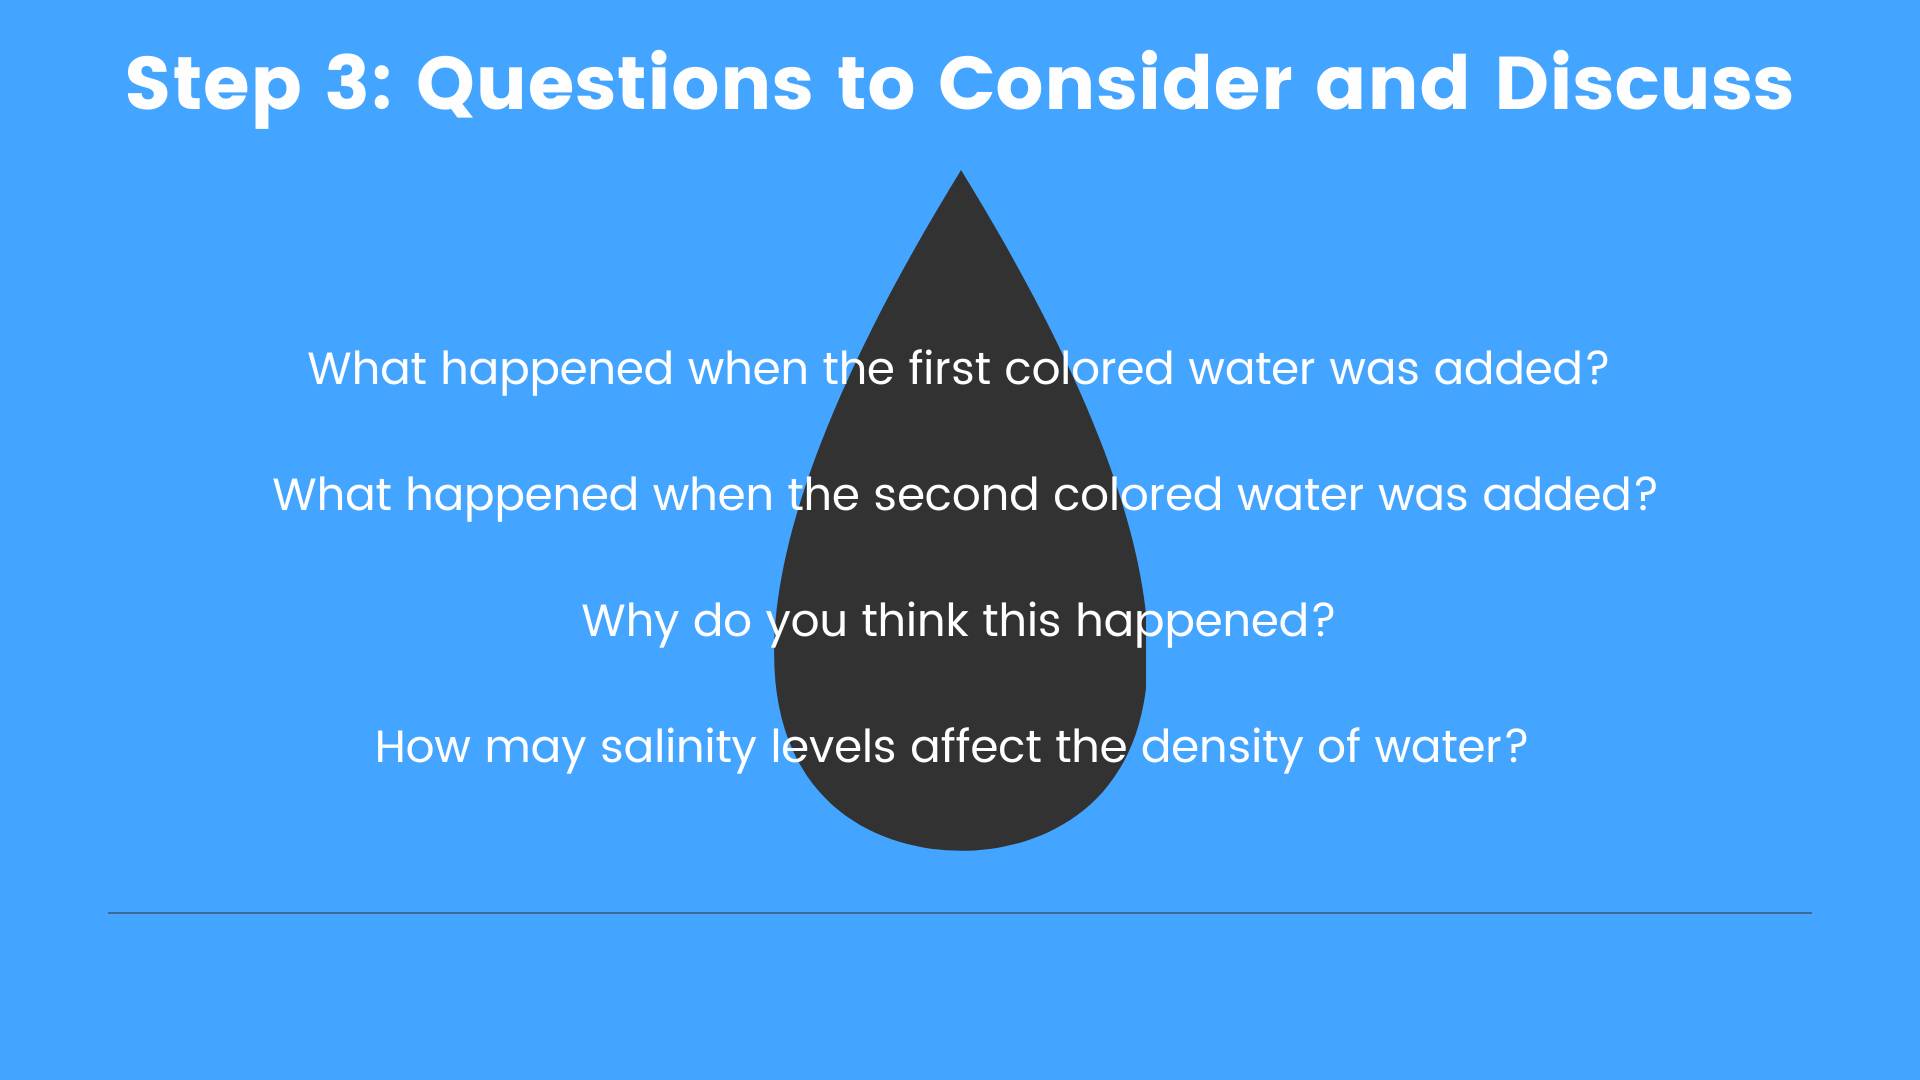
Here is an educational activity for the family to explore salinity and how salinity differs among Northwest Florida waters.