Over the last 10 years or so, the Florida Panhandle has gotten used to relatively warm winters, at least historically speaking. While we have experienced sharp cold snaps that were devastating to unprepared landscapes and gardens (the most recent being the late December dip down into the low to mid-teens in 2022), they haven’t lasted long and, overall, winters have been mild. Anecdotally, it seems like this winter (2024-2025) has been a return to a historical norm, with extended periods of cloudy, dreary cold; but does the data support that feeling? Let’s find out.
There are several ways of measuring the relative cold of one winter to the next. You could use weather station data and see what the coldest temperatures a given year received. You could track how many days the mercury dipped below freezing. You could measure the maximum temperatures and compare those year to year. However, for gardeners, commercial crop growers, and most other people, I think the most useful and intuitive comparison of winter intensity from year to year is chill hours.
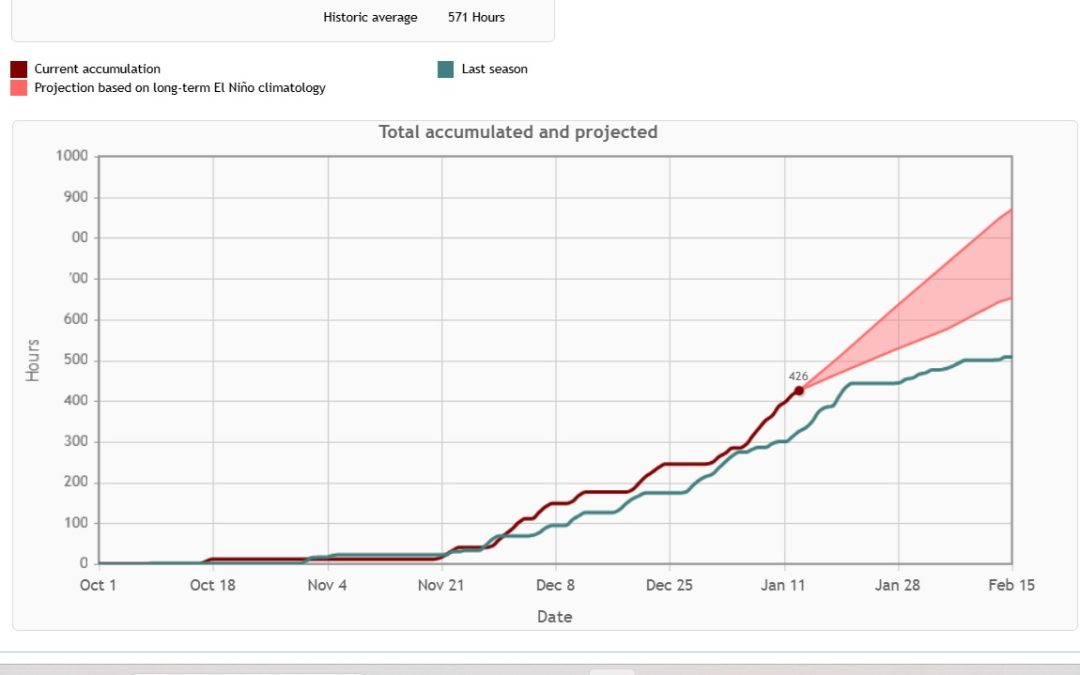
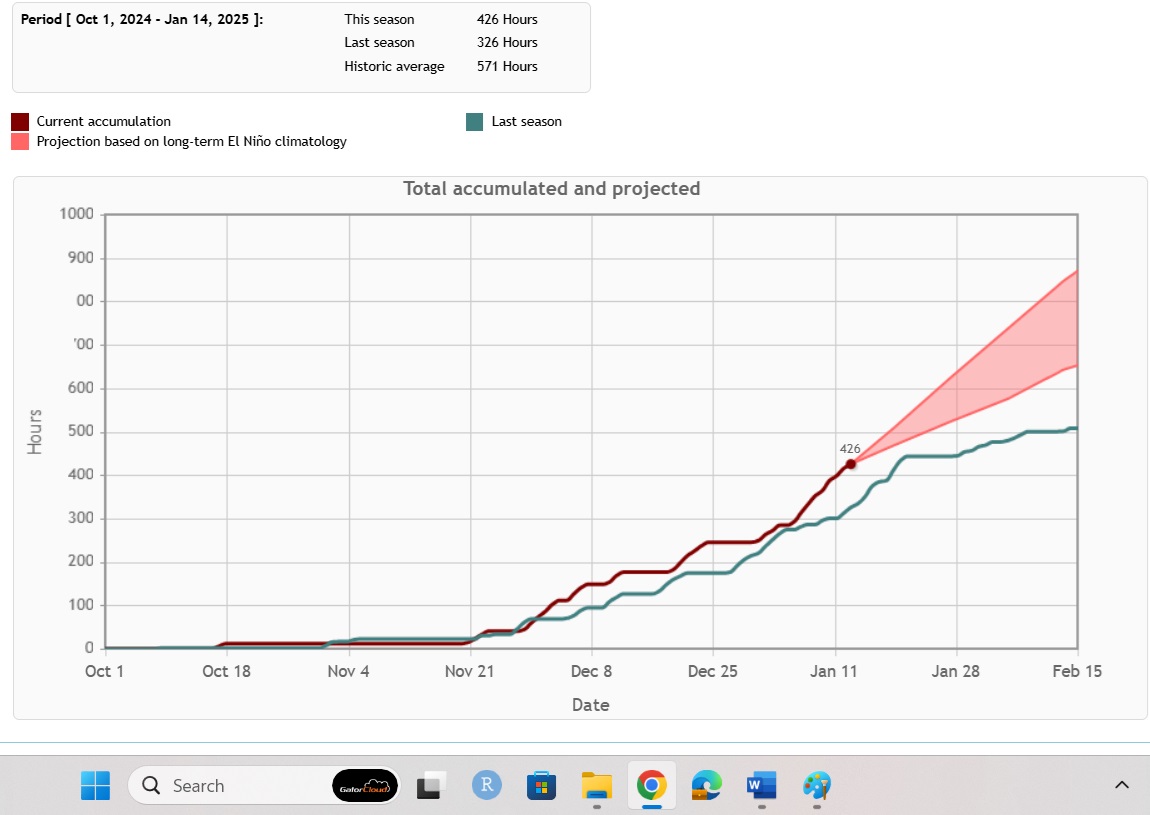
A chill hour is loosely defined as an hour below 45 degrees. Chill hours play a big role in deciduous fruiting plants flowering cycle and ultimately help determine if those plants make fruit the following year or not. While that is important to fruit growers, in this article, we’re more concerned with using chill as a relative comparison of winter intensity year to year. Last winter, the Florida Automated Weather Network (FAWN) station in Marianna (the closest one to Calhoun County that observes chill hours) logged 326 hours from the period of October 1 to January 14. This winter, that same weather station has logged 426 hours in the same period of time. A little elementary school math tell us we’ve received 100 more chill hours *so far* this year than we received last year – the equivalent of four entire 24 hour days under 45 degrees! That’s pretty significant. However, the historical average over the same time period is 571 chill hours, so we are still lagging behind what the area “used” to receive.
So yes, this winter has been colder than last at the time of this writing (January 16) and that isn’t even considering the extreme cold forecast for next week (week of January 20th) when you’re likely to be reading this. Things have been cold and are likely to remain that way for at least the rest of January, maybe beyond into February. However, it is important to remember that this year isn’t an outlier historically, as even this spat of recent cold finds us lagging our historical cold temperature norms a bit.
To track chill hours yourself, visit this website. For more information on our local natural resources and climate, contact your local Extension office. Bundle up out there an enjoy the coldest winter in several years!
I am sure everyone has noticed how cold this winter has been. We have had multiple days in the 20’s here in the Florida panhandle, even some snow flurries near Pensacola. I was first told this may happen by a Sea Grant colleague of mine who works with oyster farmers. Six months ago, he said the Farmer’s Almanac mentioned this would be a colder than normal winter. A few weeks later a Master Naturalist mentioned that if it was heavy “mast season” (lots of acorns on the ground) it would be a colder winter. We certainly had a heavy mast season in Pensacola this year, acorns were EVERYWHERE. And here we are. As I type this it is 27°F outside.
Though we do not see snow as often as Colorado, the panhandle does see snow from time to time.
Photo: Rick O’Connor
This past week I was at a Sea Grant meeting. We were discussing this cold and another colleague mentioned that it was an El Nino year. That’s right… it is an El Nino year, and many know that the weather does change when this occurs.
I first heard of the El Nino shortly after receiving my bachelor’s degree. I was teaching at Dauphin Island Sea Lab, and we had a video series on oceanography and one episode discussed it. It explained that commercial fishermen in Peru were the first to notice it over a century ago.
Off Peru’s coast is a large ocean current that originates in the Antarctic, flows north towards the equator passing the west coast of South America along the way. The water is cold and full of life. The Andes Mountains also run north-south along the coast. Cold air at the top of the mountains runs down towards the coast and offshore. As it blows offshore, it “pushes” the surface water of the ocean offshore as well. This generates an upwelling current moving from the ocean floor towards the surface, bringing with it nutrients from the sediments below. This nutrient reach seawater, mixing with the highly oxygenated cold water, and the sun at the surface creates the perfect environment for a plankton bloom, and a large bloom she is. This large bloom attracts many plankton feeding organisms, including the commercially sought after anchovies and sardines. This in turn supports the tuna fishery that comes to feed on the small fish. These are some of the most productive fisheries on the planet.
Based on records kept by Peruvian fishermen, every three to seven years the surface waters would warm, and the fish would go away. It was lean times for them. When it did occur, it would do so around Christmas time. So, the fishermen referred to it as the El Nino – “the child”.
Based on the video episode we showed the students, others began to notice warming along the western Pacific and realized it was a not a local event, but a global one. A high school friend of mine does sound for nature films and one of his first projects was to video the effects of the El Nino on the seal nesting season in California. As in Peru, the cold waters become warm, the bloom slows and the fish go away, with less fish the mother seals have no food so, cannot produce milk for their newborns waiting on the beach. As horrible as it sounds, and was to watch in Mike’s film, the mothers eventually abandon the newborns to starve.
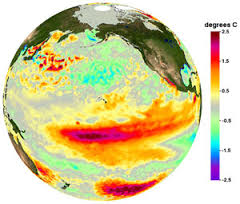
The video we showed at Sea Lab followed marine biologists studying corals along the western coast of Central America. Here the waters were warming as well, warmer than normal, and the corals were stressed and dying. With orbiting satellites now in place oceanographers were able to view this event from space and watch the entire thing unfold. These images showed that during a normal year the western Pacific had cold water along California and much of South America. The waters along western Central America were warm. But during an El Nino year, warm water replaced the cold, particularly near Peru. Scientists were able to connect several events to El Nino seasons. Increases in wildfires in the western US, people were viewing the northern lights at lower latitudes, droughts occurred where it was usually wet, floods occurred where it was usually dry, and during one El Nino season the Atlanta Falcons made it to the NFL playoffs. Weird things were happening.
The obvious question for science is what drives these El Nino events?
It is understood that our weather and climate are driven by ocean currents. The “dry air” everyone talks about in the western US is driven by the cold California Current. Likewise, the “humid air” of the southeastern US is driven by the warm Gulf Stream. If you alter these currents, you alter the weather and climate of the region. How do you alter ocean currents?
Warm water in the eastern Pacific indicates an El Nino season.
Graphic: NOAA
In the 1980s, when I was teaching at Dauphin Island Sea Lab, the video suggested a connection to sunspots on the surface of the sun. At the time, they were not sure whether the increased sunspot activity triggered the El Nino, or whether there was something else going on, but there was a correlation between the two.
One explanation comes from a textbook on oceanography I used when I was teaching marine science during the 1990s1. It explains the event as such…
During “normal years” cold water from the Arctic and Antarctic runs along the western coasts of North and South America – both heading towards the equator. Once there, the earth’ rotation moves this water westward towards Australia and Indonesia, warming the water as it goes.
Apparently, the ocean currents cannot transport and disperse these warm waters effectively once they reach the western Pacific. Thus, warm water begins to build there.
This accumulating warm water seems to reverse the trade winds that normally flow from the eastern Pacific to the western along the equator. This wind reversal occurs between November and April. It mentions that in the late 1990s the cause of this wind reversal was not well understood.
This wind reversal is often followed by the development of twin “super typhoons” (very strong typhoons) north and south of the equator.
The extreme warm water in the western Pacific affects the weather in the region and this “heat mass” expands spatially. During this expansion, the high-pressure system that sits over the eastern Pacific, bringing them the dry air we know California for, weakens. At the same time, the normal low-pressure system over the western Pacific weakens and, in a sense, things are flipped. This atmospheric change is called the Southern Oscillation, and the entire event was termed the El Nino Southern Oscillation (ENSO).
The power of the typhoons moves warm water from the western Pacific across the equator to the America’s. The waters there warm and the historic El Nino occurs. This movement takes several months.
The El Nino will persist for one to two years. When the warm water eventually releases its heat, the waters cool, and normal conditions return. Until the next El Nino forms.
In the 1990s they had already noticed an increase in the frequency of El Ninos (based on old fishermen’s logs). They suggest climate change may be driving this.
During El Nino years weather patterns change globally, as mentioned above. This altering of the weather impacts all sorts of biological processes, as mentioned above.
Often, the “return” of colder water along the western Pacific “overshoots” normal temperatures and the ocean becomes colder than normal. This has been termed the La Nina.
I kind of imagine the whole process like a sloshing pool of water flowing towards one end of the pool, bouncing off and sloshing back to the other. But instead of water “sloshing around” it is temperatures.
But this was 1996. Have scientists learned anymore about this event?
Not much has changed in their explanation, other than we are much better at predicting when they will happen and alert the public so that farmers, fishermen, fire fighters, etc. are prepared. They do seem to be increasing in frequency.
For the 2024 El Nino, which NOAA began alerting the public in the summer of 2023, they are predicting it to continue for several seasons2. There is no doubt that this winter is colder than normal. The Florida panhandle also experienced a drought this past fall. But… during most El Nino years, hurricanes are few in the Gulf of Mexico. We will see, and watch, how the rest of the year rolls out.
Reference
1 Gross, M.G., Gross, E. 1996. Oceanography; A View of Earth. 7th edition. Prentice Hall. Upper Saddle River, New Jersey. Pp 472.
2 El Nino / Southern Oscillation (ENSO) Diagnostic Discussion. Jan 11, 2024. National Weather Service Climate Prediction Center. National Oceanic and Atmospheric Association.
I attended a meeting recently where one of the participants stated – “We have been looking at a lot of water quality parameters within our bay in recent years, and plan to look at more, but has anyone been looking at temperature?”
What he was referring to was that the focus of most monitoring projects has been nutrients, dissolved oxygen, etc. But most agencies and universities who have been conducting long term monitoring in our bays are collecting temperature data as well. His question was not whether they have or not but has anyone looked at this long-term temperature data to see trends.
I know from some of the citizen science monitoring I have been involved with that temperature is collected but (anecdotally) does not vary much. It is like pH, we collect it, it is there, but does change drastically (anecdotally) over time. However, it has been a very hot year. This “heat dome” that has been sitting over the Midwest and southeast this summer has set records all across the region. Someone monitoring water temperature in East Bay recently reported surface water temperature at 96°F (36°C). Many have stated that swimming in our waters at the moment feels like swimming in bath water. It’s not just warm in your yard, it is warm in the bay. And this brings up the question of thermal tolerance of estuarine species.
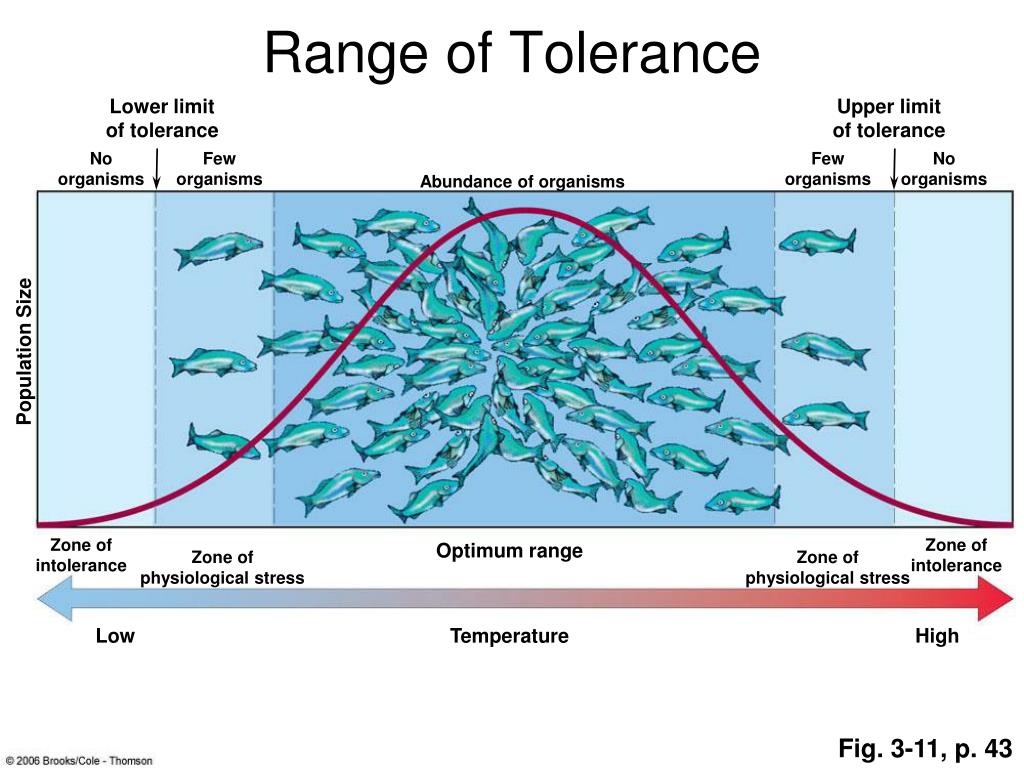
All creatures have a temperature tolerance range. They resemble a bell curve where you have the thermal minimum at one end, the thermal maximum at the other, and the “preferred” temperatures near the top of the bell curve (see image below). Many creatures have a large tolerance for temperature shifts (their bell curves extend over a larger temperature range). You find such creatures in the temperate latitudes where temperature differences between summer and winter are larger. Others have a lower tolerance, such as those who are restricted to polar or tropical latitudes. Within an estuary you can find creatures with varying thermal tolerances. Some have a larger tolerance than others. Ectothermic (cold-blooded) creatures often have a wider range of temperatures they can survive at than endothermic (warm-blooded) ones. Homotherms (creatures who maintain their body temperature near a fixed point – such as humans 98.6°F/37°C) expend a lot of energy to do this. When environmental temperatures rise and fall, they have to expend more to maintain it at their fixed temperatures.
Image provide by Research Gate.
It is also true that most creatures prefer to exist near their thermal maximum. In other words, the bell curve is sort of skewed towards the warmer end of their range. But what is their thermal maximum? What happens when they reach it? How hot can they go?
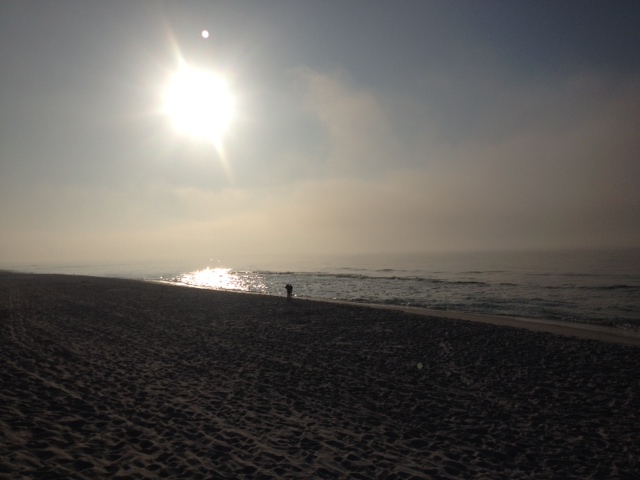
Local waters are warmer this year.
Photo: Rick O’Connor
The studies I reviewed suggested that the thermal maximum is dependent on other environmental factors such as salinity and dissolved oxygen. In most cases, the higher the salinity, the higher the thermal maximum was. I looked at studies for the eastern oyster (Crassostrea virgincia), the brown shrimp (Farfantepenaeus aztectus), the blue crab (Callinectes sapidus), the Spot Croaker (Leiostomus xanthurus), and the pinfish (Lagodon rhomboides). The oyster, shrimp, and blue crab support important commercial fishery. The spot croaker is a dominant fish species in the upper estuary where the pinfish is a dominant species in the lower sections. These studies all suggested that again, depending on salinity, dissolved oxygen, pressure, and rate of temperature increase, the thermal maximum could happen as low as 30°C (86°F) and as high as 40°C (104°F), with many having a thermal maximum between 35-40°C.
At these temperatures proteins begin to denature and biological systems begin to shut down. Most of the studies determined the endpoint at “loss of equilibrium” and not actually death. Our estuaries can certainly reach these temperatures in the summer. Again, one recent reading in East Bay (within the Pensacola Bay system) was 96°F (36°C).
So, what do these creatures do when such temperatures are reached?
The most obvious response is to move, find cooler water. These are often found in deeper portions of the bay below the thermocline (a point in the water column where water temperatures significantly change – usually decreasing with depth). However, many sections of our estuaries are shallow and deep water cannot be found. In these cases, they may move great distances to seek deeper water areas, or even move to the Gulf of Mexico. In some cases – like with oysters – they cannot move, and large die-offs can occur. Other responses include lower metabolic rates and decline in reproduction.
We know that throughout history, there have been warmer summers than others and heat waves have happened. In each case, depending on other environmental factors, estuarine creatures have adapted, and some members have survived, to keep their populations going.
We know that large scale die-offs have occurred in the past and the tougher species have continued on.
We also know that the planet is warming, and it would be interesting to look at how the water temperatures have changed over the last few decades. Are they increasing? Are they reaching the thermal maximums of the creatures within our bay? How will these creatures respond to this?
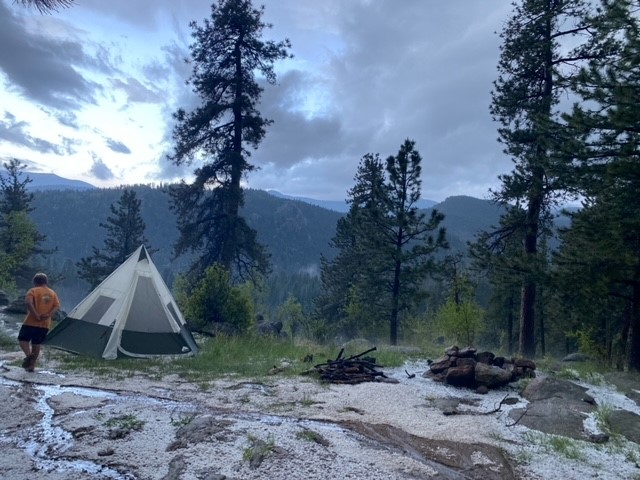
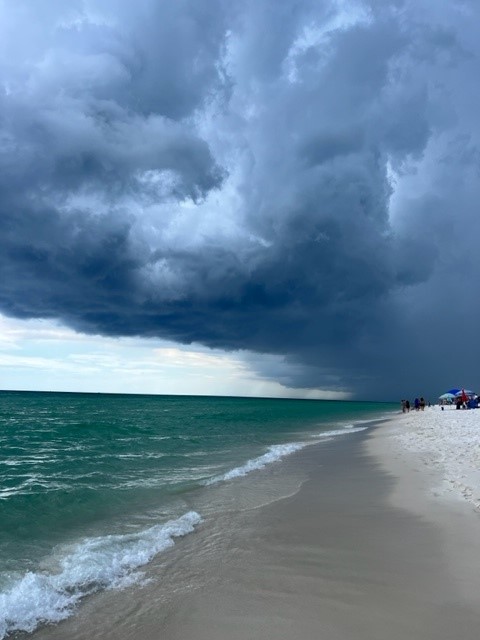
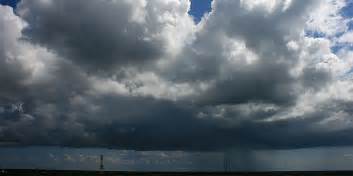
Everyone has noticed the intense weather that crossed the United States in recent years. Tornadoes are hitting communities throughout the Midwest, but are also hitting places like Seattle, southern California, and even recently Pensacola Beach. Thunderstorms, though common, are occurring in waves. Typical summer days here in the panhandle include afternoon thunderstorms, but recently there have been daily squall lines beginning as early as 9:00am. I was recently camping out west and we encountered three hailstorms. Though these do occur out there, they were becoming a common thing and were also encountered in multiple states. And of course, there are hurricanes. Some are more intense and increase intensity as they come ashore, instead of decreasing as has been the rule over the decades.
This squall line formed early in the morning. One of many morning thunderstorms formed over a period of a week in the summer of July 2023.
Photo” Rick O’Connor
Many have pointed the finger at climate change as being part of the reason why these intense weather events are increasing, and climatologists have said for decades this could happen. To better understand what is driving these storms, I decided to grab one of my old college textbooks from the shelf and read what actually forms and fuels these weather events. The Nature of Violent Storms was published in 1961, and reprinted in 1981, by Dr. Louis Battan. Though many things that were unclear at the time of the writing have been discovered, the mechanisms that generate and fuel these storms were understood.
The mechanism that begins storms is convection cells within the air rising from the earth’s surface. The air moving over warm land or water warms as well and begins to rise. The rising air lowers the air pressure at the surface and is called a low pressure system. We associate low pressure systems with storms. These storms form due to unstable air masses in this rising column of air. The greater the temperature difference between the warmer air near the ground, and the cooler air in the upper atmosphere, the more unstable the air becomes and the faster the column of air rises. As the air rises it begins to cool, become denser, and falls back to earth like a water fountain shooting water into the air. This is the convection cell we have heard about.
However, if the air mass holds a lot of moisture (humidity) the release of heat from this humid air mass rising in the column can warm the environmental air mass surrounding it enough to cause the rising air mass to continue higher into the atmosphere increasing its speed while doing so. We can see this as cumulus clouds building over the landscape and, if humid enough, you can literally watch the thunderhead build. If supplied with enough water vapor and heat, these thunderheads will grow all the way to the tropopause (the lower layer of the stratosphere where the atmosphere itself begins to warm, not cool) and form the “anvil” shape of a thunderhead we are all familiar with. As a college student taking coastal climatology (the class this book was associated with) we would sit outside of Dauphin Island Sea Lab at mid-afternoon and bet on which thunderhead would reach the tropopause first.
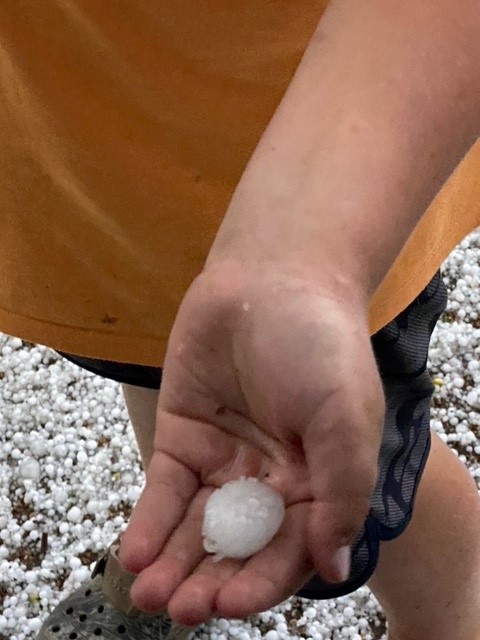
The upper layer of the lower atmosphere is quite cold. Here the releasing water vapor condenses into rain droplets, ice, and often hail. They fall back towards earth. Much of the ice and hail melt before reaching us but under intense conditions this frozen precipitation can reach the earth’s surface as hailstones, some being as large as three inches across. One storm we encountered in Colorado this year had hailstones about the size of a large marble. We heard that at a nearby amphitheater the hail reached the size of golf balls and many who were there to see a concert (and there was no cover to hide) were taken to the hospital.
A hail storm encountered by the author in Colorado.
Photo: Rick O’Connor
The one common denominator in the formation of such storms is the presence of a warm landmass or water body. The warmer these land masses and water bodies are, the more energy there is for the enhanced convection and severe storm formation. And these land masses, and water bodies are getting warmer.
Hail stones are formed from ice that manages to remain solid as precipitation in very unstable air masses. They can reach three inches across.
Photo: Rick O’Connor
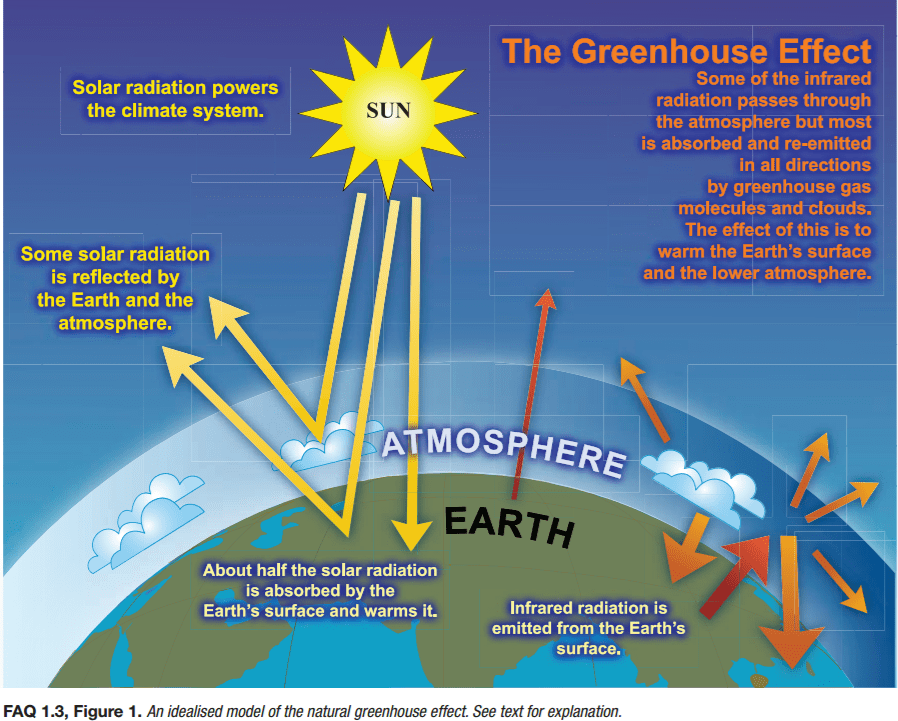
What has changed is the atmosphere itself. There are gases within the atmosphere that allow solar rays to pass through reaching the surface of the earth, but do not allow the warmed air caused by the warming of land and sea from this solar radiation to escape back into space – the so called “greenhouse effect”. This is actually good; it keeps our planet at a warmer temperature than it would be if these gases were not present and allows life to exist here. However, an increase in these “greenhouse gases” can increase the overall temperature and create problems – intense storms being one of them. The surface of the planet Venus is around 900°F. Even though the planet Mercury is closer, Venus is warmer due to the heavy amount of greenhouse gases in its atmosphere. At temperatures like this, it is understandable that life does not exist there, and scientists do not believe it could. Getting scientific instruments to the surface of Venus is difficult due to the large amount of sulfuric acid in the clouds, much of this coming from intense volcanic activity there.
The greenhouse effect.
Image: NOAA
On Earth, our temperatures are climbing – slowly, but climbing. As the atmosphere warms due to the greenhouse effect, it increases the temperature of the land mass and water bodies. Increased temperatures in Pensacola Bay have triggered some die offs of oysters, and the warming Mobile Bay has increased the number of jubilee’s occurring there. Remember, high water temperatures mean low dissolved oxygen levels. Increased surface temperatures will create more unstable air masses and a breeding ground for the formation of vortices that can, and do, lead to more intense thunderstorms and tornadoes. Surface temperatures are increasing in locations where historically such weather events have not been common, like Seattle. Recently, I had to make a trip to a department store at one of our local malls. Leaving the house, as I crossed our wooden deck and walked through the yard to the truck, it was definitely warm – it was July. However, when I arrived at the store, where all was concrete and asphalt, the temperature difference was striking. It was MUCH warmer. Actually, at the store front it was almost unbearable. In many of our large cities, and even in smaller ones, we have converted much of the natural landscape to concrete and asphalt, which is increasing the surface temperatures even more, and enhancing unstable air even more. We have all heard that large cities create their own weather, and it is true.
So…
How do we turn this around?
I see two paths. (1) Reduce the source of the heating – greenhouse gases. (2) Mitigate the impacts of the heating.
There are several sources of greenhouse gases, and these have been discussed in other articles, but certainly the use of fossil fuels is a major one and reducing our dependency on these would be a good start. But we are moving very slowly on this, the will to do it just is not strong enough.
To mitigate the impacts, we would need to re-think how we grow and develop the landscape. Even today, many of the new subdivisions I see clear all of the vegetation, place the houses close together with little or no green space, use asphalt roofs, and replace little or none of the vegetation. It seems our development plan does not have the will to make some much needed changes in planning either. There are many ways in which we can develop our landscape to help mitigate the warming that is occurring. Many researchers at the University of Florida have been working on this for many years. For ideas and suggestions, just contact your county extension office.
Based on the 2021 Intergovernmental Panel on Climate Change’s report, we may be past the tipping on sea level rise, but we are not on other negative impacts of climate . It is understood that with any mitigation efforts right now, there will be a lag time of several years before things begin to turn around, it is not too late. We can do this.
2017 began as most years do, the Bermuda high slid east across the Atlantic Ocean and the cold fronts began to reach the Gulf Coast. However, this past winter was milder than normal. Either the high did not slide as far east as it typically does, or the fronts did not pack the punch they normally do – but we did not have as many deep freezes in 2017. That’s how it began.
The Bermuda High influences both our weather and climate in the Florida panhandle. Image: Goddard Media NASA
As spring approached the Bermuda High made its’ annual move westward, bringing us the clockwise winds from the southeast and moisture from the Gulf. It was time for rain… and rain it did. It rained and rained and rained. It rained so much that the salinities in the local bayous in Pensacola, which typically run between 10-15 parts per thousands, were below 1 ppt – freshwater. These heavy rains triggered high bacteria counts in the water column, which triggered health advisories – increasing 139% this year.
Late spring and summer is the season of afternoon thunderstorms – and Sea Grants’ estuary monitoring programs in Pensacola Bay. This year we observed many things:
Numerous bald eagles, more than we had seen before
Communities calling about snake encounters – this is not unusual when it rains, but this year there were more venomous snakes than we typically see.
We began to get calls concerning Cuban Anoles (an invasive lizard) all along the coast from Perdido Key to Gulf Breeze. As more people searched, more anoles were found. I saw the first two at my house this year.
We were searching for horseshoe crabs, and found them! In several locations in the lower bay, but never found where they were nesting – we will continue to search in 2018.
Our terrapin surveys extended to Walton County. We found two new terrapin nesting beaches in Escambia and the sea turtle nests reached record numbers across the state.
Our scallop surveys in Santa Rosa Sound and Big Lagoon were a complete bust due to the rain. Either it was raining, or the visibility was so poor you could not see. An algal bloom occurred in St. Joe Bay that closed scalloping for most of the season.
We began a seagrass monitoring project with the University of West Florida. This was a tough year to begin due to the poor visibility, but we will continue in 2018.
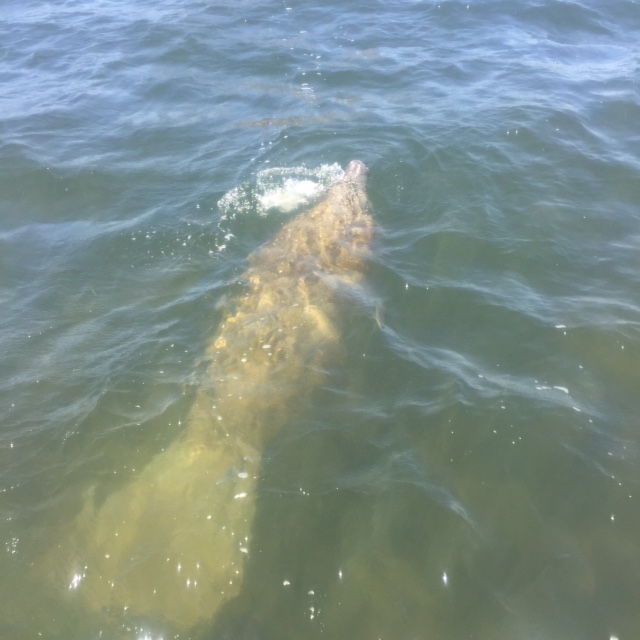
Manatee sightings were reported in Big Lagoon and Santa Rosa Sound. Again, this is not that unusual but the number of sightings, the number of manatees together, and the length of time they remained in the bay were.
And then the mangroves – nine red mangroves were reported in Big Lagoon. Sea Grant will be working with Dauphin Island Sea Lab and resource managers from NERRS in Florida, Alabama and Mississippi to search for more mangroves in the northern Gulf in 2018.
And the rain continued…
Rain storms are common when the Bermuda High is in the western Atlantic. Photo: Stuart Health, NOAA
As summer moves into fall the Bermuda High typically begins to slide eastward, taking with it the “protection” from summer hurricanes – and the hurricanes came. First, it was Harvey, then Irma, then Maria, and then Nate. All had their impacts on the area.
First were the flamingos in Pensacola, three of them, photographed in different locations around the bay – then they were gone.
Numerous flocks of white pelicans. They typically fly through the area but there appeared to be more than we normally see and reports of them landing across the area increased.
We received calls about “invasive” plants growing in the bayou – which turned out to be freshwater plants that had taken advantage of the freshwater conditions in our bayous from the heavy rains.
The snake encounters did not decrease
The mangroves continued to grow
The manatee sightings continued into the fall
And the rain continued
How did this season fare with local seafood (Escambia County only)?
There was a 17% decrease in the number of species harvested – from 59 to 49
And an 11% decrease in the price/lb. fishers received for their seafood – from $2.20/lb. to $1.95/lb.
But there was a 33% increase in the pounds of seafood reported – from 839,673 to 1,121,225 lbs.
A 38% increase in the number of trips reported – from 2,658 to 3,664 trips
And a 25% increase in the estimated value of the local seafood harvest – from $1,589,518 to $1,991,286 – vermillion snapper, red snapper, and striped mullet remain our top three target species.
Manatee swimming in Big Lagoon near Pensacola. Photo: Marsha Stanton
We are now moving into winter. The Bermuda High has moved across the Atlantic. This typically begins a dry season – and it has been dry for several weeks. It also allows cold fronts to reach the coast – and they did. On December 9, it snowed in Pensacola. Who knows what 2018 will bring but we will continue to be in the field monitoring and observing. There are opportunities for locals to volunteer for some of our monitoring projects, and there are other agencies and NGOs in the area seeking volunteers for monitoring and restoration projects. Join us if you like, and have a very happy holiday season.